. 2020 Oct 6:14:596439.
doi: 10.3389/fnana.2020.596439. eCollection 2020.

Histological Evidence for the Enteric Nervous System and the Choroid Plexus as Alternative Routes of Neuroinvasion by SARS-CoV2

Affiliations

Histological Evidence for the Enteric Nervous System and the Choroid Plexus as Alternative Routes of Neuroinvasion by SARS-CoV2

Felix Deffner et al. Front Neuroanat. .

Abstract

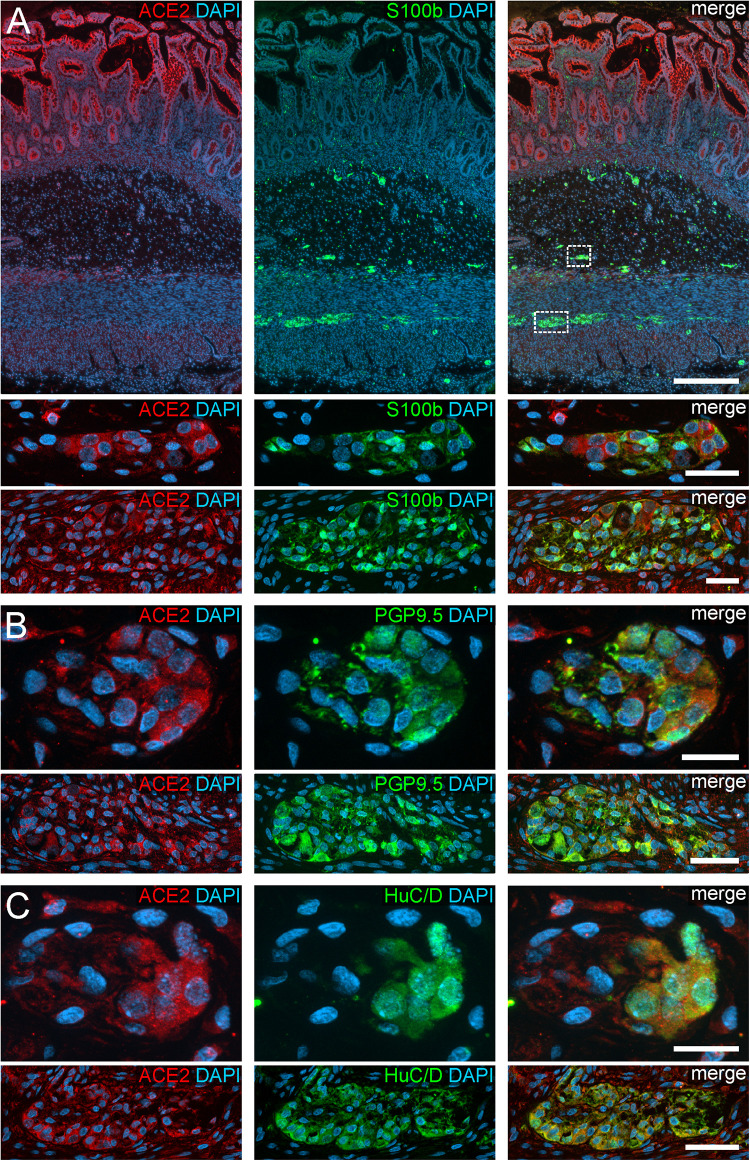
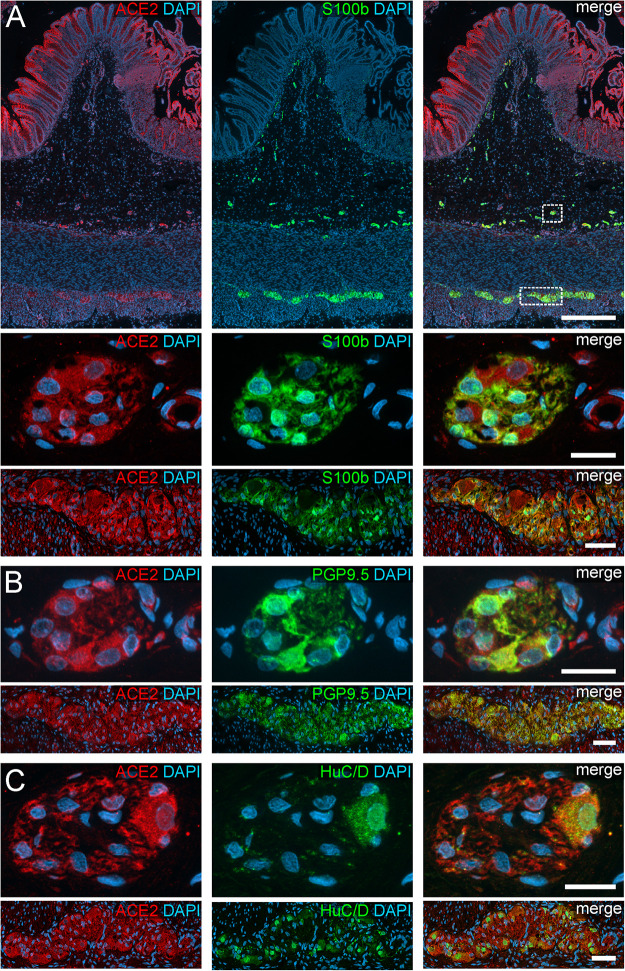
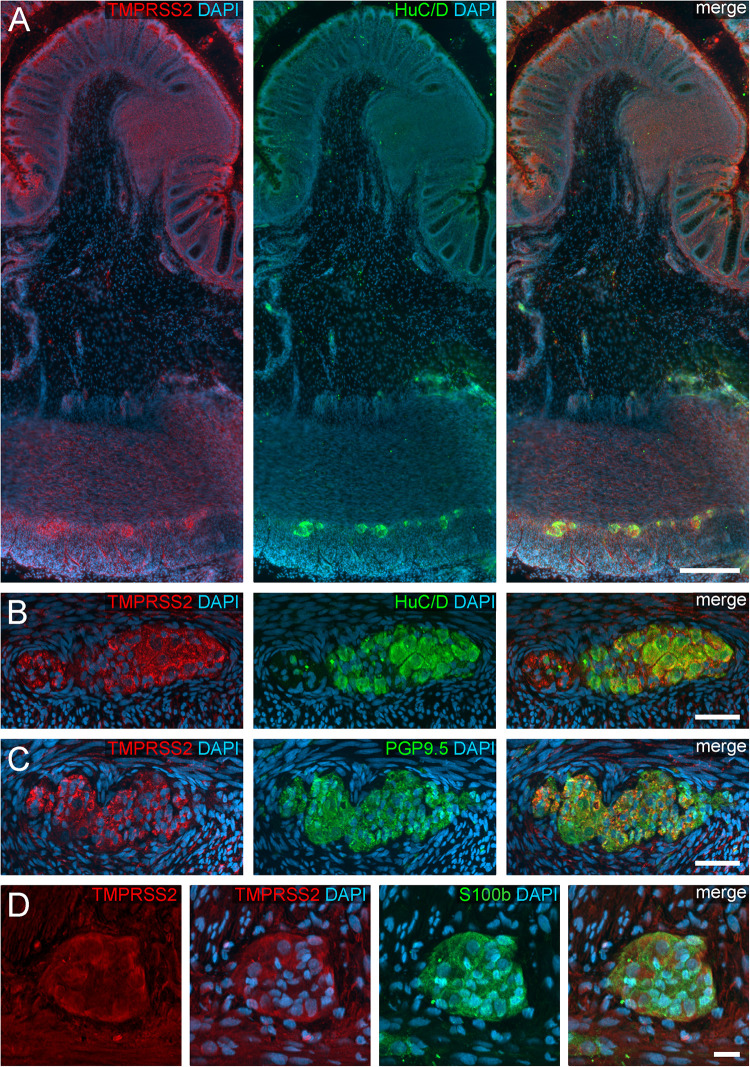
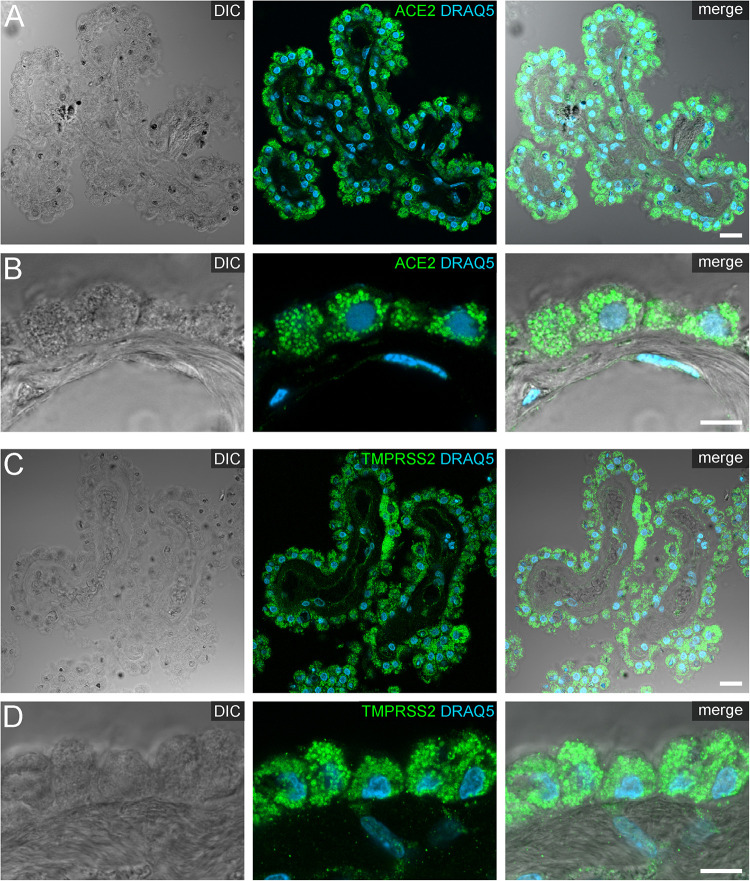
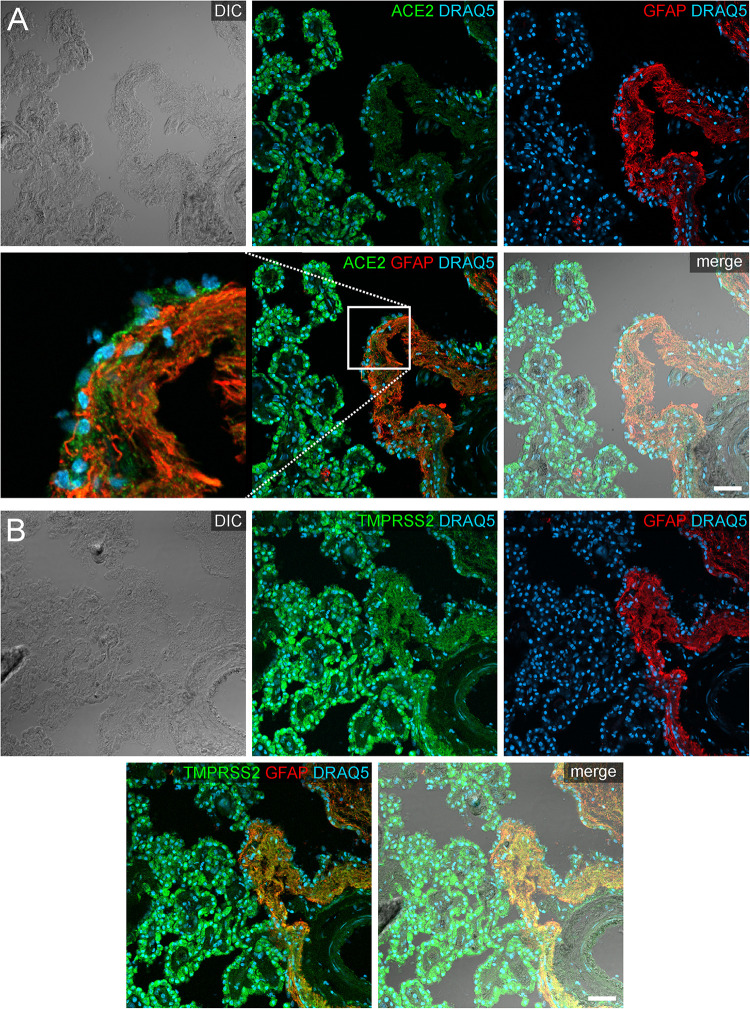
Evidence is mounting that the novel corona virus SARS-CoV2 inflicts neurological symptoms in a subgroup of COVID-19 patients. While plenty of theories on the route of neuroinvasion have been proposed, little histological evidence has been presented supporting any of these hypotheses. Therefore, we carried out immunostainings for ACE2 and TMPRSS2, two proteinases crucial for the entry of SARS-CoV2 into host cells, in the human enteric nervous system (ENS), as well as in the choroid plexus of the lateral ventricles. Both of these sites are important, yet often neglected entry gates to the nervous system. We found that ACE2 and TMPRSS2 are expressed by enteric neurons and glial cells of the small and large intestine, as well as choroid plexus epithelial cells, indicating that these cells meet the molecular requirements for viral entry. Together, our results are fundamental histological evidence substantiating current theories of neuroinvasion by SARS-CoV2.

Keywords: SARS-CoV2; choroid plexus; enteric nervous system; neuro-COVID; neuroinvasion.


Figures

FIGURE 1
FIGURE 1
ACE2 expression in the human ENS of the small intestine. (A) Overview of the entire gut wall of a small intestinal segment with immunofluorescence stainings for ACE2 (red), the glial marker S100b (green), and with the nuclear marker DAPI (blue). The white rectangles indicate the location of the high power magnification micrographs below showing a representative submucous and myenteric ganglion. (B,C) show representative submucous and myenteric ganglia stained for ACE2 (red), DAPI (blue), and the neuronal markers PGP9.5 (B, red) or HuC/D (C, red). Clearly, a positive staining can be found in enteric neurons and, less intense, in glial cells. The overview is a standard epifluorescence image; details are maximum intensity projections of optical sections by structured illumination. Scale bars: overview 250 μm; details 50 μm.
FIGURE 2
FIGURE 2
ACE2 expression in the human ENS of the large intestine. (A) Overview of the entire gut wall of a colon segment with immunofluorescence stainings for ACE2 (red), the glial marker S100b (green), and with the nuclear marker DAPI (blue). The white rectangles indicate the location of the high power magnification micrographs below showing a representative submucous and myenteric ganglion. (B,C) show representative submucous and myenteric ganglia stained for ACE2 (red), DAPI (blue), and the neuronal markers PGP9.5 (B, red) or HuC/D (C, red). The ACE2 staining can be found in neurons and glial cells and is considerably stronger in the colon compared to the small intestine. The overview is a standard epifluorescence image; details are maximum intensity projections of optical sections by structured illumination. Scale bars: overview 250 μm; details 50 μm.
FIGURE 3
FIGURE 3
TMPRSS2 expression in the human ENS. (A) Overview of the entire gut wall of a colon segment with immunofluorescence stainings for TMPRSS2 (red), the neuronal marker HuC/D (green), and the nuclear marker DAPI (blue). (B,C) show representative large intestinal myenteric ganglia stained for TMPRSS2 (red), DAPI (blue), and the neuronal markers HuC/D (B, red) or PGP9.5 (C, red). (D) Representative myenteric ganglion in the small intestine stained for TMPRSS2 (red), the glial marker S100b (green), and the nuclear marker DAPI (blue). Note that TMPRSS2 stainings were markedly stronger in enteric ganglia in the colon (A–C) than in the small intestine (D). The overview is a standard epifluorescence image; details are maximum intensity projections of optical sections by structured illumination. Scale bars: (A) 250 μm; (B–D) 50 μm.
FIGURE 4
FIGURE 4
Expression of ACE2 and TMPRSS2 in the human choroid plexus. (A) Overview and (B) high power images of sections through the human choroid plexus of the lateral ventricle, in a transmitted light DIC image (left), immunostained for ACE2 (green) and the nuclear marker DRAQ5 (blue; middle). (B) Shows representative plexus epithelial cells clearly positive for ACE2 (green). (C) Overview and (D) high power images of sections through the human choroid plexus of the lateral ventricle immunostained for TMPRSS2 (green) and the nuclear marker DRAQ5 (blue; middle). (D) Shows that TMPRSS2 has a similar distribution in choroid plexus epithelial as ACE2. All images are single optical sections (pinhole size 1 AU). Scale bars: (A,C) 20 μm; (B,D) 10 μm.
FIGURE 5
FIGURE 5
Expression of ACE2 and TMPRSS2 at the taenia choroidea. (A) Shows a DIC image of the interface between the human choroid plexus of the lateral ventricle and the brain parenchyma (i.e., taenia choroidea), as well as stainings for ACE2 (green), the glial marker GFAP (red), and the nuclear marker DRAQ5 (blue). The white rectangle indicates the location of the high power magnification micrograph showing ACE2 expression in ependymal cells at the ventricular surface. The immunoreactivity for ACE2 is much higher in plexus epithelial cells than in ependymal cells or astrocytic processes. (B) Shows a corresponding section as a DIC image and with stainings for TMPRSS2 (green), the glial marker GFAP (red), and the nuclear marker DRAQ5 (blue). Compared to the strong staining for TMPRSS2 in the plexus epithelial cells, astrocyte processes are weakly stained. All images are single optical sections (pinhole size 1 AU). Scale bars: 50 μm.

References

    1. Bassotti G., Villanacci V., Antonelli E., Morelli A., Salerni B. (2007). Enteric glial cells: new players in gastrointestinal motility? Lab Invest. 87 628–632. 10.1038/labinvest.3700564 - DOI - PubMed
    1. Bilinska K., Jakubowska P., Von Bartheld C. S., Butowt R. (2020). Expression of the SARS-CoV-2 entry proteins, ACE2 and TMPRSS2, in cells of the olfactory epithelium: identification of cell types and trends with age. ACS Chem. Neurosci. 11 1555–1562. 10.1021/acschemneuro.0c00210 - DOI - PMC - PubMed
    1. Bösel J., Berlit P. (2020). Neurological effects of COVID-19. DGNeurologie 3 277–284. 10.1007/s42451-020-00191-9.) - DOI
    1. Briguglio M., Bona A., Porta M., Dell’Osso B., Pregliasco F. E., Banfi G. (2020). Disentangling the hypothesis of host dysosmia and SARS-CoV-2: the bait symptom that hides neglected neurophysiological routes. Front. Physiol. 11:671. - PMC - PubMed
    1. Brun P., Giron M. C., Zoppellaro C., Bin A., Porzionato A., De Caro R., et al. (2010). Herpes simplex virus type 1 infection of the rat enteric nervous system evokes small-bowel neuromuscular abnormalities. Gastroenterology 138 1790–1801. 10.1053/j.gastro.2010.01.036 - DOI - PubMed