. 2020 Oct 2:11:551683.
doi: 10.3389/fphar.2020.551683. eCollection 2020.

Onion Bulb Extract Downregulates EGFR/ERK1/2/AKT Signaling Pathway and Synergizes With Steroids to Inhibit Allergic Inflammation

Affiliations

Onion Bulb Extract Downregulates EGFR/ERK1/2/AKT Signaling Pathway and Synergizes With Steroids to Inhibit Allergic Inflammation

Ahmed Z El-Hashim et al. Front Pharmacol. .

Abstract

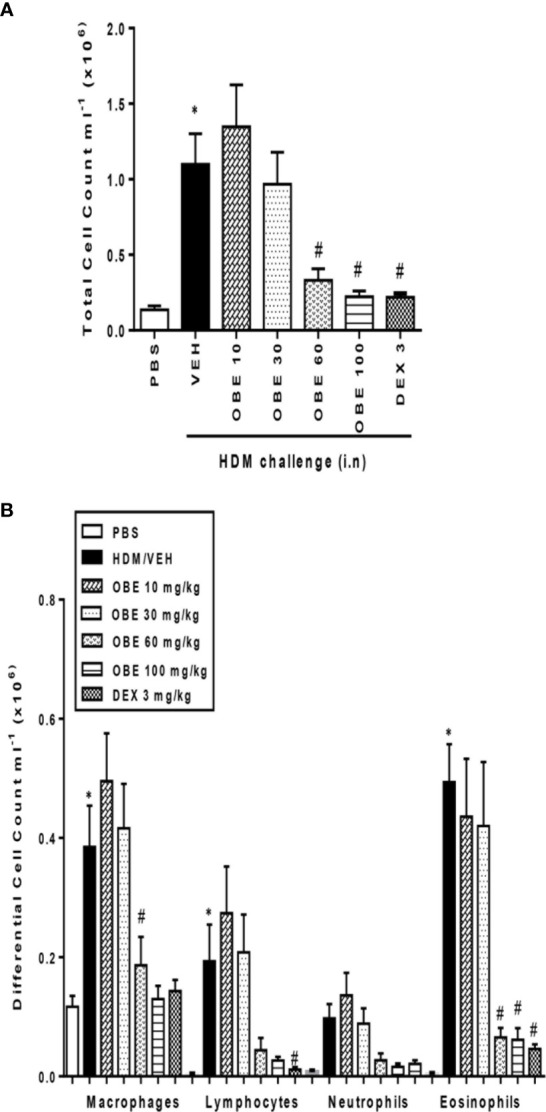
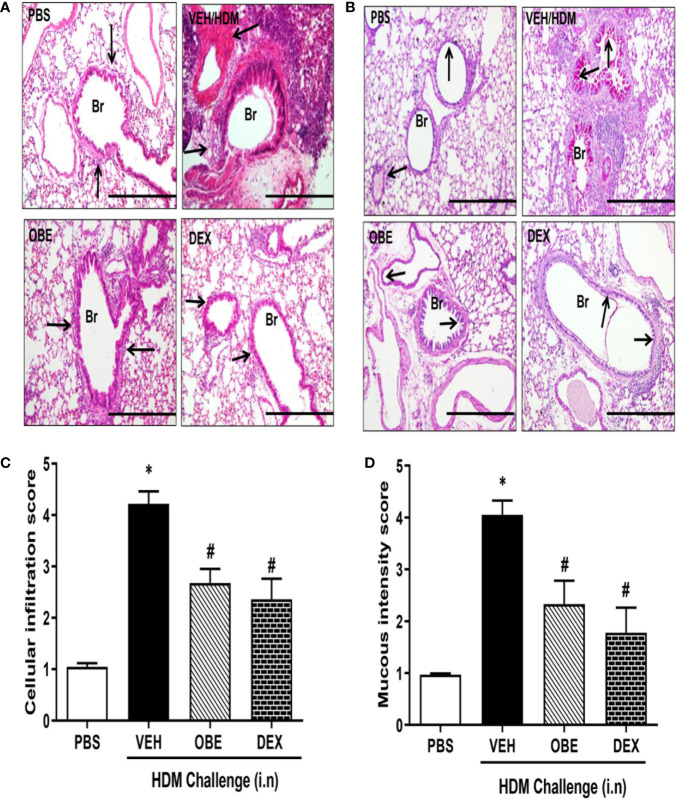
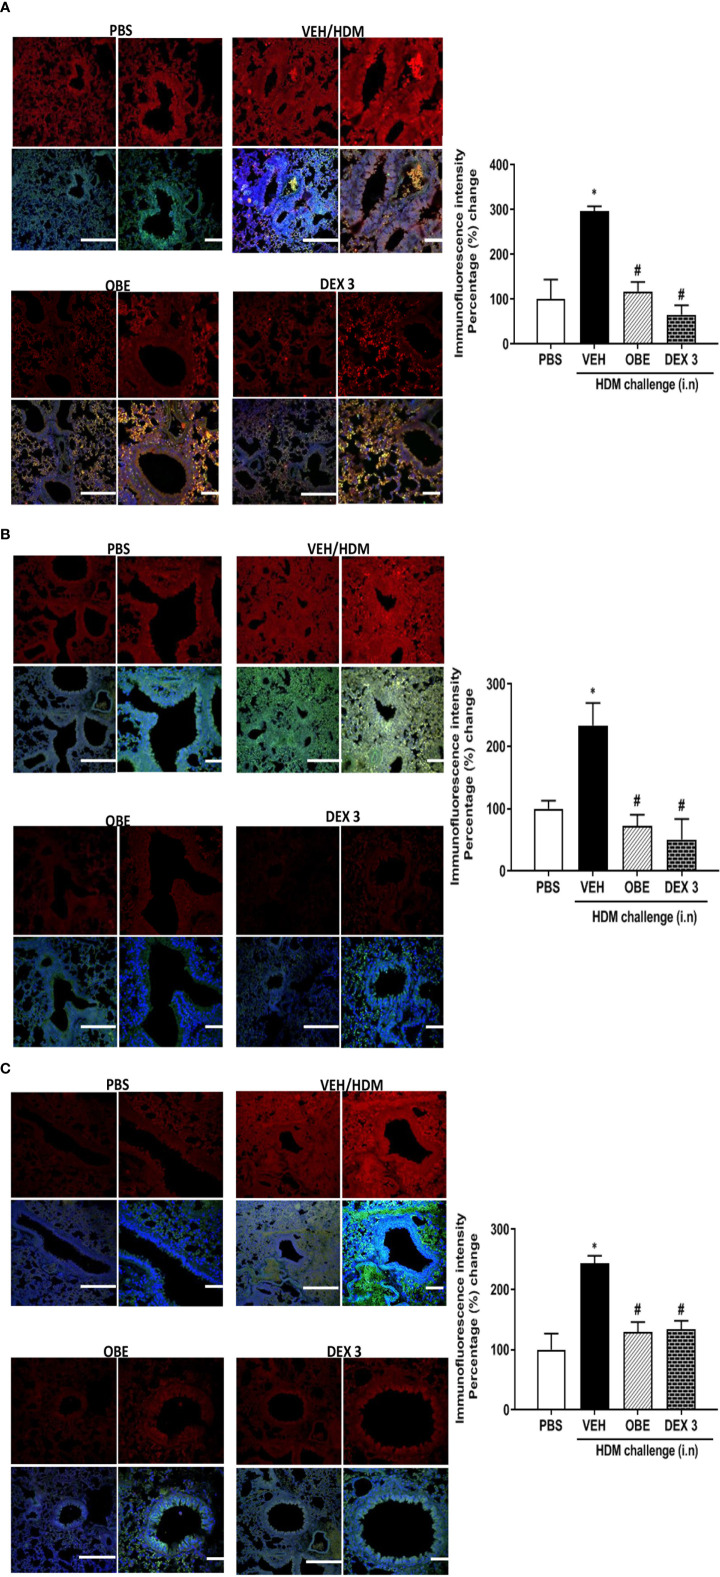
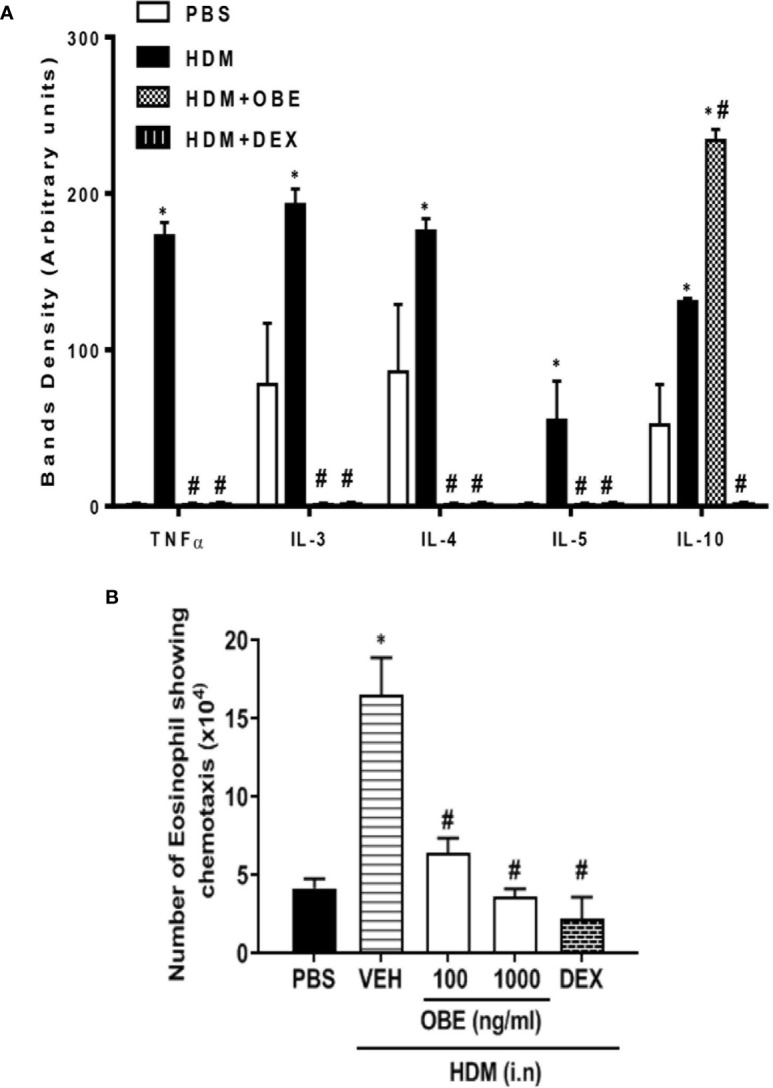
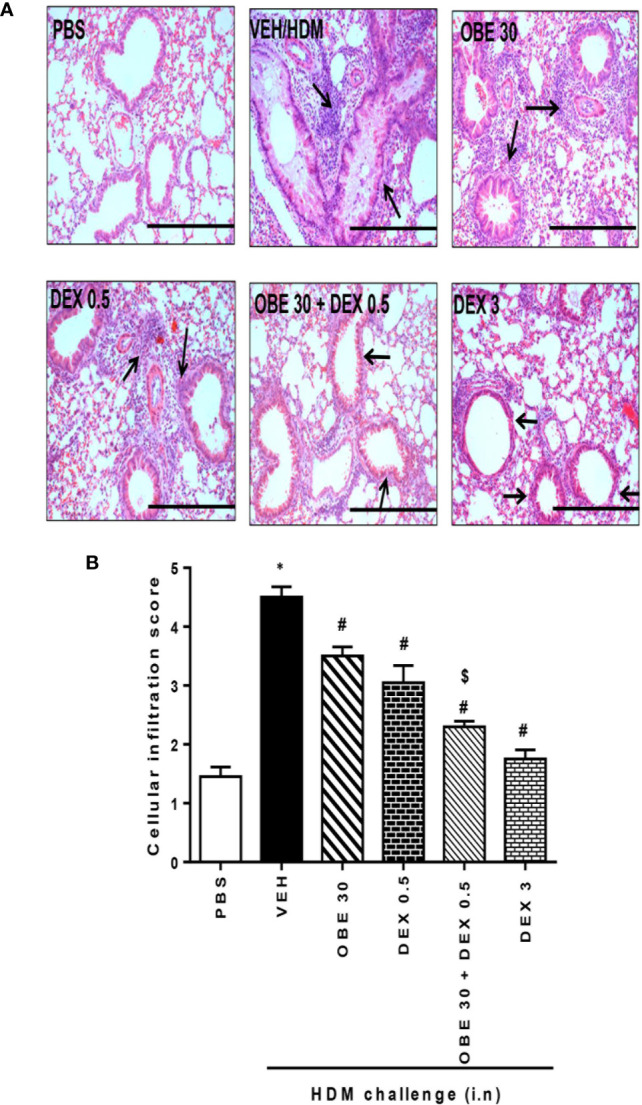
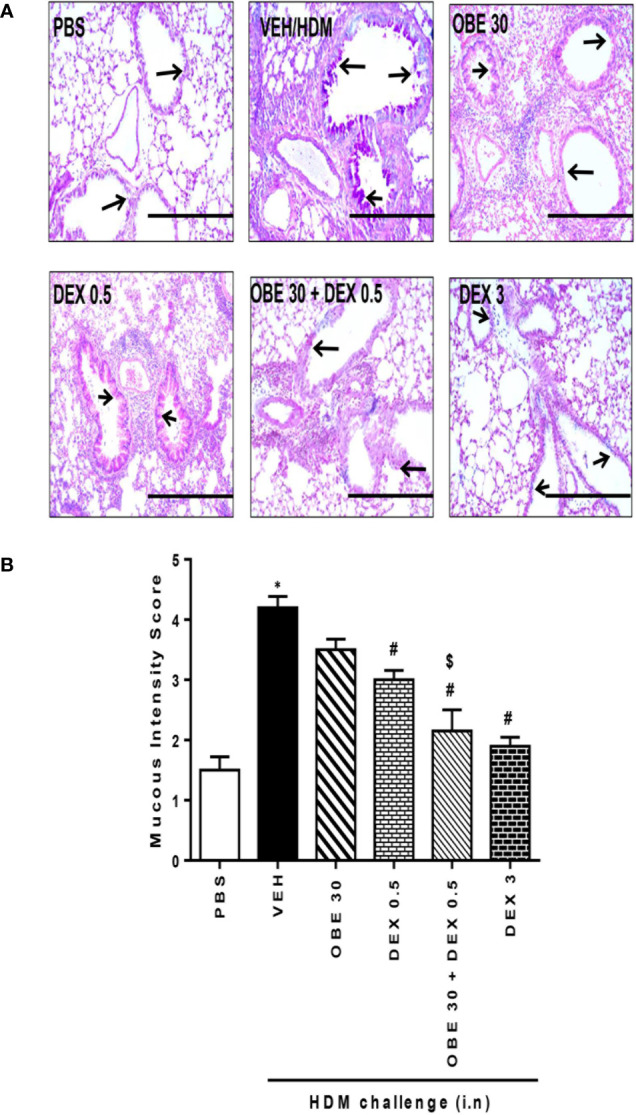
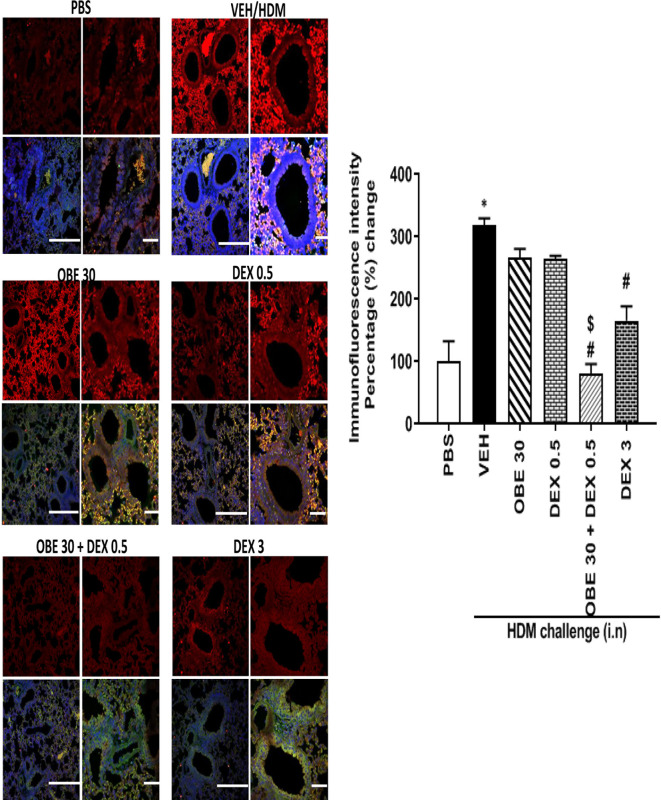
The treatment of allergic diseases, such as asthma, with both conventional and novel therapies presents a challenge both in terms of optimal effect and cost. On the other hand, traditional therapies utilizing natural products such as onion have been in use for centuries with demonstrated efficacy and safety but without much knowledge of their mechanims of action. In this study, we investigated if the anti-inflammatory effects of onion bulb extract (OBE) are mediated via the modulation of the EGFR/ERK1/2/AKT signaling pathway, and whether OBE can synergise with steroids to produce greater anti-inflammatory actions. Treatment with OBE inhibited the house dust mite (HDM)-induced increased phosphorylation of EGFR, ERK1/2 and AKT which resulted in the inhibition of HDM-induced increase in airway cellular influx, perivascular and peribronchial inflammation, goblet cell hyper/metaplasia, and also inhibited ex vivo eosinophil chemotaxis. Moreover, treatment with a combination of a low dose OBE and low dose dexamethasone resulted in a significant inhibition of the HDM-induced cellular influx, perivascular and peribronchial inflammation, goblet cell hyper/metaplasia, and increased the pERK1/2 levels, whereas neither treatment, when given alone, had any discernible effects. This study therefore shows that inhibition of the EGFR/ERK1/2/AKT-dependent signaling pathway is one of the key mechanisms by which OBE can mediate its anti-inflammatory effects in diseases such as asthma. Importantly, this study also demonstrates that combining OBE with steroids results in significantly enhanced anti-inflammatory effects. This action may have important potential implications for future asthma therapy.

Keywords: asthma; onion (Allium cepa Hysam); signalling; steroids; synergisctic effects.


Figures

Figure 1
Figure 1
Schemactic representation of the immunization and the treatment protocol used for boh the prophylactic and synergistic studies.
Figure 2
Figure 2
(A) GC–MS total ion chromatogram (TIC) of OBE. Peaks were identified through comparison with mass spectral data in the NIST MS Search 2.0 library stored in the GC–MS system and are represented in Table 1. (B) Mass spectra of compounds eluted with retention times 8.56–46.25 min and presented in Table 1.
Figure 3
Figure 3
Effect of OBE, 10, 30, 60, and 100 mg/kg (i.p.) on HDM-induced increase in (A) total cell and (B) differential cell count. OBE treatment resulted in a dose-dependent inhibition of total and eosinophil numbers. Data are expressed as mean ± SEM (n = 9–15) *P < 0.05 vs PBS group, #P < 0.05 vs HDM group.
Figure 4
Figure 4
Effect of OBE (60 mg/kg; i.p.) on HDM-induced histopathological changes: (A) representative low-magnification light photomicrographs displaying (A) H&E and (B) PAS staining of whole lung samples from control PBS-challenged mice (PBS), HDM-challenged mice (HDM), HDM-challenged mice pretreated with OBE (60 mg/kg; i.p.) (OBE) and HDM-challenged mice pretreated with dexamethasone (3 mg/kg; i.p.) (DEX), scale bar = 200µm. Graphs shows (C) cellular infiltration and (D) mucous intensity score for H&E and PAS staining, respectively. OBE treatment resulted in a significant decrease in both peribronchial and perivascular inflammatory cell infiltrations and bronchial mucus production and goblet cell hyper/metaplasia compared with HDM-challenged vehicle treated mice. Data are expressed as mean ± SEM (n = 3–6). *P < 0.05 vs PBS group, #P < 0.05 vs HDM group.
Figures 5
Figures 5
Immunofluorescent (Alexa Fluor) detection of pEGFR (A) pERK1/2 (B) and pAKT (C) shown in the upper panels overlaid with DAPI stain on the lower panel to show lung tissue architecture. Lung sections were taken from different treatment groups: PBS-challenged mice (PBS), HDM-challenged mice pretreated with vehicle (HDM), HDM-challenged mice pretreated with OBE (60 mg/kg; i.p.) (OBE), and HDM-challenged mice pretreated with dexamethasone (DEX) and immunostained for pEGFR, pERK, and pAKT. PBS-treated mice showed minimal pEGFR, pERK1/2, and pAKT expression. HDM challenge resulted in a significant increase in pEGFR, pERK, and pAKT expression, and this was inhibited following treatment with OBE (60 mg/kg; i.p.) and was comparable to the dexamethasone-treated animals, scale bar = 50 µm. Graphs show quantitative assessment of fluorescence intensity of pEGFR, pERK1/2, and pAKT (arbitrary units). Data are expressed as mean ± SEM (n = 3–5). *P < 0.05 vs PBS group, #P < 0.05 vs HDM group.
Figure 6
Figure 6
(A) Western blot analysis of pERK1/2 and total ERK1/2 protein levels from lungs of PBS-challenged mice pretreated with vehicle (PBS), HDM-challenged mice pretreated with vehicle (HDM), HDM-challenged mice pretreated with OBE (60 mg/kg; i.p.) (OBE) and HDM-challenged mice pretreated with dexamethasone (DEX). The blots are of two pooled lung sample (n = 3, for each). (B) Graph b shows relative densitometric quantification levels of pERK1/2 (relative to total ERK1/2, both normalized to β-actin).
Figure 7
Figure 7
(A) Effect of OBE treatment (60 mg/kg; i.p.) on the airway expression of various pro-inflammatory cytokines. HDM challenge significantly enhanced the expression of the following interleukins (IL): IL-3, IL-4, IL-5, IL-10, and tumor necrosis factor (TNF-α). Treatment with OBE significantly reduced the expression of these cytokines except IL-10 which was significantly increased above the HDM levels. Data are expressed as mean ± SEM (n = 4). *P < 0.05 vs PBS group, #P < 0.05 vs HDM group. (B) Effect of OBE (100 and 1,000 ng/ml) on HDM/BALF-induced eosinophil chemotaxis. BALF from HDM-challenged mice induced a significant increase in eosinophil chemotaxis compared to BALF from PBS-challenged mice. Pretreatment with OBE (100 and 1,000 ng/ml) dose-dependently inhibited eosinophil chemotaxis. Data are expressed as mean ± SEM (n = 5). *P < 0.05 vs PBS group, #P < 0.05 vs HDM group.
Figure 8
Figure 8
Effect of OBE treatment on HDM-induced AHR to inhaled methacholine. HDM challenged mice demonstrated significant AHR compared to the control group at doses 25 and 50 mg/kg of methacholine. Treatment with dexamethasone (3 mg/kg; i.p.) significantly reduced the HDM-induced AHR. However, treatment with OBE (60 mg/kg; i.p.) did not significantly reduce the average RL in comparison with the HDM-challenged/vehicle-treated group at any of the doses of methacholine tested (P > 0.05). Data are expressed as mean ± SEM (n = 6–13). *P < 0.05 vs PBS group, #P < 0.05 for HDM group vs DEX group.
Figure 9
Figure 9
Effect of OBE (30 mg/kg; i.p.) both alone and in combination with low dexamethasone (0.5 mg/kg) on HDM-induced increase in (A) total cell and (B) differential cell count. Treatment with OBE, in combination with low dose dexamethasone, resulted in a significant inhibition of both total and eosinophil numbers compared to either treatment alone. Data are expressed as mean ± SEM (n = 7–11). *P < 0.05 vs PBS group, #P < 0.05 vs HDM group and $P < 0.05 versus either OBE (30 mg/kg; i.p.) alone or dexamethasone (0.5 mg/kg/i.p.) alone.
Figure 10
Figure 10
Effect of OBE (30 mg/kg; i.p.) alone and in combination with low dexamethasone (0.5 mg/kg) on HDM-induced peribronchial and perivascular inflammatory cell infiltrations. (A) Representative low-magnification light photomicrographs displaying H&E staining of whole lung samples from control PBS-challenged mice (PBS), HDM-challenged mice (HDM), HDM-challenged mice pretreated with OBE (30 mg/kg; i.p.) (OBE 30), HDM-challenged mice pretreated with low dexamethasone treated (0.5 mg/kg; i.p.) (DEX 0.5), HDM-challenged mice pretreated with a combination of OBE (30 mg/kg; i.p.) and low dexamethasone treated (0.5 mg/kg; i.p.) (DEX 30 + DEX 0.5), HDM-challenged mice pretreated with high dose dexamethasone (3 mg/kg; i.p.) (DEX 3), scale bar = 200 µm. Graphs shows (B) cellular infiltration score for H&E. OBE treatment in combination with low dose dexamethasone resulted in a significant decrease in both peribronchial and perivascular inflammatory compared to either treatment when give alone. Data are expressed as mean ± SEM (n = 5). *P < 0.05 vs PBS, #P < 0.05 vs HDM and $P < 0.05 versus either OBE (30 mg/kg; i.p.) alone group or dexamethasone (0.5 mg/kg/i.p.) alone group.
Figure 11
Figure 11
Effect of OBE (30 mg/kg; i.p.) both alone and in combination with low dexamethasone (0.5 mg/kg) on HDM-induced bronchial mucous production and goblet cell hyper/metaplasia. (A) Representative low-magnification light photomicrographs displaying PAS staining of whole lung samples from control PBS-challenged mice (PBS), HDM-challenged mice (HDM), HDM-challenged mice pretreated with OBE (30 mg/kg; i.p.) (OBE 30), HDM-challenged mice pretreated with low dose dexamethasone (0.5 mg/kg; i.p.) (DEX 0.5), HDM-challenged mice pretreated with a combination of OBE (30 mg/kg; i.p.) and low dose dexamethasone (0.5 mg/kg; i.p.) (OBE 30 + DEX 0.5), HDM-challenged mice pretreated with high dose dexamethasone (3 mg/kg; i.p.) (DEX 3), scale bar = 200µm. Graphs show (B) mucous intensity score. OBE treatment in combination with low dose dexamethasone resulted in a significant decrease in bronchial mucus production and goblet cell hyper/metaplasia compared to either treatment when give alone. Data are expressed as mean ± SEM (n = 5). *P < 0.05 vs PBS and #P < 0.05 vs HDM and $P < 0.05 versus either OBE (30 mg/kg; i.p.) alone group or dexamethasone (0.5 mg/kg/i.p.) alone group.
Figure 12
Figure 12
Immunofluorescence (Alexa Fluor) detection of phosphorylated ERK1/2 are shown in the upper panels overlaid with DAPI stain on the lower panel to show lung tissue architecture. Lung sections were taken from different treatment groups, control PBS-challenged mice (PBS), HDM-challenged mice (HDM), HDM-challenged mice pretreated with OBE (30 mg/kg; i.p.) (OBE 30), HDM-challenged mice pretreated with low dose dexamethasone (0.5 mg/kg; i.p.) (DEX 0.5), HDM-challenged mice pretreated with a combination of OBE (30 mg/kg; i.p.) and low dose dexamethasone (0.5 mg/kg; i.p.) (OBE 30 + DEX 0.5), HDM-challenged mice pretreated with high dose dexamethasone (3 mg/kg; i.p.) (DEX 3), scale bar = 50 µm. Graph shows quantitative assessment of fluorescence intensity of ERK (arbitrary units). Data are expressed as mean ± SEM (n = 4–5). *P < 0.05 vs PBS and #P < 0.05 vs HDM and $P < 0.05 versus either OBE (30 mg/kg; i.p.) alone group or dexamethasone (0.5 mg/kg/i.p.) alone group.

Similar articles

Cited by

References

    1. Abdel-Lateef E., Rabia I., Abdel-Gawad M., El-Sayed M. (2018). In vitro antischistosomal activity of Allium cepa L. (red onion) extracts and identification of the essential oil composition by GC-MS. J. Microbiol. Biotechnol. Food Sci. 7, 421–425. 10.15414/jmbfs.2018.7.4.421-425 - DOI
    1. Acciani T. H., Suzuki T., Trapnell B. C., Le Cras T. D. (2016). Epidermal growth factor receptor signalling regulates granulocyte-macrophage colony-stimulating factor production by airway epithelial cells and established allergic airway disease. Clin. Exp. Allergy 46 (2), 317–328. 10.1111/cea.12612 - DOI - PMC - PubMed
    1. Agache I., Beltran J., Akdis C., Akdis M., Canelo-Aybar C., Canonica W., et al. (2020). Efficacy and safety of treatment with biologicals (benralizumab, dupilumab, mepolizumab, omalizumab and reslizumab) for severe eosinophilic asthma. Allergy 75 (5), 1023–1042. 10.1111/all.14221 - DOI - PubMed
    1. Amishima M., Munakata M., Nasuhara Y., Sato A., Takahashi T., Homma Y., et al. (1998). Expression of epidermal growth factor and epidermal growth factor receptor immunoreactivity in the asthmatic human airway. Am. J. Respir. Crit. Care Med. 157 (6 Pt 1), 1907–1912. 10.1164/ajrccm.157.6.9609040 - DOI - PubMed
    1. Atanasov A. G., Waltenberger B., Pferschy-Wenzig E. M., Linder T., Wawrosch C., Uhrin P., et al. (2015). Discovery and resupply of pharmacologically active plant-derived natural products: a review. Biotechnol. Adv. 33 (8), 1582–1614. 10.1016/j.biotechadv.2015.08.001 - DOI - PMC - PubMed