. 2020 Oct 2:11:543758.
doi: 10.3389/fphys.2020.543758. eCollection 2020.

Molecular Characterization of a Novel Shell Matrix Protein With PDZ Domain From Mytilus coruscus

Affiliations

Molecular Characterization of a Novel Shell Matrix Protein With PDZ Domain From Mytilus coruscus

Qi Sun et al. Front Physiol. .

Abstract

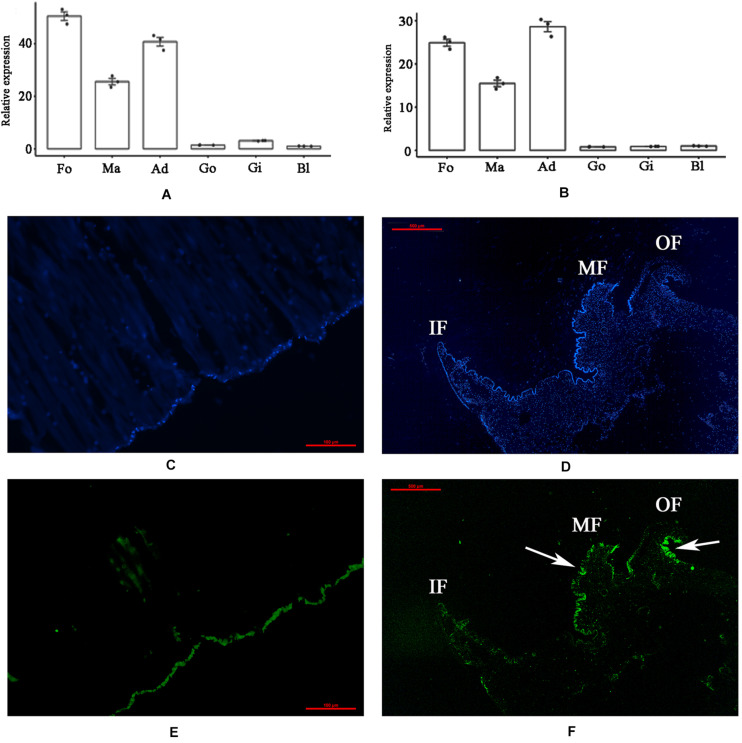
Mollusk shells are products of biomineralization and possess excellent mechanical properties, and shell matrix proteins (SMPs) have important functions in shell formation. A novel SMP with a PDZ domain (PDZ-domain-containing-protein-1, PDCP-1) was identified from the shell matrices of Mytilus coruscus. In this study, the gene expression, function, and location of PDCP-1 were analyzed. PDCP-1 was characterized as an ∼70 kDa protein with a PDZ (postsynaptic density/discs large/zonula occludes) domain and a ZM (ZASP-like motif) domain. The PDCP-1 gene has a high expression level and specific location in the foot, mantle and adductor muscle. Recombinantly expressed PDCP-1 (rPDCP-1) altered the morphology of calcite crystals, the polymorph of calcite crystals, binding with both calcite and aragonite crystals, and inhibition of the crystallization rate of calcite crystals. In addition, anti-rPDCP-1 antibody was prepared, and immunohistochemistry and immunofluorescence analyses revealed the specific location of PDCP-1 in the mantle, the adductor muscle, and the aragonite (nacre and myostracum) layer of the shell, suggesting multiple functions of PDCP-1 in biomineralization, muscle-shell attachment, and muscle attraction. Furthermore, pull-down analysis revealed 19 protein partners of PDCP-1 from the shell matrices, which accordingly provided a possible interaction network of PDCP-1 in the shell. These results expand the understanding of the functions of PDZ-domain-containing proteins (PDCPs) in biomineralization and the supramolecular chemistry that contributes to shell formation.

Keywords: Mytilus coruscus; PDZ-domain-containing protein; biomineralization; recombinant expression; shell matrix proteins.


Figures

FIGURE 1
FIGURE 1
Tissue-specific expression and in situ hybridization of PDCP-1 in adductor muscle and mantle. Ma, mantle; Ad, adductor muscle; Fo, foot; Go, gonad; Gi, gill; Bl, blood. Values presented by means ± SD of three replicates. (A) tissue-specific expression level of PDCP-1 in various tissues using β-actin as reference gene; (B) tissue-specific expression level of PDCP-1 in various tissues using 18s RNA as reference gene; (C) adductor muscle of control group; (D) mantle of control group; (E) expression of PDCP-1 (green color) in adductor muscle; (F) expression of PDCP-1 (green color) in mantle. The scale bar, 100 μm for (B,C), and 500 μm for (D,E). IF, inner fold; MF, middle fold; OF, outer fold.
FIGURE 2
FIGURE 2
Recombinant expression and purification of rPDCP-1. (A) SDS-PAGE of recombinant expressed rPDCP-1; (B) Western Blot of rPDCP-1; (C) isolation of rPDCP-1 by Ni-NTA column; (D) HPLC purification of rPDCP-1 after refolding. Lane M, protein marker; Lane PC1, BSA(1 mg); Lane PC2, BSA(2 mg); Lane NC, cell lysate of negative control without IPTG induction; Lane 1, cell lysate with IPTG induction for 16 h at 15°C; Lane 2, cell lysate with IPTG induction for 4 h at 37°C; Lane NC1, the supernatant of cell lysate without IPTG induction; Lane 3, the supernatant of cell lysate with IPTG induction for 16 h at 15°C; Lane 4, the supernatant of cell lysate with IPTG induction for 4 h at 37°C; Lane NC2, the debris of cell lysate without IPTG induction; Lane 5, the debris of cell lysate with IPTG induction for 16 h at 15°C; Lane 6, the debris of cell lysate with IPTG induction for 4 h at 37°C; Lane 7, isolation of rPDCP-1 by Ni-column after sample loading and eluted by 10 mM imidazole; Lane 8, eluted rPDCP-1 by 30 mM imidazole; Lane 9, eluted rPDCP-1 by 100 mM imidazole; Lane 10, eluted rPDCP-1 by 300 mM imidazole. The protein band with ∼80 kDa (indicated by an arrow) corresponds to the rPDCP-1. The primary antibody for Western Blot is anti-His6 antibody (GenScript, Cat.No.A00186).
FIGURE 3
FIGURE 3
SEM images and FTIP spectra of in vitro calcite crystallization in the presence of rPDCP-1 at increasing concentrations. (A) control calcite crystals grown without induction; (B) calcite crystals grown with 50 μg/mL BSA; (C) crystals grown with 10 μg/mL rPDCP-1; (D) calcite crystals grown with 30 μg/mL rPDCP-1. (E) calcite crystals grown with 50 μg/mL rPDCP-1. (F) enlarged image of (E); (G) FTIR spectrum of control calcite; (H) FTIR spectrum of calcite crystals induced by 50 μg/mL rPDCP-1. Arrows indicate the characteristic peaks of aragonite induced by rPDCP-1. The circles represent characteristic peaks of calcite. Scale bar: 50 μm for (A,D), 100 μm for (B,C,E), 20 μm for (F).
FIGURE 4
FIGURE 4
SEM images of in vitro aragonite crystallization in the presence of rPDCP-1 at increasing concentrations. (A) control aragonite crystals; (B) aragonite crystals grown with 50 μg/mL BSA; (C) aragonite crystals grown with 10 μg/mL rPDCP-1; (D) aragonite crystals grown with 30 μg/mL rPDCP-1; (E) aragonite crystals grown with 50 μg/mL rPDCP-1; (F) enlarged image of (E); (G) FTIR spectrum of control aragonite; (H) FTIR spectrum of aragonite crystals induced by 50 μg/mL rPDCP-1. The triangles represent characteristic peaks of aragonite. Scale bar: 40 μm for (A–D), 100 μm for (E), 20 μm for (F).
FIGURE 5
FIGURE 5
The crystallization rate inhibition of rPDCP-1 in calcite (A) and aragonite (B), and the binding ability of rPDCP-1 with calcite and aragonite (C) respectively. The Data of (A,B) are represented by mean ± SD (n = 3). p < 0.05; ∗∗p < 0.01. Lane M, protein marker; lane 1, the control rPDCP-1; Lane 2, the supernatant of the solution after that the rPDCP-1 was precipitated by CaCO3 crystals; Lane 3, the rPDCP-1 released from the precipitate of CaCO3 crystals.
FIGURE 6
FIGURE 6
Western blot and immunohistochemistry analysis of PDCP-1. (A) Western blotting by anti-rPDCP-1 antibody in shell matrices (right panel) and the protein band intensity of PDCP-1 expressed as a bar diagram as a ratio, relative to beta-actin (left panel). M, protein marker; 1, acid-soluble fraction from the fibrous prismatic layer; 2, acid-soluble fraction from the nacre layer; 3, acid-soluble fraction from the myostracum layer; 4, acid-insoluble fraction from the fibrous prismatic layer; 5, acid-insoluble fraction from the myostracum layer; 6, acid-insoluble fraction from the nacre layer; (B) immunohistochemistry analysis with the control group of adductor muscle performed using only second antibody showed no significant signals; (C) detection of PDCP-1 in the adductor muscle and the positive signals are indicated by arrows; (D) the control group of mantle, showing the inner and the middle folds; (E) detection of PDCP-1 in the mantle and the positive signal is indicated by arrows; (F) the control group of mantle, showing the middle and the outer folds; (G) detection of PDCP-1 in the mantle and the positive signals are indicated by arrows. The scale bar, 50 μm.
FIGURE 7
FIGURE 7
BLI curves (from the raw data to the final fitting view) for the binding of rPDCP-1 to biosensors coated with actin.
FIGURE 8
FIGURE 8
Immunofluorescence location of native PDCP-1 (green at 488 nm) and actin (red at 555 nm) on the surface of decalcified shell samples of M. coruscus, and the deproteinized shell samples were used as negative controls. N, nacre; M, myostracum; FP, fibrous prism. The scale bar, 100 μm.

Similar articles

References

    1. Addadi L., Weiner S. (1985). Interactions between acidic proteins and crystals: stereochemical requirements in biomineralization. Proc. Natl. Acad. Sci. U.S.A. 82 4110–4114. 10.1073/pnas.82.12.4110 - DOI - PMC - PubMed
    1. Addadi L., Weiner S. (1986). Interactions between acidic macromolecules and structured crystal surfaces. Stereochemistry and biomineralization. Mol. Crys. Liquid Crystals 134 305–322. 10.1080/00268948608079592 - DOI
    1. Arivalagan J., Yarra T., Marie B., Sleight V. A., Duvernois-Berthet E., Clark M. S., et al. (2017). Insights from the shell proteome: biomineralization to adaptation. Mol. Biol. Evol. 34 66–77. 10.1093/molbev/msw219 - DOI - PMC - PubMed
    1. Banerjee J., Wedegaertner P. B. (2004). Identification of a novel sequence in PDZ-RhoGEF that mediates interaction with the actin cytoskeleton. Mol. Biol. Cell 15 1760–1775. 10.1091/mbc.e03-07-0527 - DOI - PMC - PubMed
    1. Barthelat F. (2010). Nacre from mollusk shells: a model for high-performance structural materials. Bioinspir. Biomim. 5:035001 10.1088/1748-3182/5/3/035001 - DOI - PubMed