. 2020 Oct 6:11:574082.
doi: 10.3389/fphys.2020.574082. eCollection 2020.

The Sensing Liver: Localization and Ligands for Hepatic Murine Olfactory and Taste Receptors

Affiliations

The Sensing Liver: Localization and Ligands for Hepatic Murine Olfactory and Taste Receptors

Ryan Kurtz et al. Front Physiol. .

Abstract

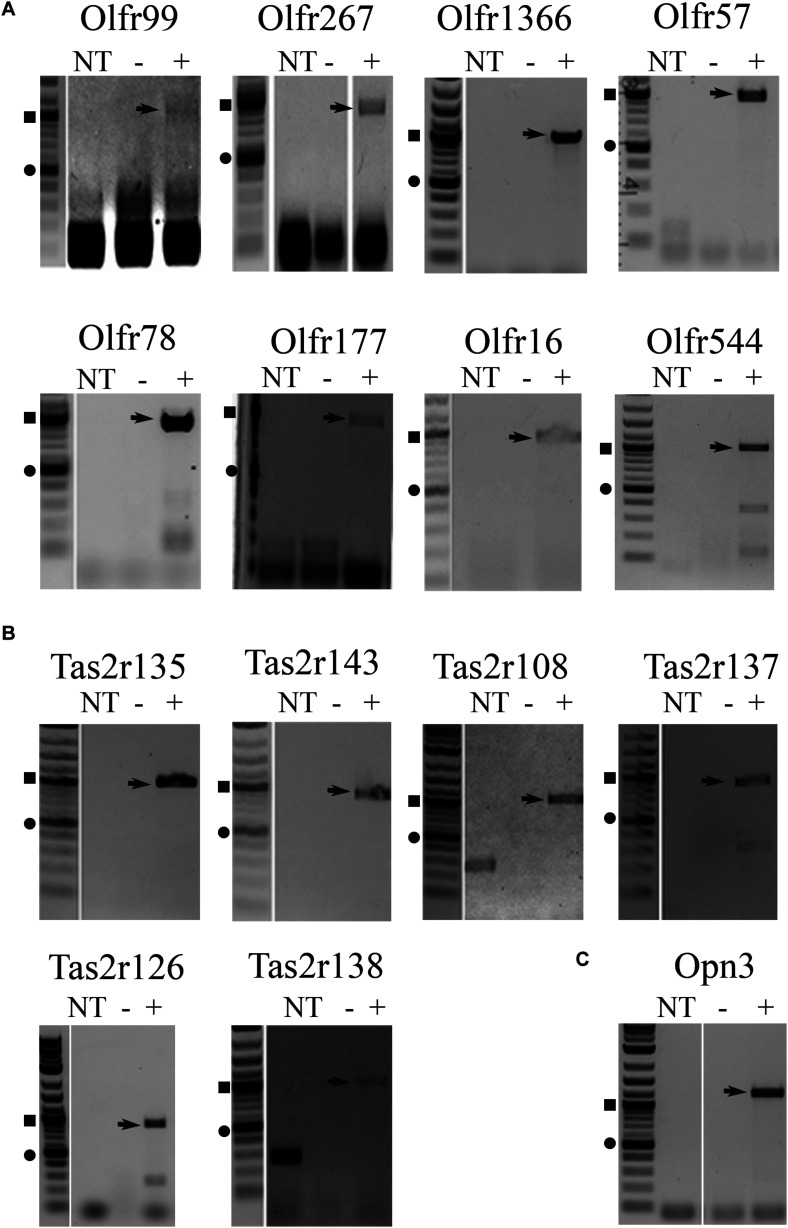
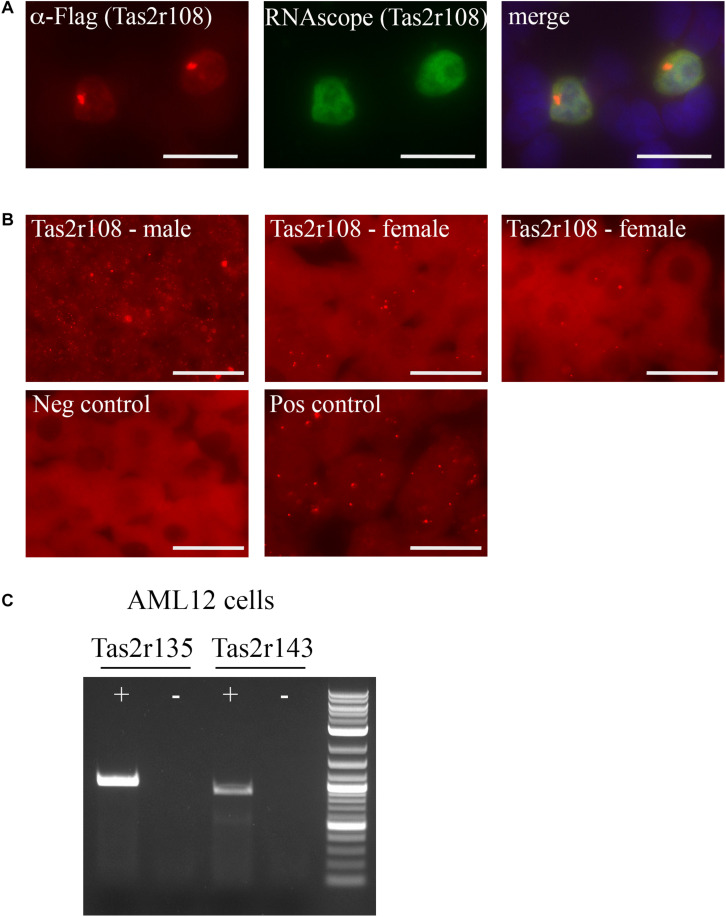
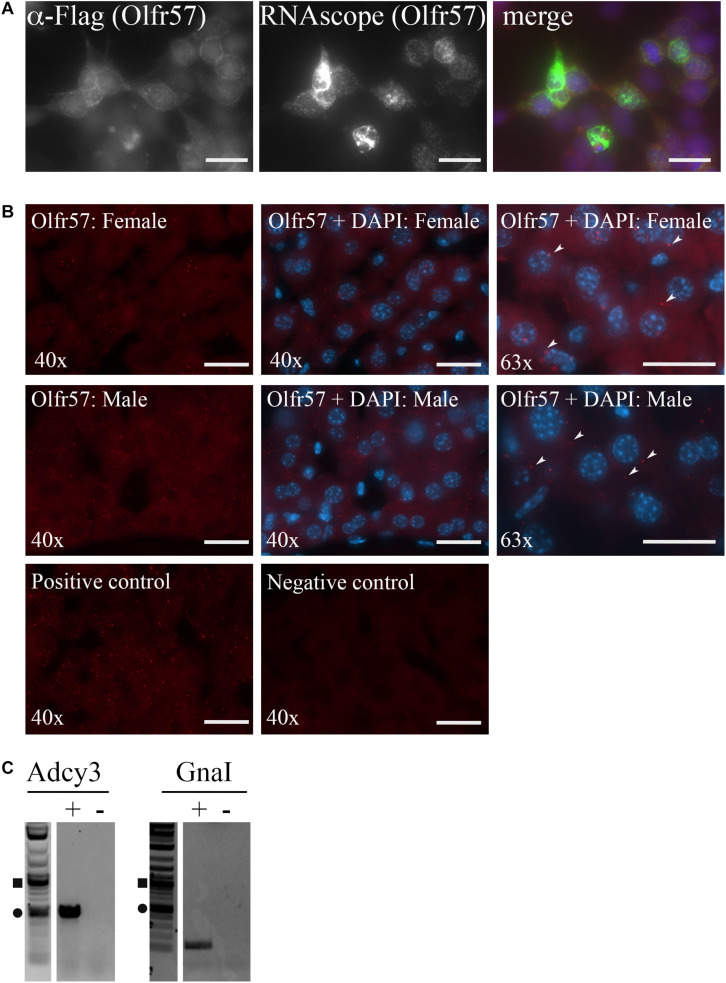
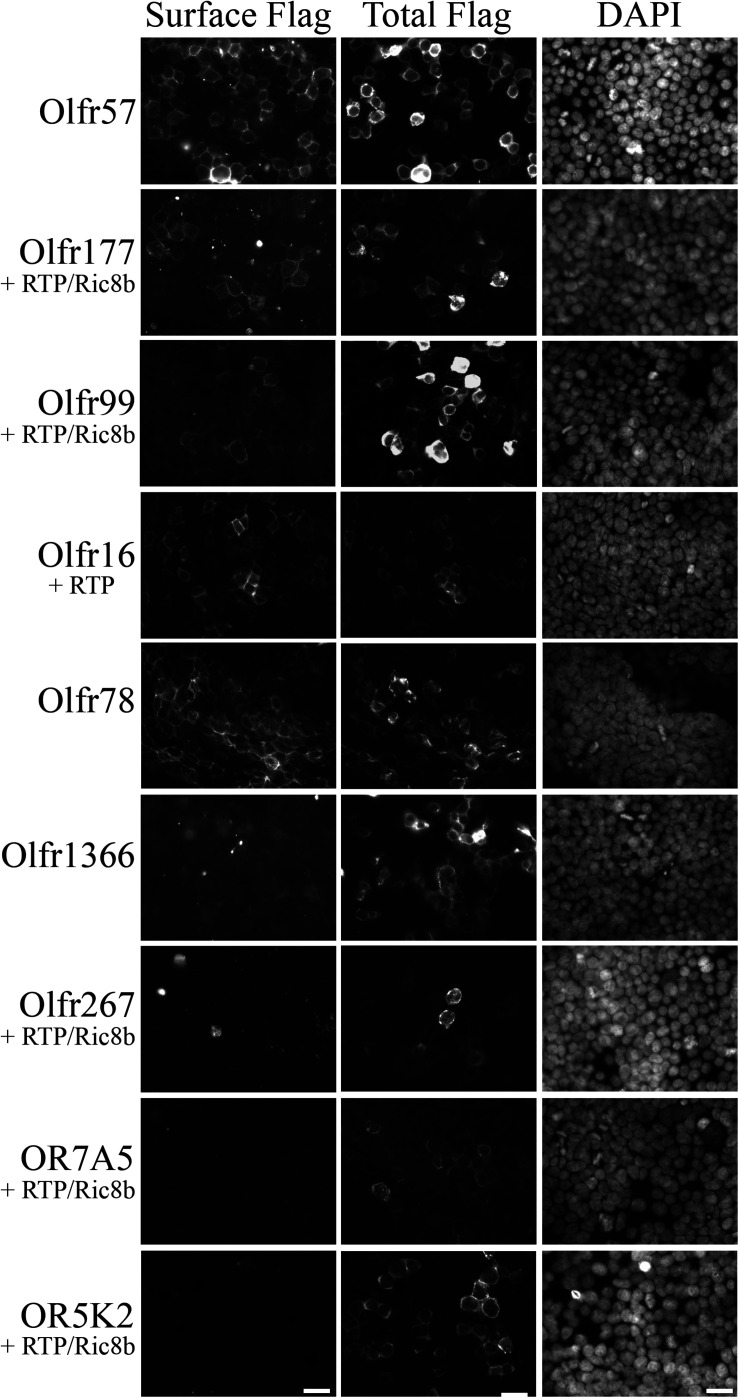
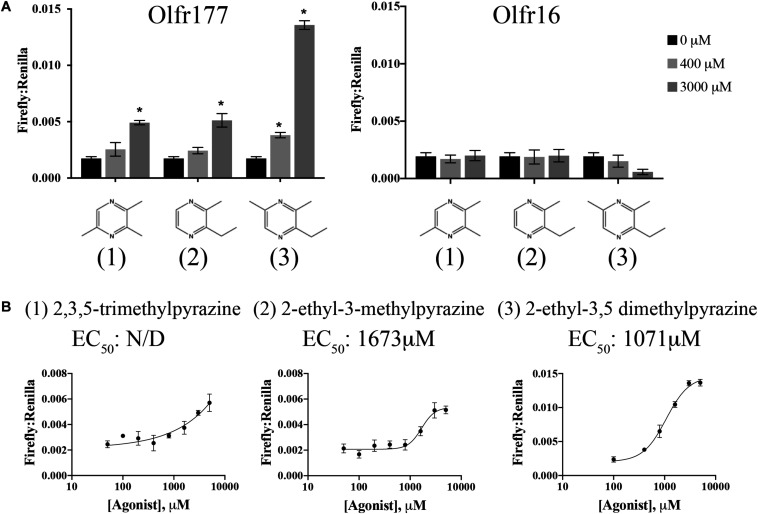
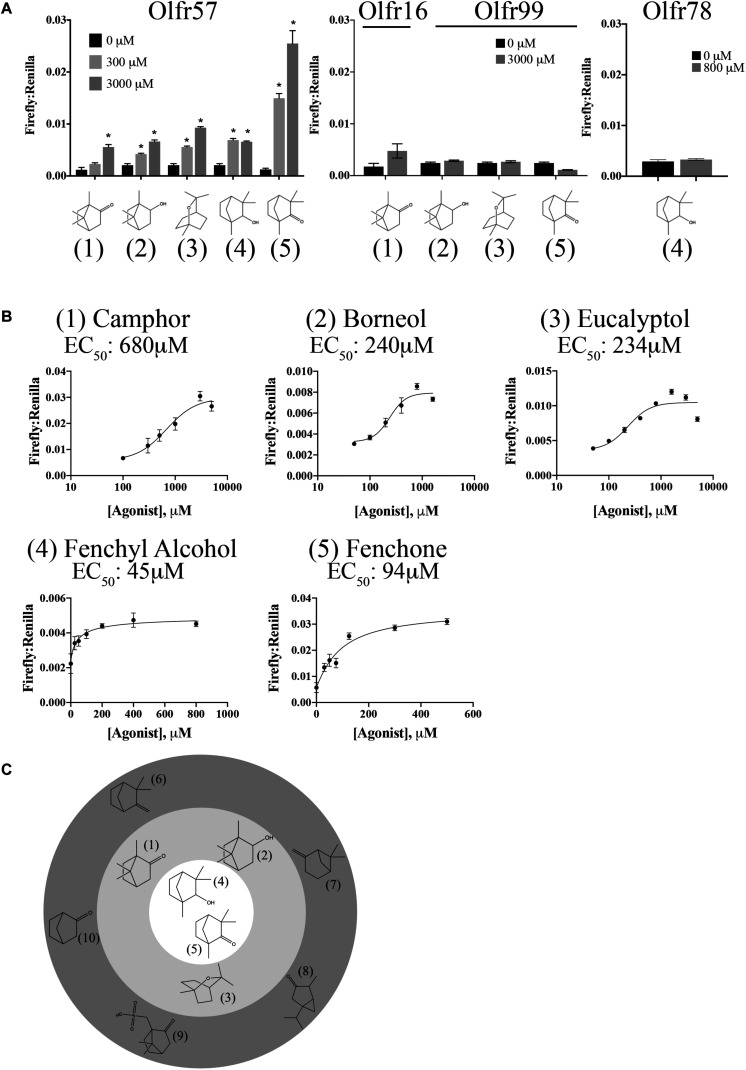
Sensory receptors, including olfactory receptors (ORs), taste receptors (TRs), and opsins (Opns) have recently been found in a variety of non-sensory tissues where they have distinct physiological functions. As G protein-coupled receptors (GPCRs), these proteins can serve as important chemosensors by sensing and interpreting chemical cues in the environment. We reasoned that the liver, the largest metabolic organ in the body, is primed to take advantage of some of these sensory receptors in order to sense and regulate blood content and metabolism. In this study, we report the expression of novel hepatic sensory receptors - including 7 ORs, 6 bitter TRs, and 1 Opn - identified through a systematic molecular biology screening approach. We further determined that several of these receptors are expressed within hepatocytes, the parenchymal cells of the liver. Finally, we uncovered several agonists of the previously orphaned hepatic ORs. These compounds fall under two classes: methylpyrazines and monoterpenes. In particular, the latter chemicals are plant and fungal-derived compounds with known hepatic protective effects. Collectively, this study sheds light on the chemosensory functions of the liver and unveils potentially important regulators of hepatic homeostasis.

Keywords: liver; olfactory receptors; pyrazine; taste receptors; terpene.


Figures

FIGURE 1
FIGURE 1
RT-PCR for full-length transcripts of olfactory receptors, taste receptors, and opsins confirm expression of sensory receptors in the liver. RT-PCR on both male and female liver cDNA was performed using full-length primers to confirm expression of (A) olfactory receptors, (B) taste receptors, and (C) opsins identified from the TaqMan array screen (Table 1) and confirmatory PCR (Supplementary Figure 1). Representative, cropped gel images are shown with arrows noting the sequenced product. The DNA ladder is shown to the left of each gel with the square symbol marking 1,000 bp and the circle at 500 bp. NT, no template control, – = mock RT reaction, += RT reaction.
FIGURE 2
FIGURE 2
Tas2r108, Tas2r135, and Tas2r143 are expressed in hepatocytes and a hepatocyte cell line. (A,B) RNAscope was performed using an anti-sense probe designed against Tas2r108. (A) Immunofluorescence (red) and RNAscope (green) was performed on HEK293T cells overexpressing Flag-Tas2r108. DAPI (blue) indicates nuclei. The probe specifically detected only those cells expressing the construct, confirming probe reliability. Scale bar = 20 μm. (B) RNAscope was performed on both male and female liver sections for Tas2r108 (red – top row) with fluorescent puncta indicating positive signal and seen only within hepatocytes. The corresponding negative and positive (RNAscope for HS-PPIB) controls are shown below. Scale bar = 20 μm. (C) RT-PCR for full-length taste receptors was performed in murine hepatic AML12 cells with Tas2r135 and Tas2r143 detected in the cell line. += RT reaction, – = mock RT reaction.
FIGURE 3
FIGURE 3
Olfactory receptors and downstream signaling machinery are localized within the liver. (A,B) RNAscope was performed using an anti-sense probe designed against Olfr57. (A) Immunofluorescence (left panel, red) and RNAscope (middle panel, green) was performed on HEK293T cells overexpressing Flag-Rho-Olfr57. DAPI (blue) indicates nuclei. The probe specifically detected only those cells expressing the construct confirming probe reliability. Scale bar = 20 μm. (B) RNAscope was performed on both male and female liver sections for Olfr57 (Cy5; red) with images taken at both 40 and 63×. DAPI staining to detect nuclei (blue) indicates that Olfr57 expression was mainly detected in hepatocytes, although some non-hepatic expression was also noted. Little to no fluorescent puncta were observed in the negative (neg) control and the positive control (HS-PPIB) shows a similar number of puncta. Arrow heads indicate areas of positive staining within hepatocytes. Scale bar = 20 μm. (C) RT-PCR on whole liver cDNA confirmed expression of Adcy3 that encodes for adenylyl cyclase 3 and GnaI that encodes for Gα olfactory, the two downstream signaling proteins of the olfactory receptor signaling cascade. += RT reaction, – = mock RT reaction.
FIGURE 4
FIGURE 4
Functional surface expression was achieved for 5 murine olfactory receptors. Hepatic olfactory receptors were cloned into a vector containing several N-terminal tags: Lucy and Rho to optimize surface expression and Flag for detection purposes. Receptors were transfected into HEK293T cells either alone or in combination with trafficking proteins RTP1s and/or Ric8b, and then live-surface labeled with a polyclonal Flag antibody to detect the protein expressed on the cell surface (Surface Flag). Cells were then fixed, permeabilized, and stained with a monoclonal Flag antibody to detect all transfected cells (Total Flag). DAPI was used to visualize nuclear staining. Scale bar = 20 μm.
FIGURE 5
FIGURE 5
Olfr177 is activated by methylpyrazines. (A) Olfr177 was expressed in HEK293T cells under conditions of maximal surface expression (Figure 4) along with two luciferase reporter constructs, Firefly and Renilla. Cells were incubated with the identified compounds to elicit an activated cAMP response indicated by an increase in the ratio of Firefly to Renilla. A representative activation graph is shown for 2 concentrations of compounds (400 and 3,000 μM) with *p > 0.05 deemed significant activation over baseline. To confirm specificity, the same ligands were screened against Olfr16 (right) with no responses detected. The numbers shown in (A) correspond to the chemical names listed in (B). (B) All three methylpyrazine agonists were tested at multiple concentrations to generate a dose-response curve and to calculate the EC50 values. Activation graphs are plotted as means ± SEM.
FIGURE 6
FIGURE 6
Olfr57 is activated by monoterpenes. (A) Olfr57 was expressed in HEK293T cells under conditions of maximal surface expression (Figure 4) along with two luciferase reporter constructs, Firefly and Renilla. Cells were incubated with the identified compounds to elicit an activated cAMP response indicated by an increase in the ratio of Firefly to Renilla. A representative activation graph is shown for 2 concentrations of compounds (300 and 3,000 μM) with *p > 0.05 deemed significant activation over baseline. To confirm specificity, the identified ligands were also screened against another OR (Olfr16, Olfr99, or Olfr78) at the highest dose. No responses were detected. The numbers shown in (A) correspond to the chemical names listed in (B). (B) All 5 monoterpene agonists were tested at multiple concentrations to generate a dose-response curve and to calculate the EC50 values. Activation graphs are plotted as means ± SEM. (C) The chemical structures of all activators and some notable ‘non-activators’ are shown relative to their potency. The inner circle indicates the best activators as determined by their EC50 values, while those compounds in the middle ring represent the remaining activators. Those compounds that are structurally similar but did not elicit a response are shown in the outermost ring. (Agonists: 1 – camphor; 2 – borneol; 3 – eucalyptol; 4 – fenchyl alcohol; 5 – fenchone. Notable non-activators: 6 – camphene; 7 – pinene; 8 – thujone; 9 – camphorsulfonic acid; 10 – norcamphor).

Similar articles

Cited by

References

    1. Abaffy T., Bain J. R., Muehlbauer M. J., Spasojevic I., Lodha S., Bruguera E., et al. (2018). A testosterone metabolite 19-hydroxyandrostenedione induces neuroendocrine trans-differentiation of prostate cancer cells via an ectopic olfactory receptor. Front. Oncol. 8:162 10.3389/fonc.2018.00162 - DOI - PMC - PubMed
    1. Abaffy T., Malhotra A., Luetje C. W. (2007). The molecular basis for ligand specificity in a mouse olfactory receptor: a network of functionally important residues. J. Biol. Chem. 282 1216–1224. 10.1074/jbc.m609355200 - DOI - PubMed
    1. Bell M., Wang H., Chen H., McLenithan J. C., Gong D. W., Yang R. Z., et al. (2008). Consequences of lipid droplet coat protein downregulation in liver cells: abnormal lipid droplet metabolism and induction of insulin resistance. Diabetes Metab. Res. Rev. 57 2037–2045. 10.2337/db07-1383 - DOI - PMC - PubMed
    1. Buck L., Axel R. (1991). A novel multigene family may encode odorant receptors: a molecular basis for odor recognition. Cell 65 175–187. 10.1016/0092-8674(91)90418-x - DOI - PubMed
    1. Buck L. B. (2005). Unraveling the sense of smell (Nobel lecture). Angew. Chem. Int. Ed Engl. 44 6128–6140. 10.1002/anie.200501120 - DOI - PubMed