. 2020 Oct 2:11:507199.
doi: 10.3389/fpsyg.2020.507199. eCollection 2020.

The Trajectory of Hemispheric Lateralization in the Core System of Face Processing: A Cross-Sectional Functional Magnetic Resonance Imaging Pilot Study

Affiliations

The Trajectory of Hemispheric Lateralization in the Core System of Face Processing: A Cross-Sectional Functional Magnetic Resonance Imaging Pilot Study

Franziska E Hildesheim et al. Front Psychol. .

Abstract

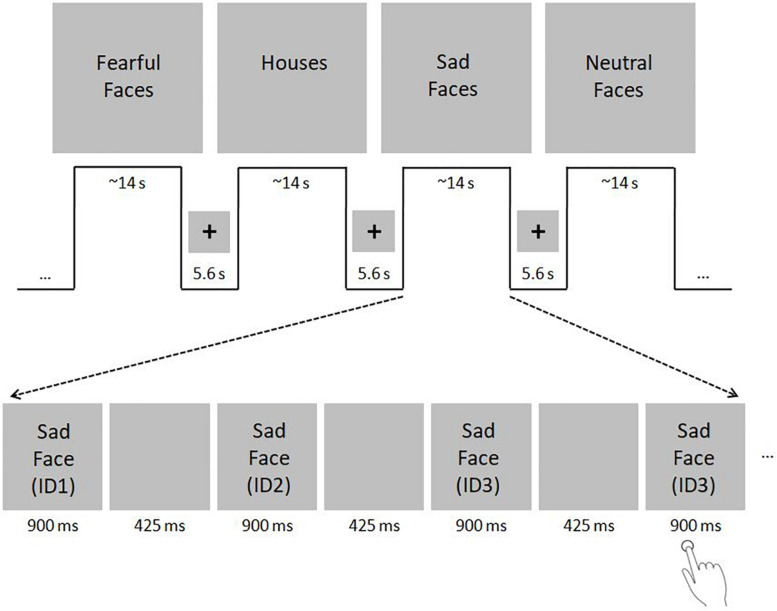
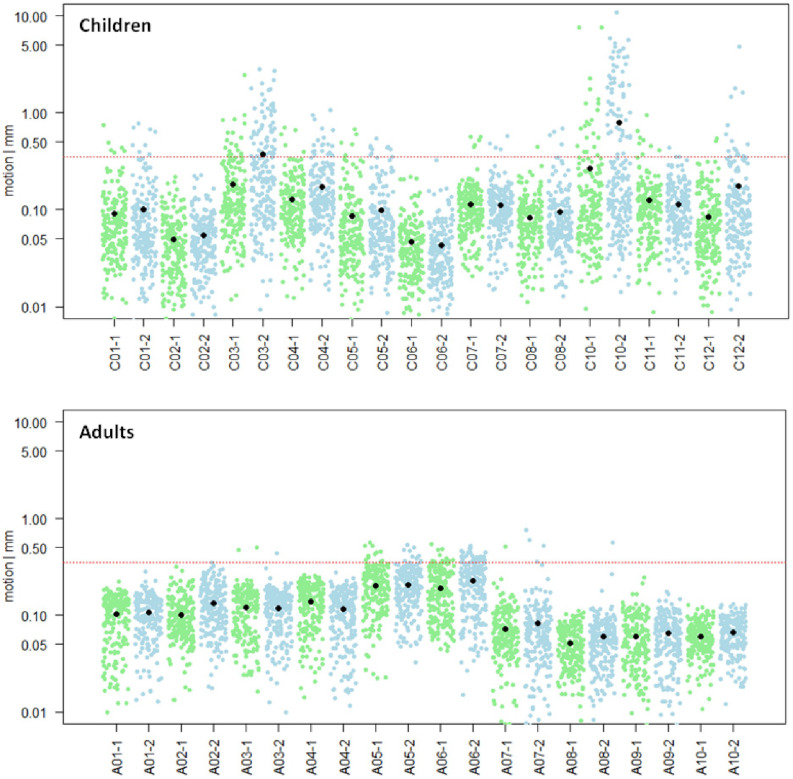
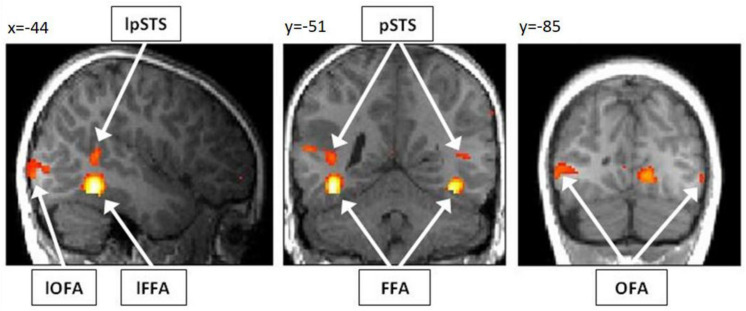
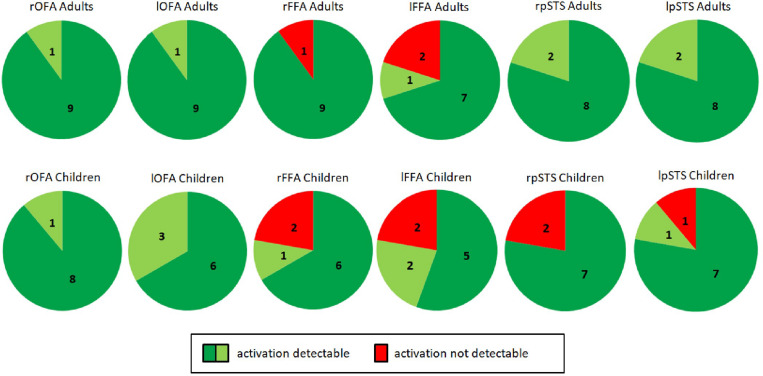
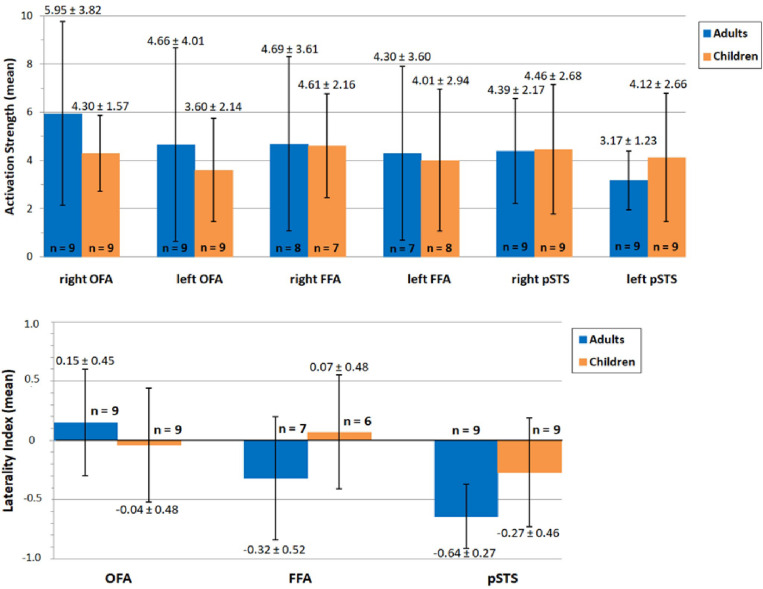
Face processing is mediated by a distributed neural network commonly divided into a "core system" and an "extended system." The core system consists of several, typically right-lateralized brain regions in the occipito-temporal cortex, including the occipital face area (OFA), the fusiform face area (FFA) and the posterior superior temporal sulcus (pSTS). It was recently proposed that the face processing network is initially bilateral and becomes right-specialized in the course of the development of reading abilities due to the competition between language-related regions in the left occipito-temporal cortex (e.g., the visual word form area, VWFA) and the FFA for common neural resources. In the present pilot study, we assessed the neural face processing network in 12 children (aged 7-9 years) and 10 adults with functional magnetic resonance imaging (fMRI). The hemispheric lateralization of the core face regions was compared between both groups. The study had two goals: First, we aimed to establish an fMRI paradigm suitable for assessing activation in the core system of face processing in young children at the single subject level. Second, we planned to collect data for a power analysis to calculate the necessary group size for a large-scale cross-sectional imaging study assessing the ontogenetic development of the lateralization of the face processing network, with focus on the FFA. It was possible to detect brain activity in the core system of 75% of children at the single subject level. The average scan-to-scan motion of the included children was comparable to adults, ruling out that potential activation differences between groups are caused by unequal motion artifacts. Hemispheric lateralization of the FFA was 0.07 ± 0.48 in children (indicating bilateral activation) and -0.32 ± 0.52 in adults (indicating right-hemispheric dominance). These results thus showed, as expected, a trend for increased lateralization in adults. The estimated effect size for the FFA lateralization difference was d = 0.78 (indicating medium to large effects). An adequately powered follow-up study (sensitivity 0.8) testing developmental changes of FFA lateralization would therefore require the inclusion of 18 children and 26 adults.

Keywords: children; face processing; fusiform face area; lateralization; magnetic resonance imaging; occipital face area; posterior superior temporal sulcus; visual word form area.


Figures

FIGURE 1
FIGURE 1
fMRI paradigm. Subjects viewed either gray-scale faces with neutral, sad or fearful faces in the activation condition and houses in the control condition in a blocked design. Face stimuli were selected from the Karolinska Directed Emotional Faces (KDEF) dataset (http://www.emotionlab.se/resources/kdef; permission for publication of KDEF stimuli was kindly provided by the Karolinska Institutet, Department of Neuroscience, Section of Psychology, Stockholm, Sweden; Lundqvist et al., 1998). House stimuli were selected from the internet. To ensure equalized size of face and house images, stimuli were resized to 500 × 400 pixel using ImageMagick for Linux. For purpose of color and luminance matching, stimuli were transferred into gray-scale images and adjusted for mean luminance using the SHINE toolbox for MATLAB (Willenbockel et al., 2010). The paradigm consisted of two sessions, including 16 blocks each (4 blocks with neutral, sad and fearful faces, respectively; 4 house blocks). The sessions were divided by a short break of 20 s. Each block included 11 stimuli that were presented for 900 ms with an inter-stimulus interval of 425 ms. Blocks lasted ∼14 s each and were separated with blank periods (duration: 5.6 s) in which only a centered fixation cross was shown. The order of blocks remained the same across all subjects, whereas the order of images in each block was pseudo-randomized. To ensure attention, subjects were asked to indicate via button press with the right index finger when a stimulus was shown twice consecutively. Within one block, either two or three stimulus-pairs arose, which sum up to 40 target events in the whole fMRI paradigm. The total duration of the fMRI paradigm was ∼11 min. The fMRI paradigm used in the present study was a slightly modified version of the standard paradigm used in our group (e.g., Frässle et al., 2016b) to adapt for the assessment of children. First, to minimize the total scanning time, the number of blocks was reduced from 44 to 32. Second, the stimulus presentation time was tripled to 900 ms. Third, the number of stimuli per block was reduced from 20 to 11. Fourth, the number of different face identities was reduced from 30 to 20 (10 female and 10 male identities). The number of different houses was also reduced from 30 to 20, to match it with the number of face stimuli.
FIGURE 2
FIGURE 2
Slab orientation covering bilateral OFA, FFA, and pSTS. The slab was oriented at the lowest part of the occipital pole and the lowest part of the prefrontal cortex (PFC), using the middle view of the structural image.
FIGURE 3
FIGURE 3
Motion analysis. Mean scan-to-scan motion of the child (n = 11, top) and the adult (n = 10, bottom) sample, separately for each subject and each session. The first session is depicted in green, the second session in blue. On the x-axis, the subject and session are specified; on the y-axis, the mean scan-to-scan motion is given in logarithmic representation to show normal distribution of data points. The red line marks the cut-off score of a mean scan-to-scan motion threshold of 0.35 mm. The black dots represent the mean scan-to-scan motion. Child C03 and Child C10 were excluded from further analyses due to motion exceeding the predefined session-specific mean scan-to-scan motion threshold of >0.35 mm in the second session.
FIGURE 4
FIGURE 4
Activation pattern of a representative child (7 years, male) for the contrast “faces > houses.” As overlay T1 image, the normalized and smoothed structural T1 scan of the respective child was used. The subject shows clearly discernible activity in bilateral OFA, FFA and pSTS. For illustrational purposes, the activation pattern is thresholded at p < 0.001, uncorrected for multiple comparisons. Note, however, that all six activations were significant for multiple comparisons (p < 0.05 FWE corrected) at the predefined ROI masks for bilateral OFA, FFA, and pSTS. OFA, occipital face area; FFA, fusiform face area; pSTS, posterior superior temporal sulcus; l, left.
FIGURE 5
FIGURE 5
Identification of bilateral OFA, FFA, and pSTS in adults (top, n = 10) and children (bottom, n = 9). Dark green indicates activity detectable at a statistical threshold of p < 0.05, FWE corrected for multiple comparisons at the whole brain level. Light green indicates activity detectable at a statistical threshold of p < 0.001/p < 0.05 uncorrected. Red indicates no detectable activity. In all adults, brain activity could be detected in the right and left OFA as well as in the right and left pSTS. Activity could not be detected in the right FFA for one subject (A02) and the left FFA for two subjects (A02, A07). This was caused by the positioning of the measured volume (see section “Discussion”). As for adults, in all children brain activity could be detected in the right and left OFA. Activity was not detected for two children in the right pSTS (C04, C06) and for one child in the left pSTS (C04). Activity was also not detected for two children in the right FFA (C07, C08) and for two children in the left FFA (C01, C08). Missing FFA activity was again caused by the positioning of the measured volume. OFA, occipital face area; FFA, fusiform face area; pSTS, posterior superior temporal sulcus; l, left; r, right.
FIGURE 6
FIGURE 6
Mean activation (top) and lateralization (bottom) of OFA, FFA and pSTS during face processing in adults (blue) and children (orange). Values of mean activation/lateralization ± SD are specified above/below error bars. The number of included subjects is depicted at the bottom of/above each bar. None of the differences reached statistical significance (p > 0.05). OFA, occipital face area; FFA, fusiform face area; pSTS, posterior superior temporal sulcus.

References

    1. Anderson S. F., Kelley K., Maxwell S. E. (2017). Sample-size planning for more accurate statistical power: a method adjusting sample effect sizes for publication bias and uncertainty. Psychol. Sci. 28 1547–1562. 10.1177/0956797617723724 - DOI - PubMed
    1. Aylward E. H., Park J. E., Field K. M., Parsons A. C., Richards T. L., Cramer S. C., et al. (2005). Brain activation during face perception: evidence of a developmental change. J. Cogn. Neurosci. 17 308–319. 10.1162/0898929053124884 - DOI - PubMed
    1. Baciu M. V., Watson J. M., Maccotta L., McDermott K. B., Buckner R. L., Gilliam F. G. (2005). Evaluating functional MRI procedures for assessing hemispheric language dominance in neurosurgical patients. Neuroradiology 47 835–844. 10.1007/s00234-005-1431-3 - DOI - PubMed
    1. Baron-Cohen S., Wheelwright S. (2004). The empathy quotient: an investigation of adults with asperger syndrome or high functioning autism, and normal sex differences. J. Autism. Dev. Disord. 34 163–175. 10.1023/b:jadd.0000022607.19833.00 - DOI - PubMed
    1. Baron-Cohen S., Wheelwright S., Skinner R., Martin J., Clubley E. (2001). The autism-spectrum quotient (AQ): evidence from asperger syndrome/high-functioning autism, males and females, scientists and mathematicians. J. Autism. Dev. Disord. 31 5–17. 10.1023/A:1005653411471 - DOI - PubMed

LinkOut - more resources