. 2020 Oct 6:11:575577.
doi: 10.3389/fimmu.2020.575577. eCollection 2020.

The Role of T Cells Reactive to the Cathelicidin Antimicrobial Peptide LL-37 in Acute Coronary Syndrome and Plaque Calcification

Affiliations

The Role of T Cells Reactive to the Cathelicidin Antimicrobial Peptide LL-37 in Acute Coronary Syndrome and Plaque Calcification

Fernando Chernomordik et al. Front Immunol. .

Abstract

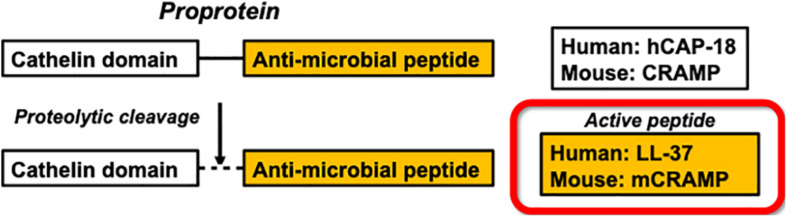
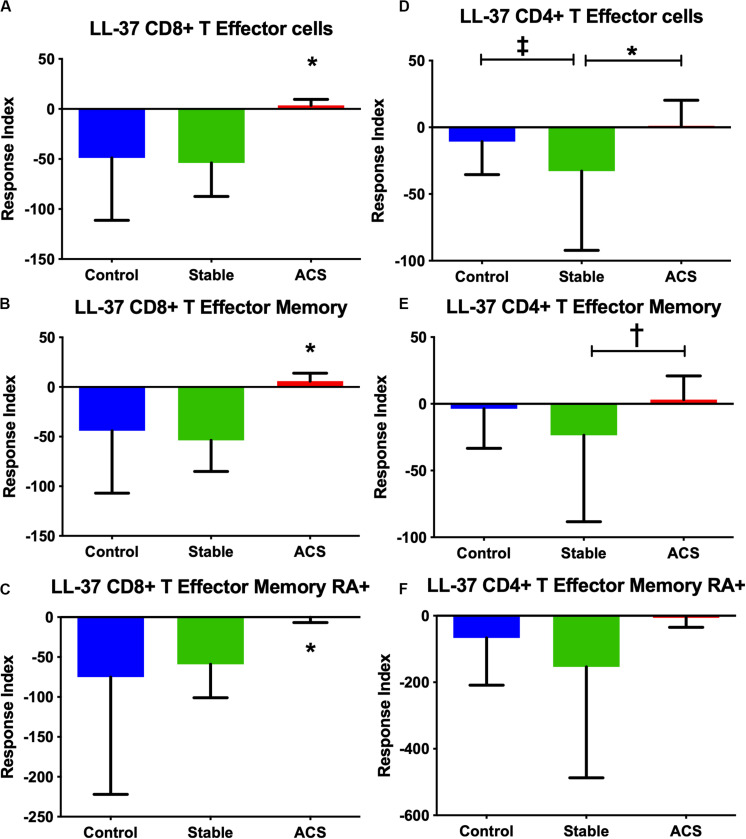
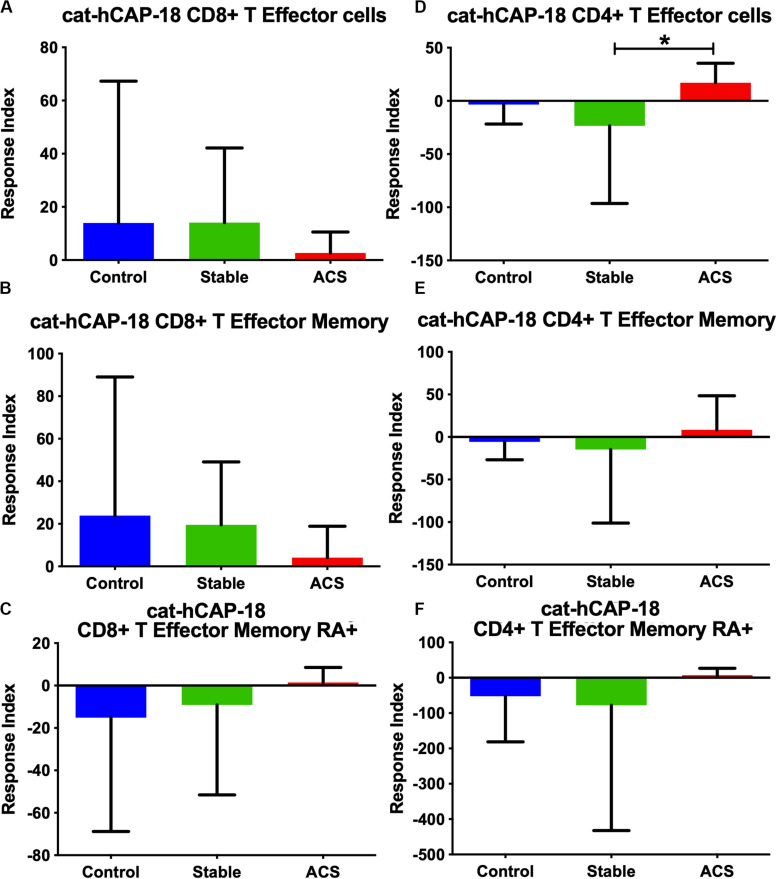
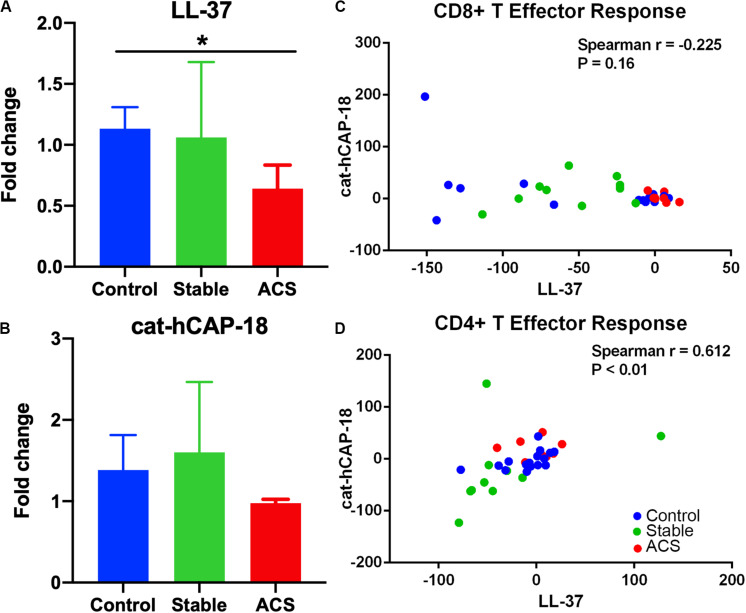
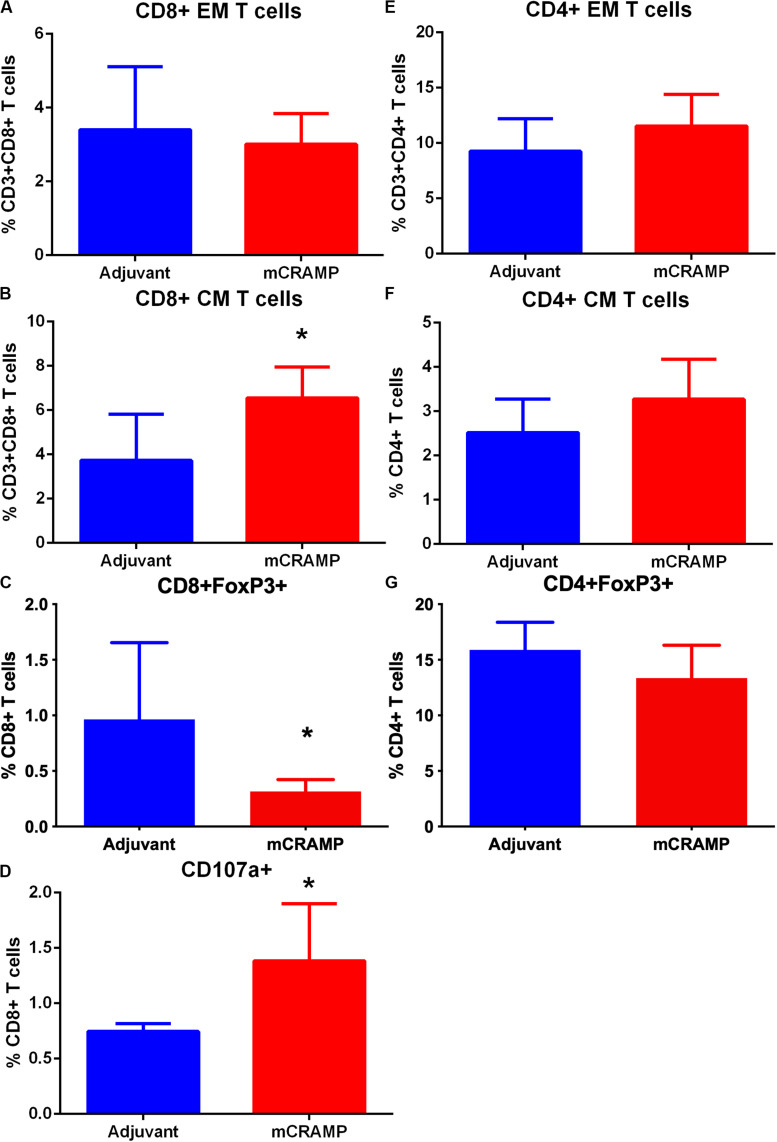
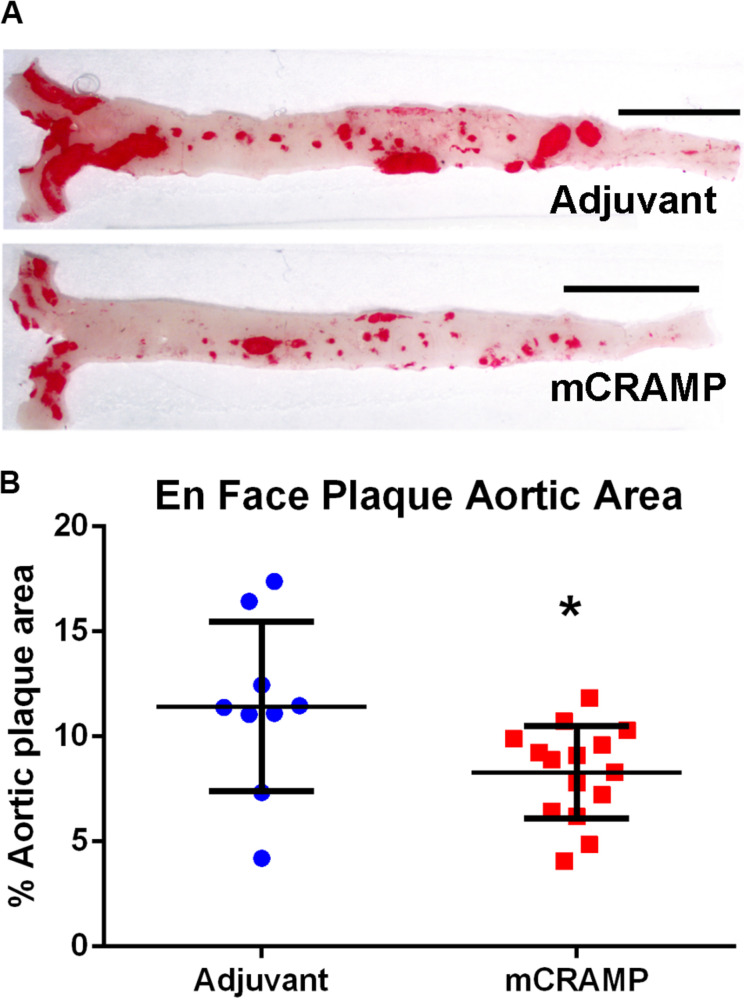
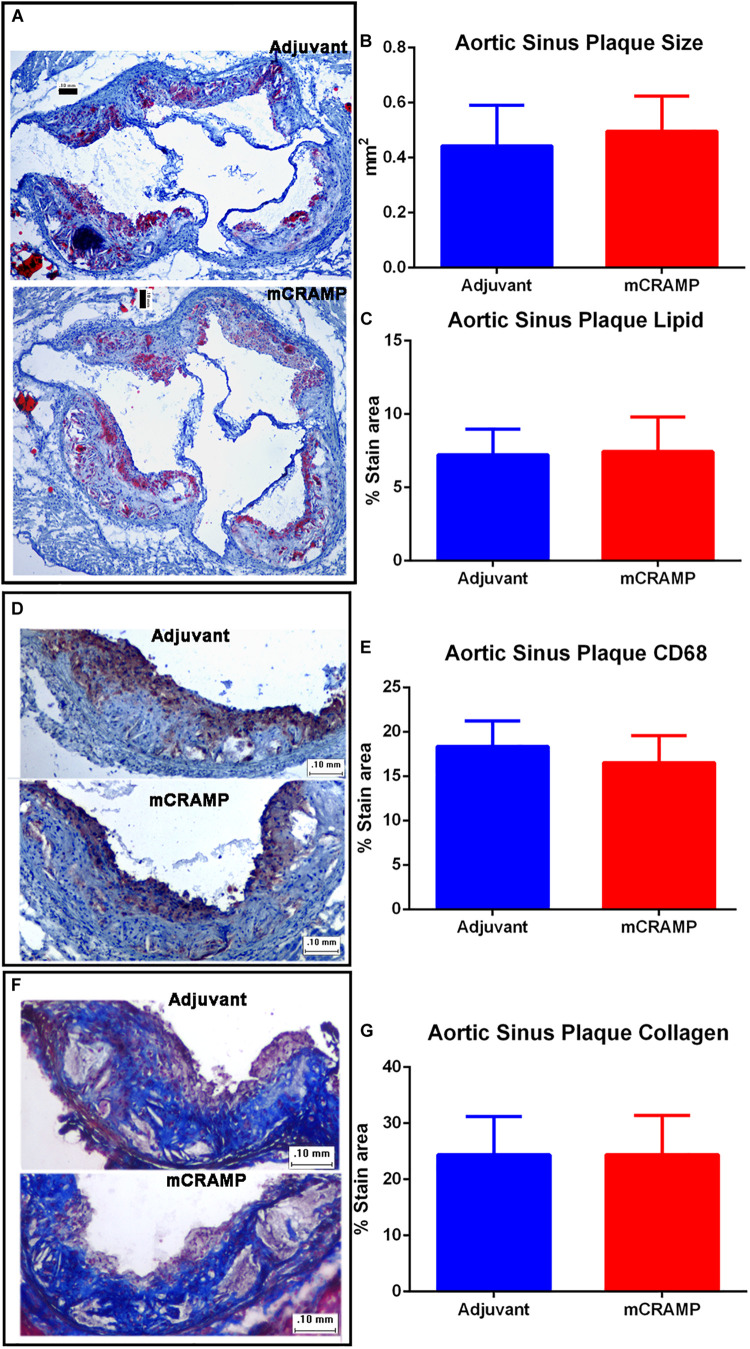
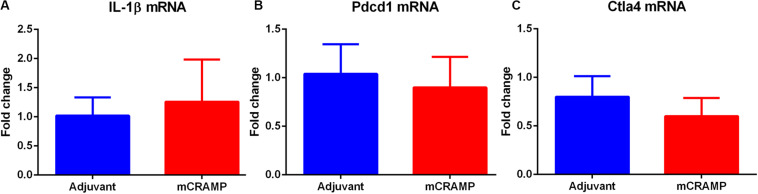
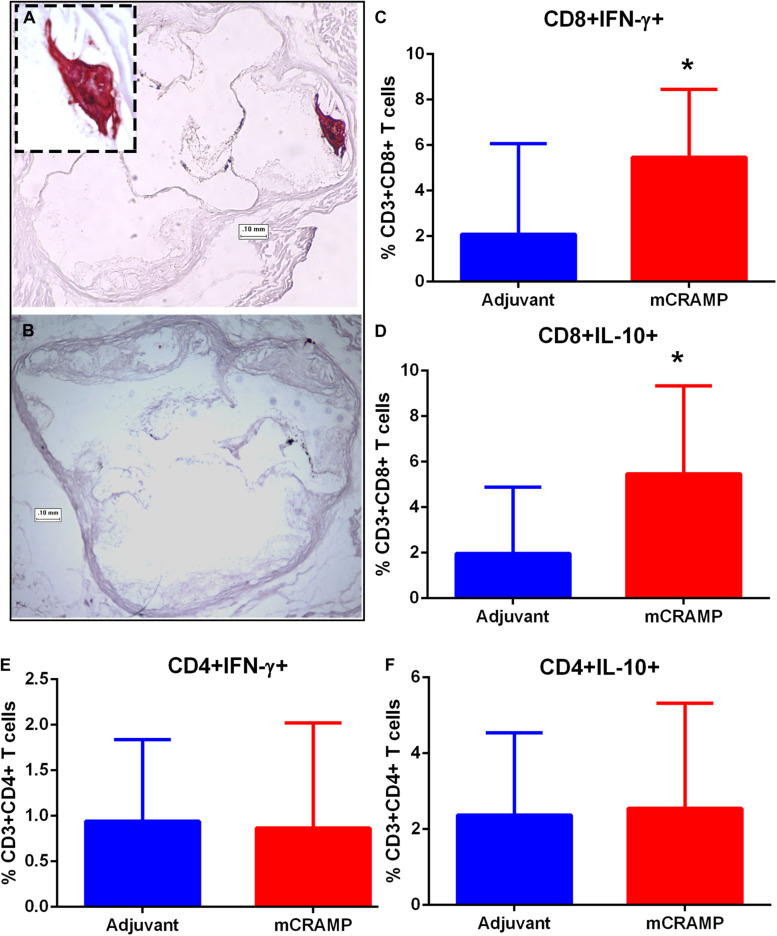
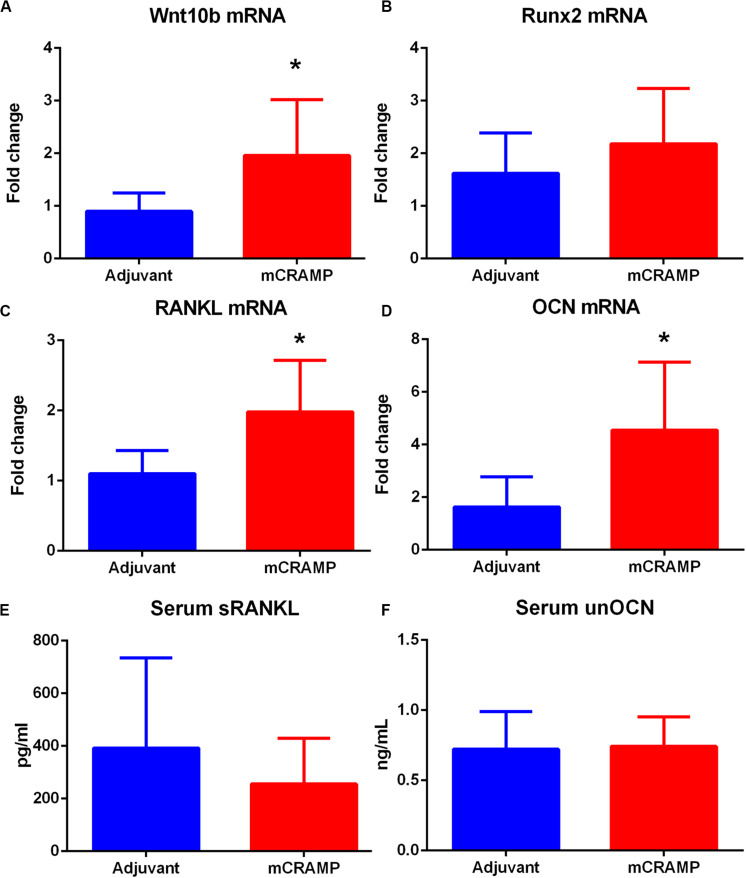
The human cationic anti-microbial peptide LL-37 is a T cell self-antigen in patients with psoriasis, who have increased risk of cardiovascular events. However, the role of LL-37 as a T cell self-antigen in the context of atherosclerosis remains unclear. The objective of this study was to test for the presence of T cells reactive to LL-37 in patients with acute coronary syndrome (ACS). Furthermore, the role of T cells reactive to LL-37 in atherosclerosis was assessed using apoE-/- mice immunized with the LL-37 mouse ortholog, mCRAMP. Peripheral blood mononuclear cells (PBMCs) from patients with ACS were stimulated with LL-37. PBMCs from stable coronary artery disease (CAD) patients or self-reported subjects served as controls. T cell memory responses were analyzed with flow cytometry. Stimulation of PBMCs with LL-37 reduced CD8+ effector T cell responses in controls and patients with stable CAD but not in ACS and was associated with reduced programmed cell death protein 1 (PDCD1) mRNA expression. For the mouse studies, donor apoE-/- mice were immunized with mCRAMP or adjuvant as controls, then T cells were isolated and adoptively transferred into recipient apoE-/- mice fed a Western diet. Recipient mice were euthanized after 5 weeks. Whole aortas and hearts were collected for analysis of atherosclerotic plaques. Spleens were collected for flow cytometric and mRNA expression analysis. Adoptive transfer experiments in apoE-/- mice showed a 28% reduction in aortic plaque area in mCRAMP T cell recipient mice (P < 0.05). Fifty six percent of adjuvant T cell recipient mice showed calcification in atherosclerotic plaques, compared to none in the mCRAMP T cell recipient mice (Fisher's exact test P = 0.003). Recipients of T cells from mice immunized with mCRAMP had increased IL-10 and IFN-γ expression in CD8+ T cells compared to controls. In conclusion, the persistence of CD8+ effector T cell response in PBMCs from patients with ACS stimulated with LL-37 suggests that LL-37-reactive T cells may be involved in the acute event. Furthermore, studies in apoE-/- mice suggest that T cells reactive to mCRAMP are functionally active in atherosclerosis and may be involved in modulating plaque calcification.

Keywords: LL-37; T cells; acute coronary syndrome; atherosclerosis; cathelicidin; mCRAMP.


Figures

FIGURE 1
FIGURE 1
Enzymatic processing of the human antimicrobial peptide LL-37 and the mouse ortholog mCRAMP.
FIGURE 2
FIGURE 2
PBMC T Effector cell response to stimulation with the human antimicrobial peptide LL-37. CD8+ (A–C) and CD4+ (D–F) Memory T cell responses to stimulation of peripheral blood mononuclear cells from self-reported controls (Control), stable coronary artery disease (Stable), and acute coronary syndrome (ACS) patients. T Effector Memory (B,E) and T Effector Memory RA+ (C,F) were based on CD45RO/CD45RA flow cytometric stain as detailed in the gating scheme described in Supplementary Figure 1. Control N = 15; Stable N = 10; ACS N = 10. *P < 0.05 ACS vs Control or Stable CAD (A–C) and Stable vs ACS (D); P = 0.053 Control vs Stable; P = 0.055 Stable vs ACS. Kruskal-Wallis and Dunn’s multiple comparisons test.
FIGURE 3
FIGURE 3
PBMC T Effector cell response to stimulation with the cathelin domain of the human proprotein hCAP-18, cat-hCAP-18. CD8+ (A–C) and CD4+ (D–F) Memory T cell responses to stimulation of peripheral blood mononuclear cells from self-reported controls (Control), stable coronary artery disease (Stable), and acute coronary syndrome patients (ACS). T Effector Memory (B,E) and T Effector Memory RA+ (C,F) were based on CD45RO/CD45RA flow cytometric stain as detailed in the gating scheme described in Supplementary Figure 1. Control N = 15; Stable CAD N = 10; ACS N = 9; *P < 0.05 Stable vs ACS. Kruskal-Wallis and Dunn’s multiple comparisons test.
FIGURE 4
FIGURE 4
Immune checkpoint PDCD1 mRNA expression and correlation in T Effector response to LL-37 and cat-hCAP-18. Programmed cell death protein 1 (PDCD1) mRNA expression in peripheral blood mononuclear cells stimulated with the human antimicrobial peptide LL-37 (A) or the cathelin domain of the proprotein hCAP-18, cat-hCAP-18 (B). Control N = 6; Stable = 5; ACS = 5. *P < 0.05 (ACS vs Control; Kruskal-Wallis and Dunn’s multiple comparisons test). Correlation plot between CD8+ T Effector response to LL-37 and cat-hCAP-18 (C). Correlation plot between CD4+ T Effector response to LL-37 and cat-hCAP-18 (D).
FIGURE 5
FIGURE 5
Memory T cell response of splenocytes to immunization of apoE–/– mice with the murine antimicrobial peptide mCRAMP. CD8+ Effector Memory (EM) T cells (A), Central Memory (CM) T cells (B), CD8+FoxP3+ T cells (C) and CD8+CD107a+ T cells (D) in mice immunized with mCRAMP compared to adjuvant. N = 5 each. CD4+EM T cells (E), CD4+ CM T cells (F), and CD4+FoxP3+ T cells (G) in mice immunized with mCRAMP compared to Adjuvant. N = 5 each; *P < 0.05, t-test. Gating scheme for memory T cells and FoxP3+ T cells shown in Supplementary Figure 6. Gating scheme for CD8+CD107a+ T cells shown in Supplementary Figure 7.
FIGURE 6
FIGURE 6
Aortic atherosclerosis plaque burden in T cell recipient apoE–/– mice. Representative photographs of en face aortas stained with Oil red O (A) from T cell recipients of adjuvant and mCRAMP immunized mice. Bar = 0.5 cm. Atherosclerotic burden was assessed by measuring Oil Red O stained plaque area (B). Adjuvant N = 9; mCRAMP N = 15; *P < 0.05, t-test.
FIGURE 7
FIGURE 7
Aortic sinus plaque composition in T cell recipient apoE–/– mice. Representative photos of Oil Red O stain for lipids (A). Aortic sinus plaque size (B; Adjuvant N = 9, mCRAMP N = 12) and lipid area (C; Oil Red O staining; Adjuvant N = 9; mCRAMP N = 12). Representative photos of CD68 stain for macrophage (D) and macrophage area (E; N = 6 each). Representative photos of Masson’s trichrome stain (F) and collagen stain area (G; Adjuvant N = 9; mCRAMP N = 15). Bar = 0.1 mm.
FIGURE 8
FIGURE 8
Analysis of key immune regulatory pathways in T cell recipient mice. Splenic mRNA expression of IL-1β (A), Pdcd1 (B) or Ctla4 (C) between mCRAMP or adjuvant T cell recipient mice. N = 5 each.
FIGURE 9
FIGURE 9
Atherosclerotic plaque calcification in T cell recipient mice. Representative photographs of aortic sinuses stained with the calcium specific Alizarin Red S in adjuvant (A, inset 20× magnification) or mCRAMP (B) T cell recipient mice. Bar = 0.1 mm. Intracellular staining for splenic CD8+INF-γ+ T cells (C) and CD8+IL-10+ T cells (D). Intracellular staining for splenic CD4+INF-γ+ T cells (E) and CD4+IL-10+ T cells (F). Adjuvant N = 8; mCRAMP N = 14. *P < 0.05, Mann-Whitney test. Gating scheme for T cell intracellular staining shown in Supplementary Figure 8.
FIGURE 10
FIGURE 10
Pathways of tissue calcification potentially mediated by T cells. (A) Splenic Wnt10b mRNA expression in mCRAMP compared to adjuvant T cell recipient mice at 23 weeks of age (A; N = 7 each group). Splenic Runx2 mRNA (B; N = 5 each group), RANKL mRNA (C), and osteocalcin (OCN) mRNA (D) expression in mCRAMP T cell recipient mice compared to adjuvant T cell recipients (N = 5–7 each). Serum RANKL (E; Adjuvant N = 9; mCRAMP N = 14) and serum undercarboxylated osteocalcin (unOCN) levels (F; Adjuvant N = 9; mCRAMP N = 14). *P < 0.05; (A,C), t-test; (D), Mann-Whitney test.

References

    1. Hansson GK, Libby P, Schönbeck U, Yan Z-Q. Innate and adaptive immunity in the pathogenesis of atherosclerosis. Circ Res. (2002) 91:281–91. 10.1161/01.res.0000029784.15893.10 - DOI - PubMed
    1. Milioti N, Bermudez-Fajardo A, Penichet ML, Oviedo-Orta E. Antigen-Induced Immunomodulation in the pathogenesis of atherosclerosis. Clin Dev Immunol. (2008) 2008:1–15. 10.1155/2008/723539 - DOI - PMC - PubMed
    1. Saigusa R, Winkels H, Ley K. T cell subsets and functions in atherosclerosis. Nat Rev Cardiol. (2020) 17:387–401. 10.1038/s41569-020-0352-5 - DOI - PMC - PubMed
    1. Nilsson J, Hansson GK. Autoimmunity in atherosclerosis: a protective response losing control? J Intern Med. (2008) 263:464–78. 10.1111/j.1365-2796.2008.01945.x - DOI - PubMed
    1. Ammirati E, Cianflone D, Vecchio V, Banfi M, Vermi AC, De Metrio M, et al. Effector memory T cells are associated with atherosclerosis in humans and animal models. J Am Heart Assoc. (2012) 1:27–41. 10.1161/xjaha.111.000125 - DOI - PMC - PubMed

Publication types

MeSH terms