. 2020 Oct 2;13(5):889-896.
doi: 10.1093/ckj/sfaa192. eCollection 2020 Oct.

Temporal changes in complement activation in haemodialysis patients with COVID-19 as a predictor of disease progression

Affiliations

Temporal changes in complement activation in haemodialysis patients with COVID-19 as a predictor of disease progression

Maria Prendecki et al. Clin Kidney J. .

Abstract

Background: Complement activation may play a pathogenic role in patients with severe coronavirus disease 2019 (COVID-19) by contributing to tissue inflammation and microvascular thrombosis.

Methods: Serial samples were collected from patients receiving maintenance haemodialysis (HD). Thirty-nine patients had confirmed COVID-19 and 10 patients had no evidence of COVID-19. Plasma C5a and C3a levels were measured using enzyme-linked immunosorbent assay.

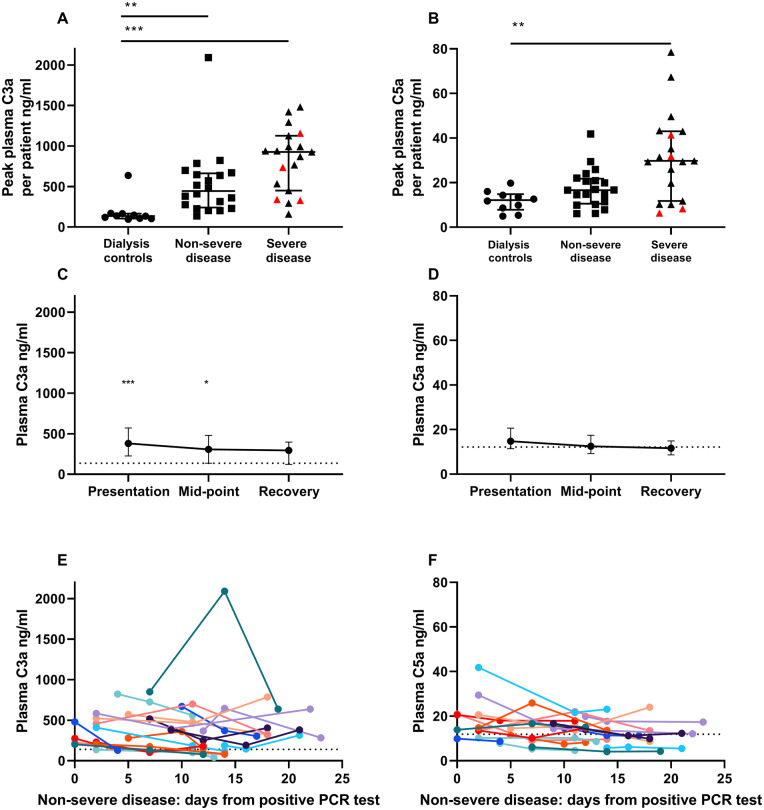
Results: We identified elevated levels of plasma C3a and C5a in HD patients with severe COVID-19 compared with controls. Serial sampling identified that C5a levels were elevated prior to clinical deterioration in patients who developed severe disease. C3a more closely mirrored both clinical and biochemical disease severity.

Conclusions: Our findings suggest that activation of complement plays a role in the pathogenesis of COVID-19, leading to endothelial injury and lung damage. C5a may be an earlier biomarker of disease severity than conventional parameters such as C-reactive protein and this warrants further investigation in dedicated biomarker studies. Our data support the testing of complement inhibition as a therapeutic strategy for patients with severe COVID-19.

Keywords: COVID-19; complement; haemodialysis.


Figures

FIGURE 1:
FIGURE 1:
Plasma levels of C3a and C5a are elevated in HD patients with severe COVID-19. Peak plasma (A) C3a and (B) C5a levels per patient with either non-severe or severe COVID-19. Patients who died are indicated in red. The horizontal bar denotes the median and whiskers denote the interquartile range. ***P < 0.001, **P < 0.01 derived from Kruskal–Wallis test with Dunn’s post hoc correction. Serial measurements of (C) C3a and (D) C5a for each patient with non-severe disease grouped at presentation, mid-point of illness and recovery. The dotted line represents the median value of dialysis controls. The horizontal bar denotes the median and whiskers denote the interquartile range. ***P < 0.001, *P < 0.05 derived from Mann–Whitney test. Serial measurements of (E) C3a and (F) C5a for each patient with non-severe disease (n = 20). The timing of the samples is denoted by days from the positive PCR test. The dotted line represents the median value in dialysis controls.
FIGURE 2:
FIGURE 2:
Plasma C5a but not C3a is elevated prior to clinical deterioration in HD patients with severe COVID-19. Serial measurements of (A) C3a and (B) C5a for each patient with severe disease (n = 20). The timing of the samples is denoted by clinical course and consists of the pre-deterioration phase (n = 5), severe phase (number as indicated) and recovery phase (n = 15). The dotted line represents the median value in dialysis controls. The horizontal bar denotes the median and whiskers denote the interquartile range. *P < 0.05, **P < 0.01, ***P < 0.001 derived from Mann–Whitney test. Serial measurements of (C) C3aand (D) C5ain patients with severe disease for whom a sample were available early (≤2 days) in their disease course. This represents 15 of the 19 patients with severe disease. The dotted lines represent the median value in dialysis controls.
FIGURE 3:
FIGURE 3:
Correlation between C5a, C3a, lymphocyte count and CRP. Correlation between (A) C5a and CRP, (B) C3a and CRP, (C) C5a and lymphocyte count, (D) C3a and lymphocyte count and (E) C5a and C3a. Statistical analysis was performed using repeated measures correlation, as the data included multiple samples from the same patient.
FIGURE 4:
FIGURE 4:
Temporal relationship between C5a, C3a and CRP in patients with samples available prior to developing severe disease. Serial C3a, C5a and CRP measurements for the five patients with samples available prior to developing severe COVID-19. Each panel (AE) of three graphs represents an individual patient.
FIGURE 5:
FIGURE 5:
Conceptual diagram of the putative temporal relationship between C5a, C3a, CRP (and other markers of disease severity) and clinical COVID-19.

References

    1. World Health Organization. Clinical management of COVID-19. https://www.who.int/publications/i/item/clinical-management-of-covid-19 (8 september 2020, date last accessed)
    1. Zhou F, Yu T, Du R. et al. Clinical course and risk factors for mortality of adult inpatients with COVID-19 in Wuhan, China: a retrospective cohort study. Lancet 2020; 395: 1054–1062 - PMC - PubMed
    1. Cugno M, Meroni PL, Gualtierotti R. et al. Complement activation in patients with COVID-19: a novel therapeutic target. J Allergy Clin Immunol 2020; 146: 215–217 - PMC - PubMed
    1. Carvelli J, Demaria O, Vély F. et al. Association of COVID-19 inflammation with activation of the C5a–C5aR1 axis. Nature 2020; doi: 10.1038/s41586-020-2600-6 - PMC - PubMed
    1. Magro C, Mulvey JJ, Berlin D. et al. Complement associated microvascular injury and thrombosis in the pathogenesis of severe COVID-19 infection: a report of five cases. Transl Res 2020; 220: 1–13 - PMC - PubMed