. 2020 Mar;125(3):e2019JE006011.
doi: 10.1029/2019je006011. Epub 2020 Feb 21.

Olivine-Carbonate Mineralogy of the Jezero Crater Region

Affiliations

Olivine-Carbonate Mineralogy of the Jezero Crater Region

A J Brown et al. J Geophys Res Planets. 2020 Mar.

Abstract

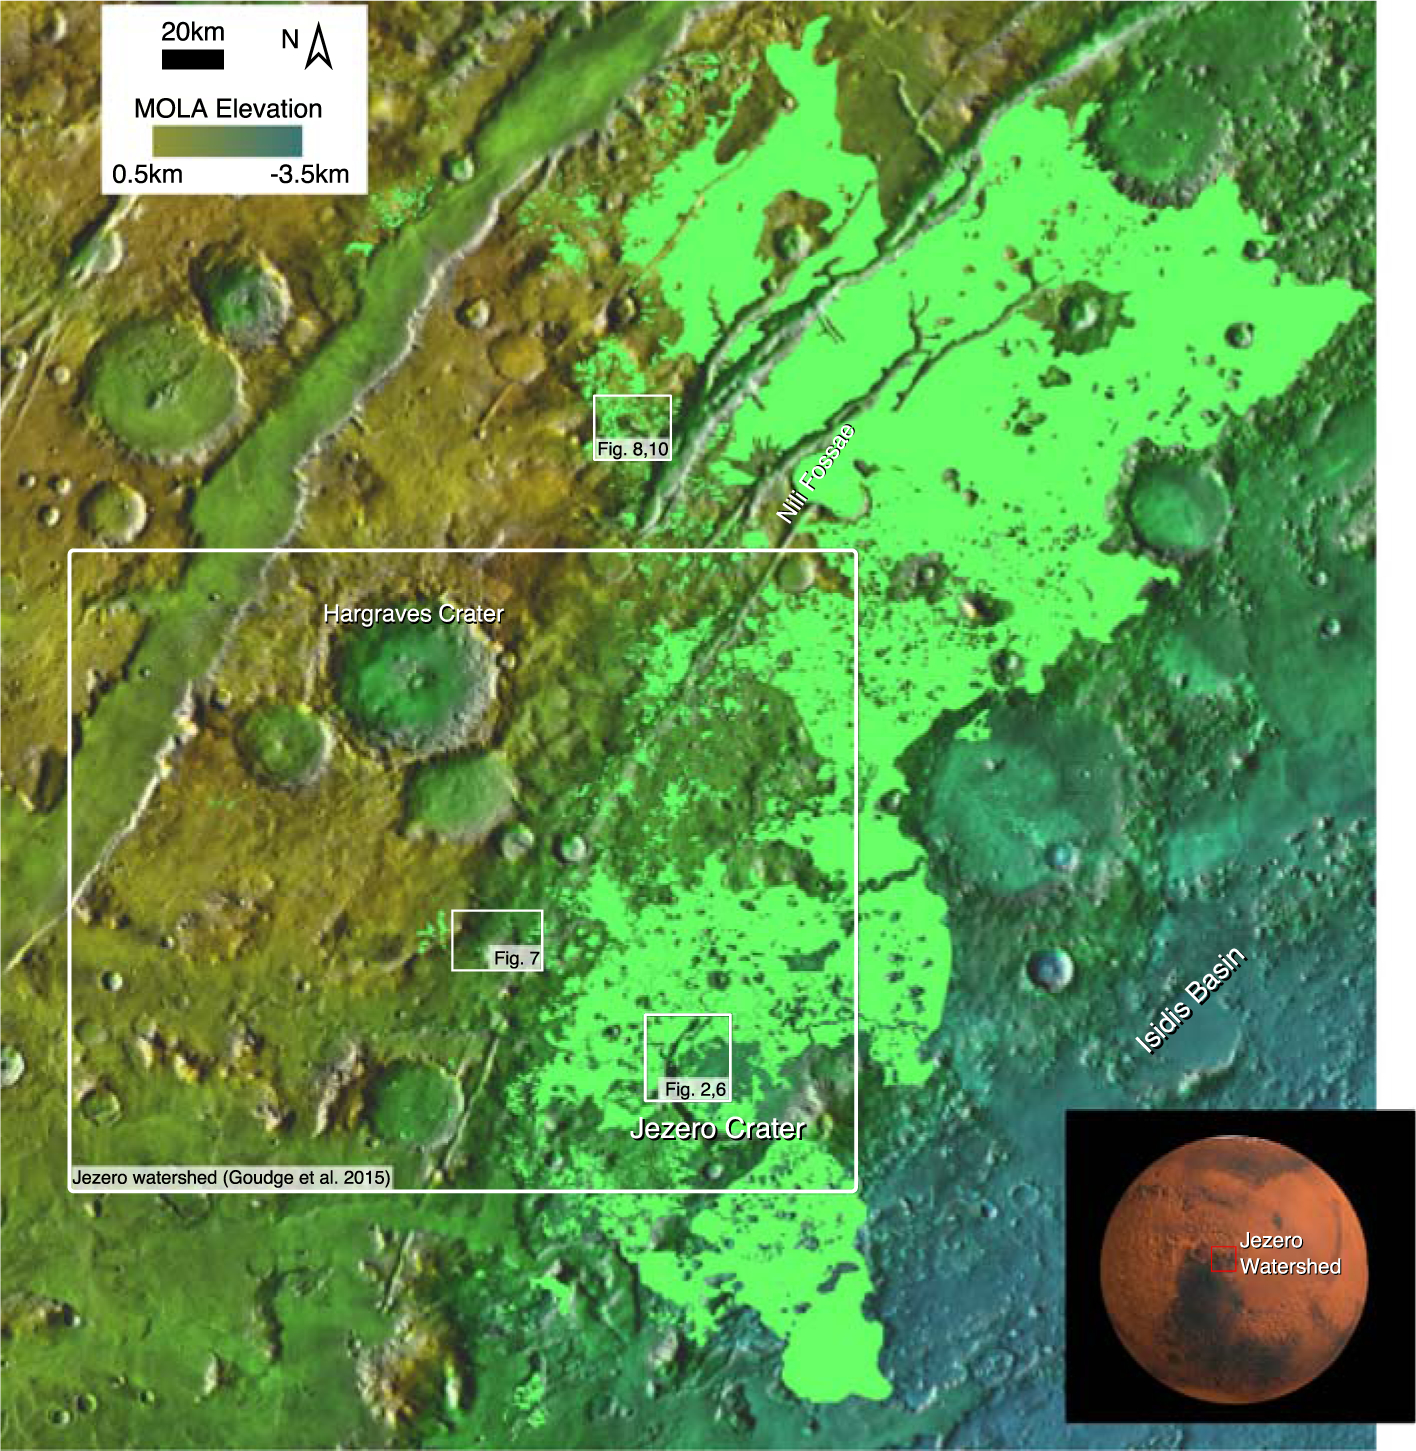
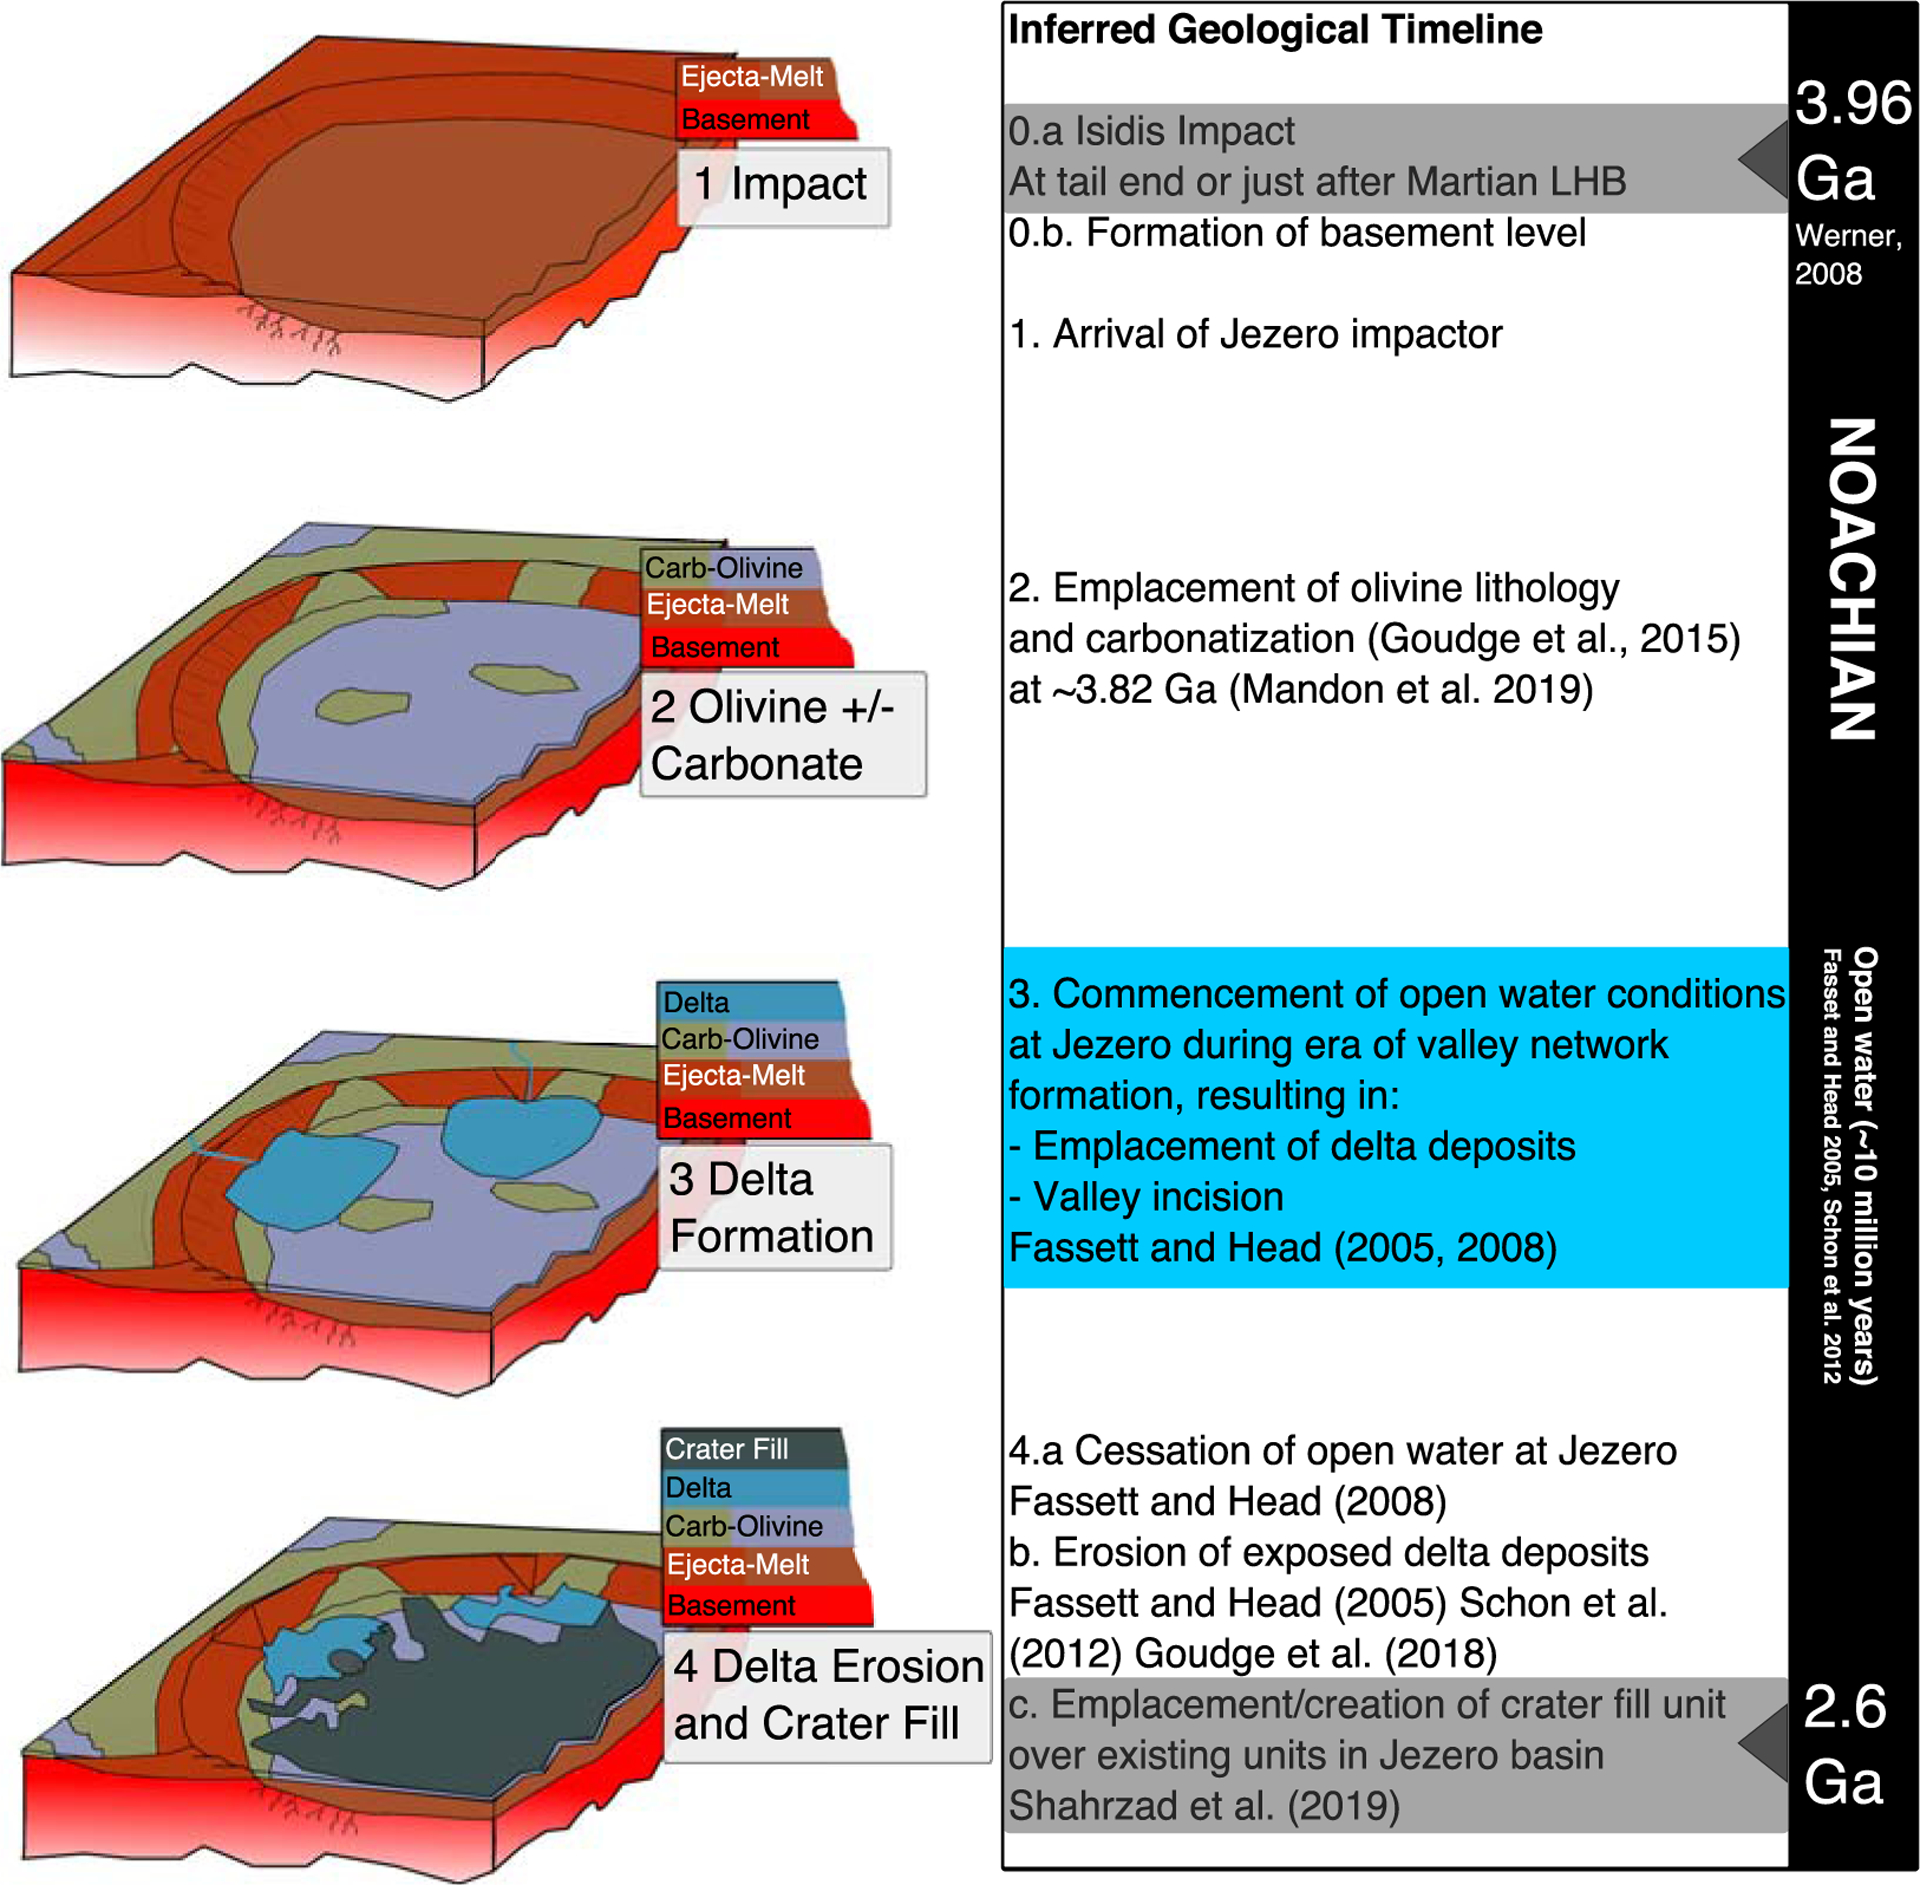
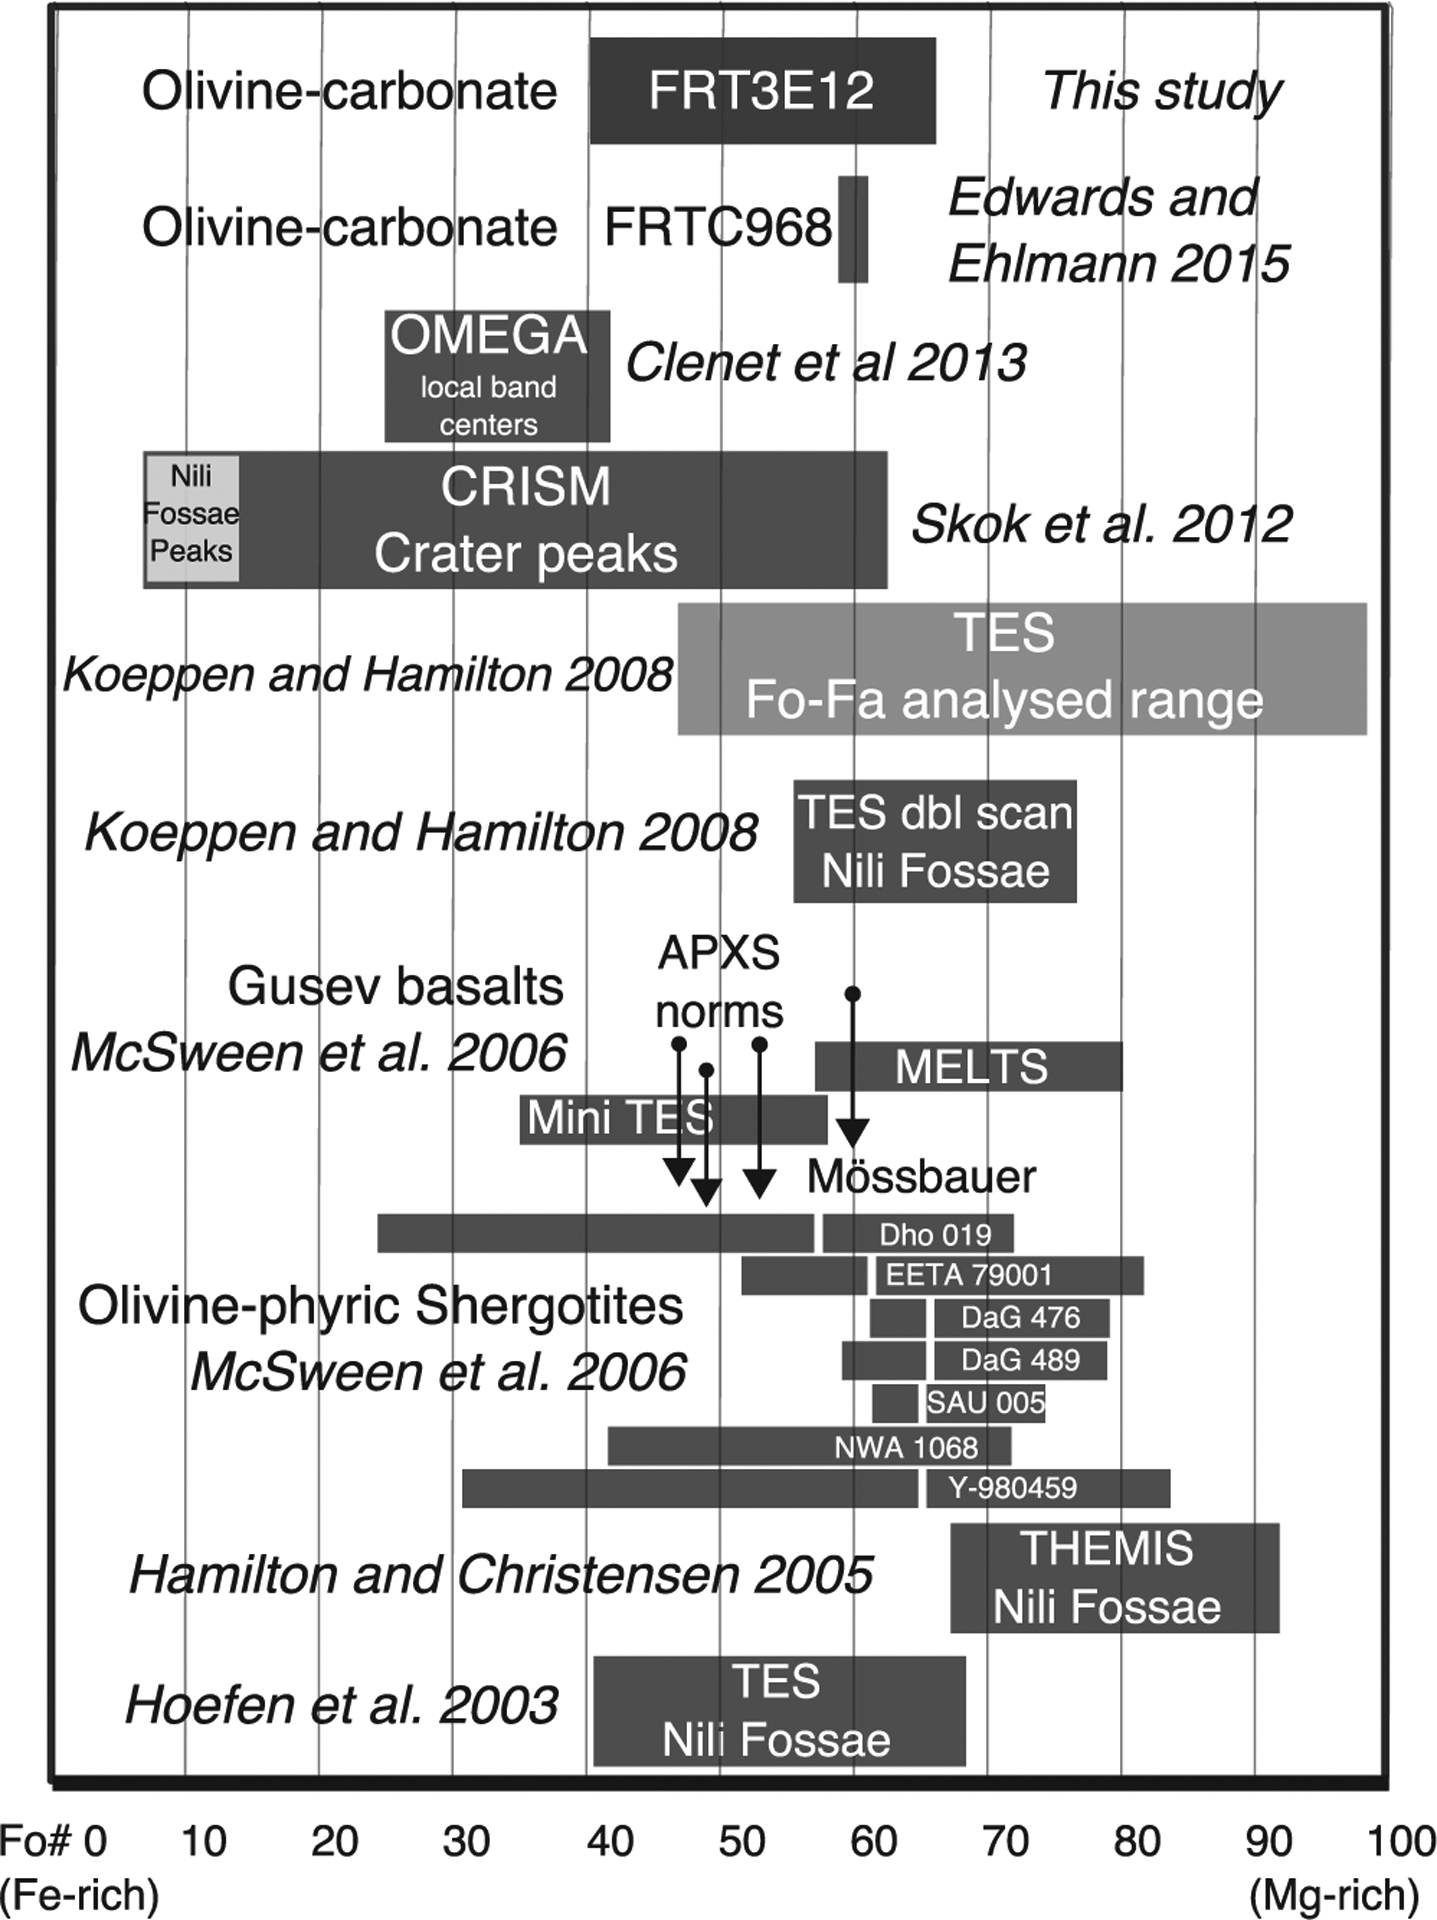
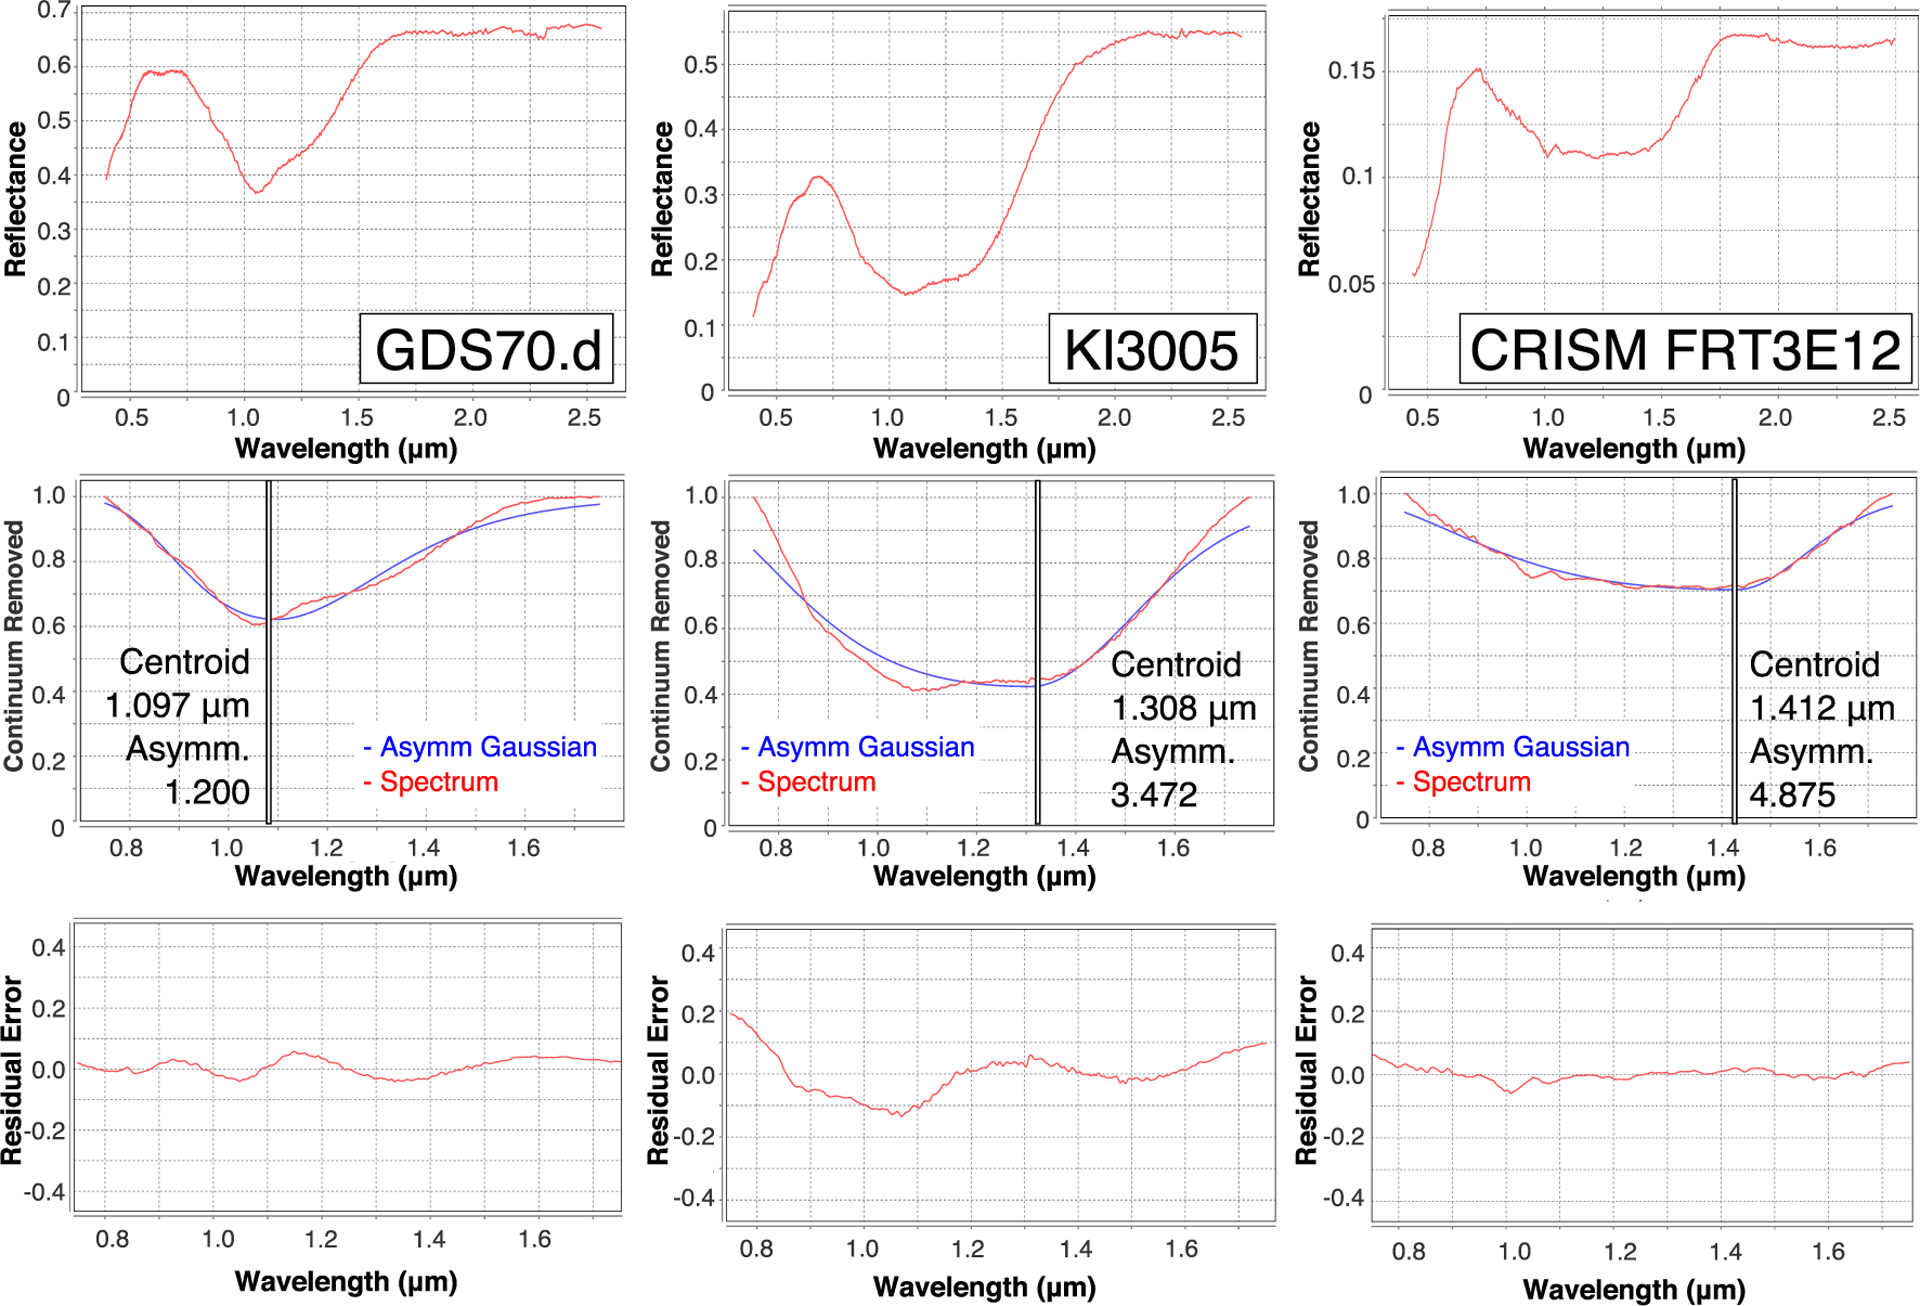
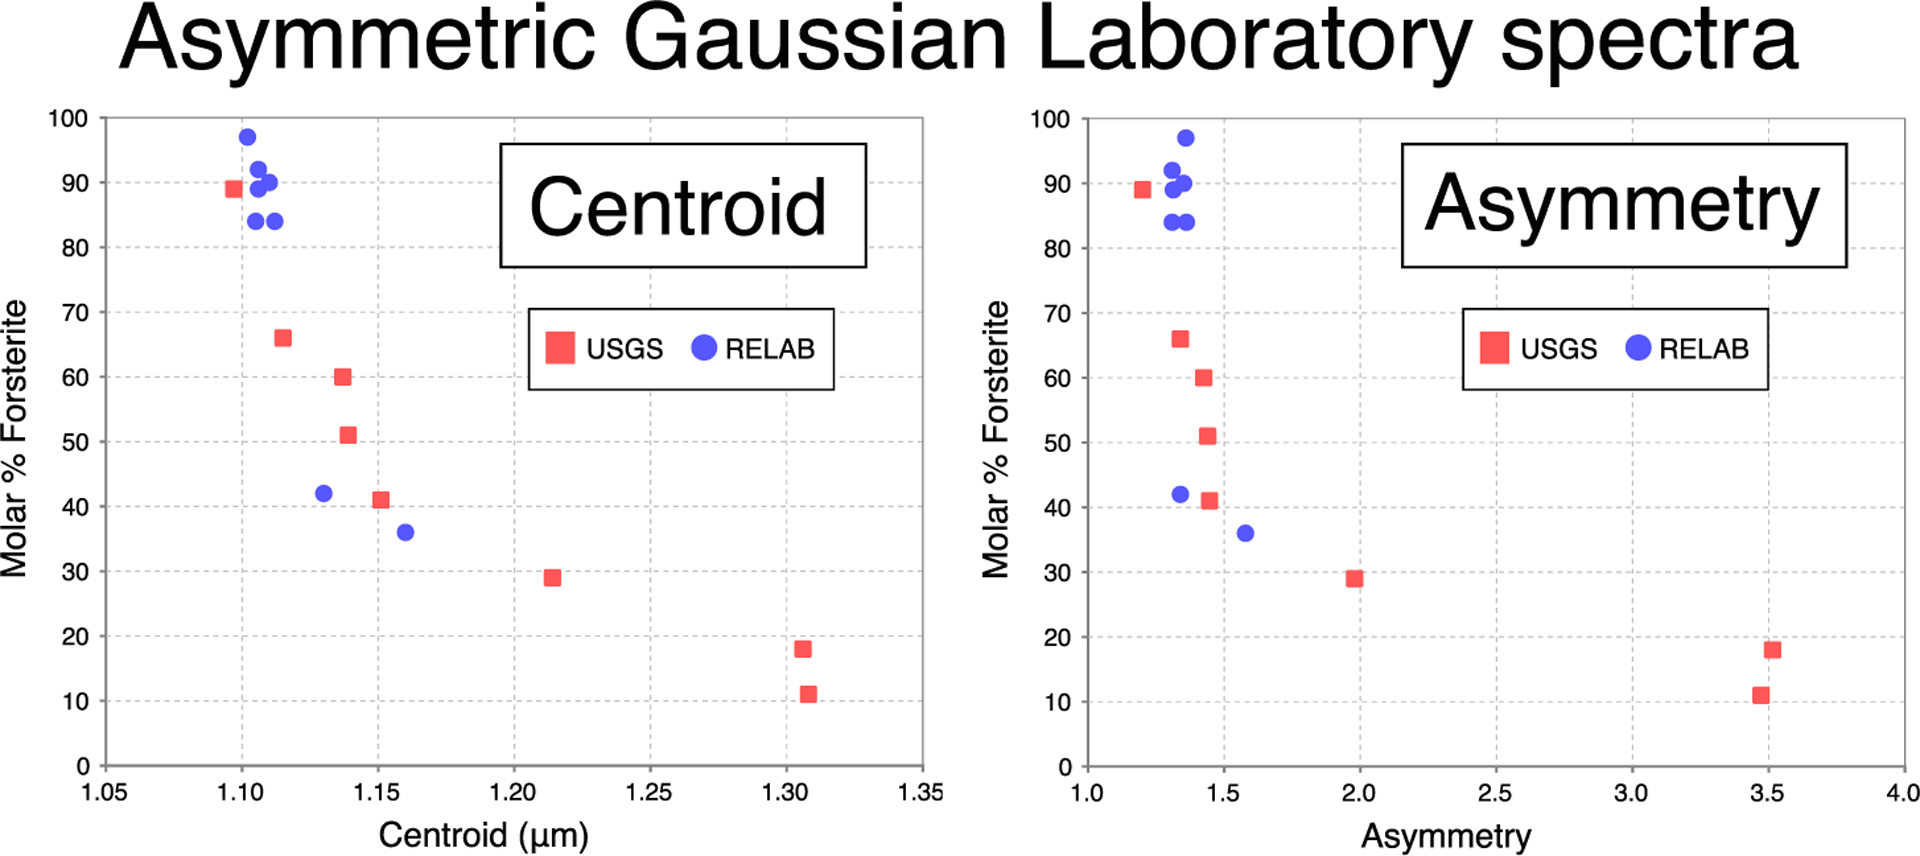
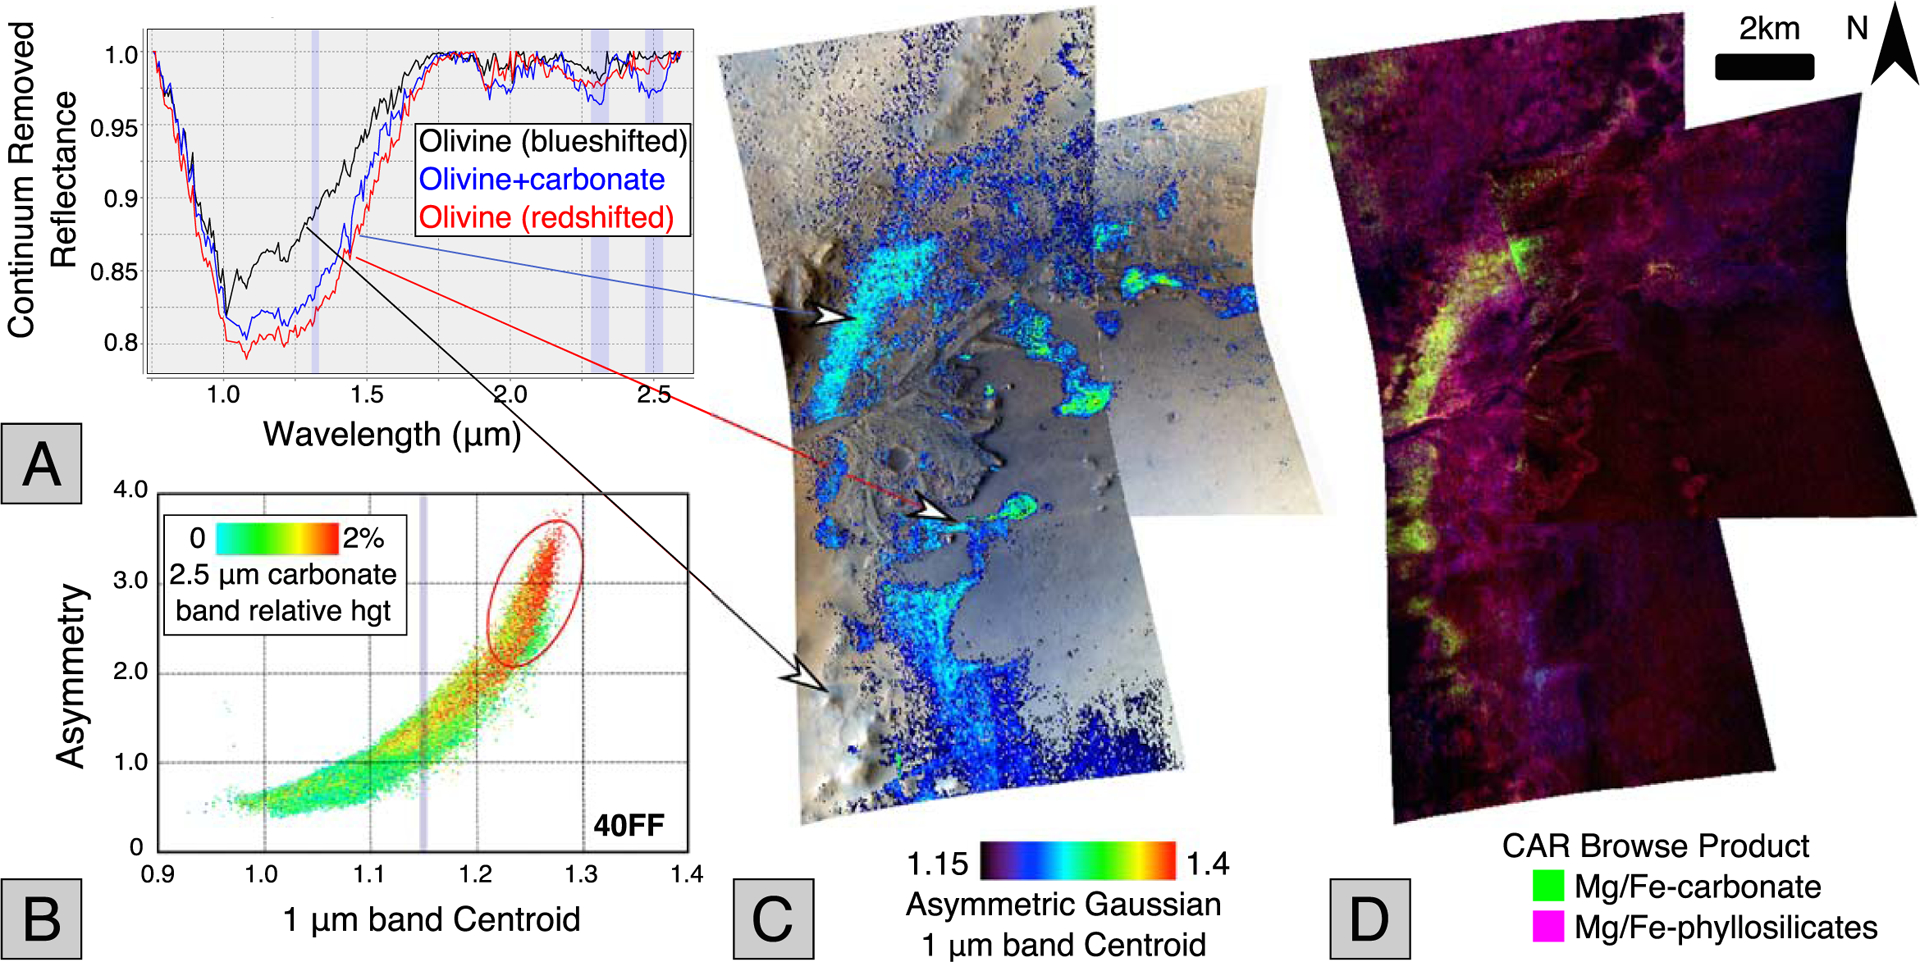
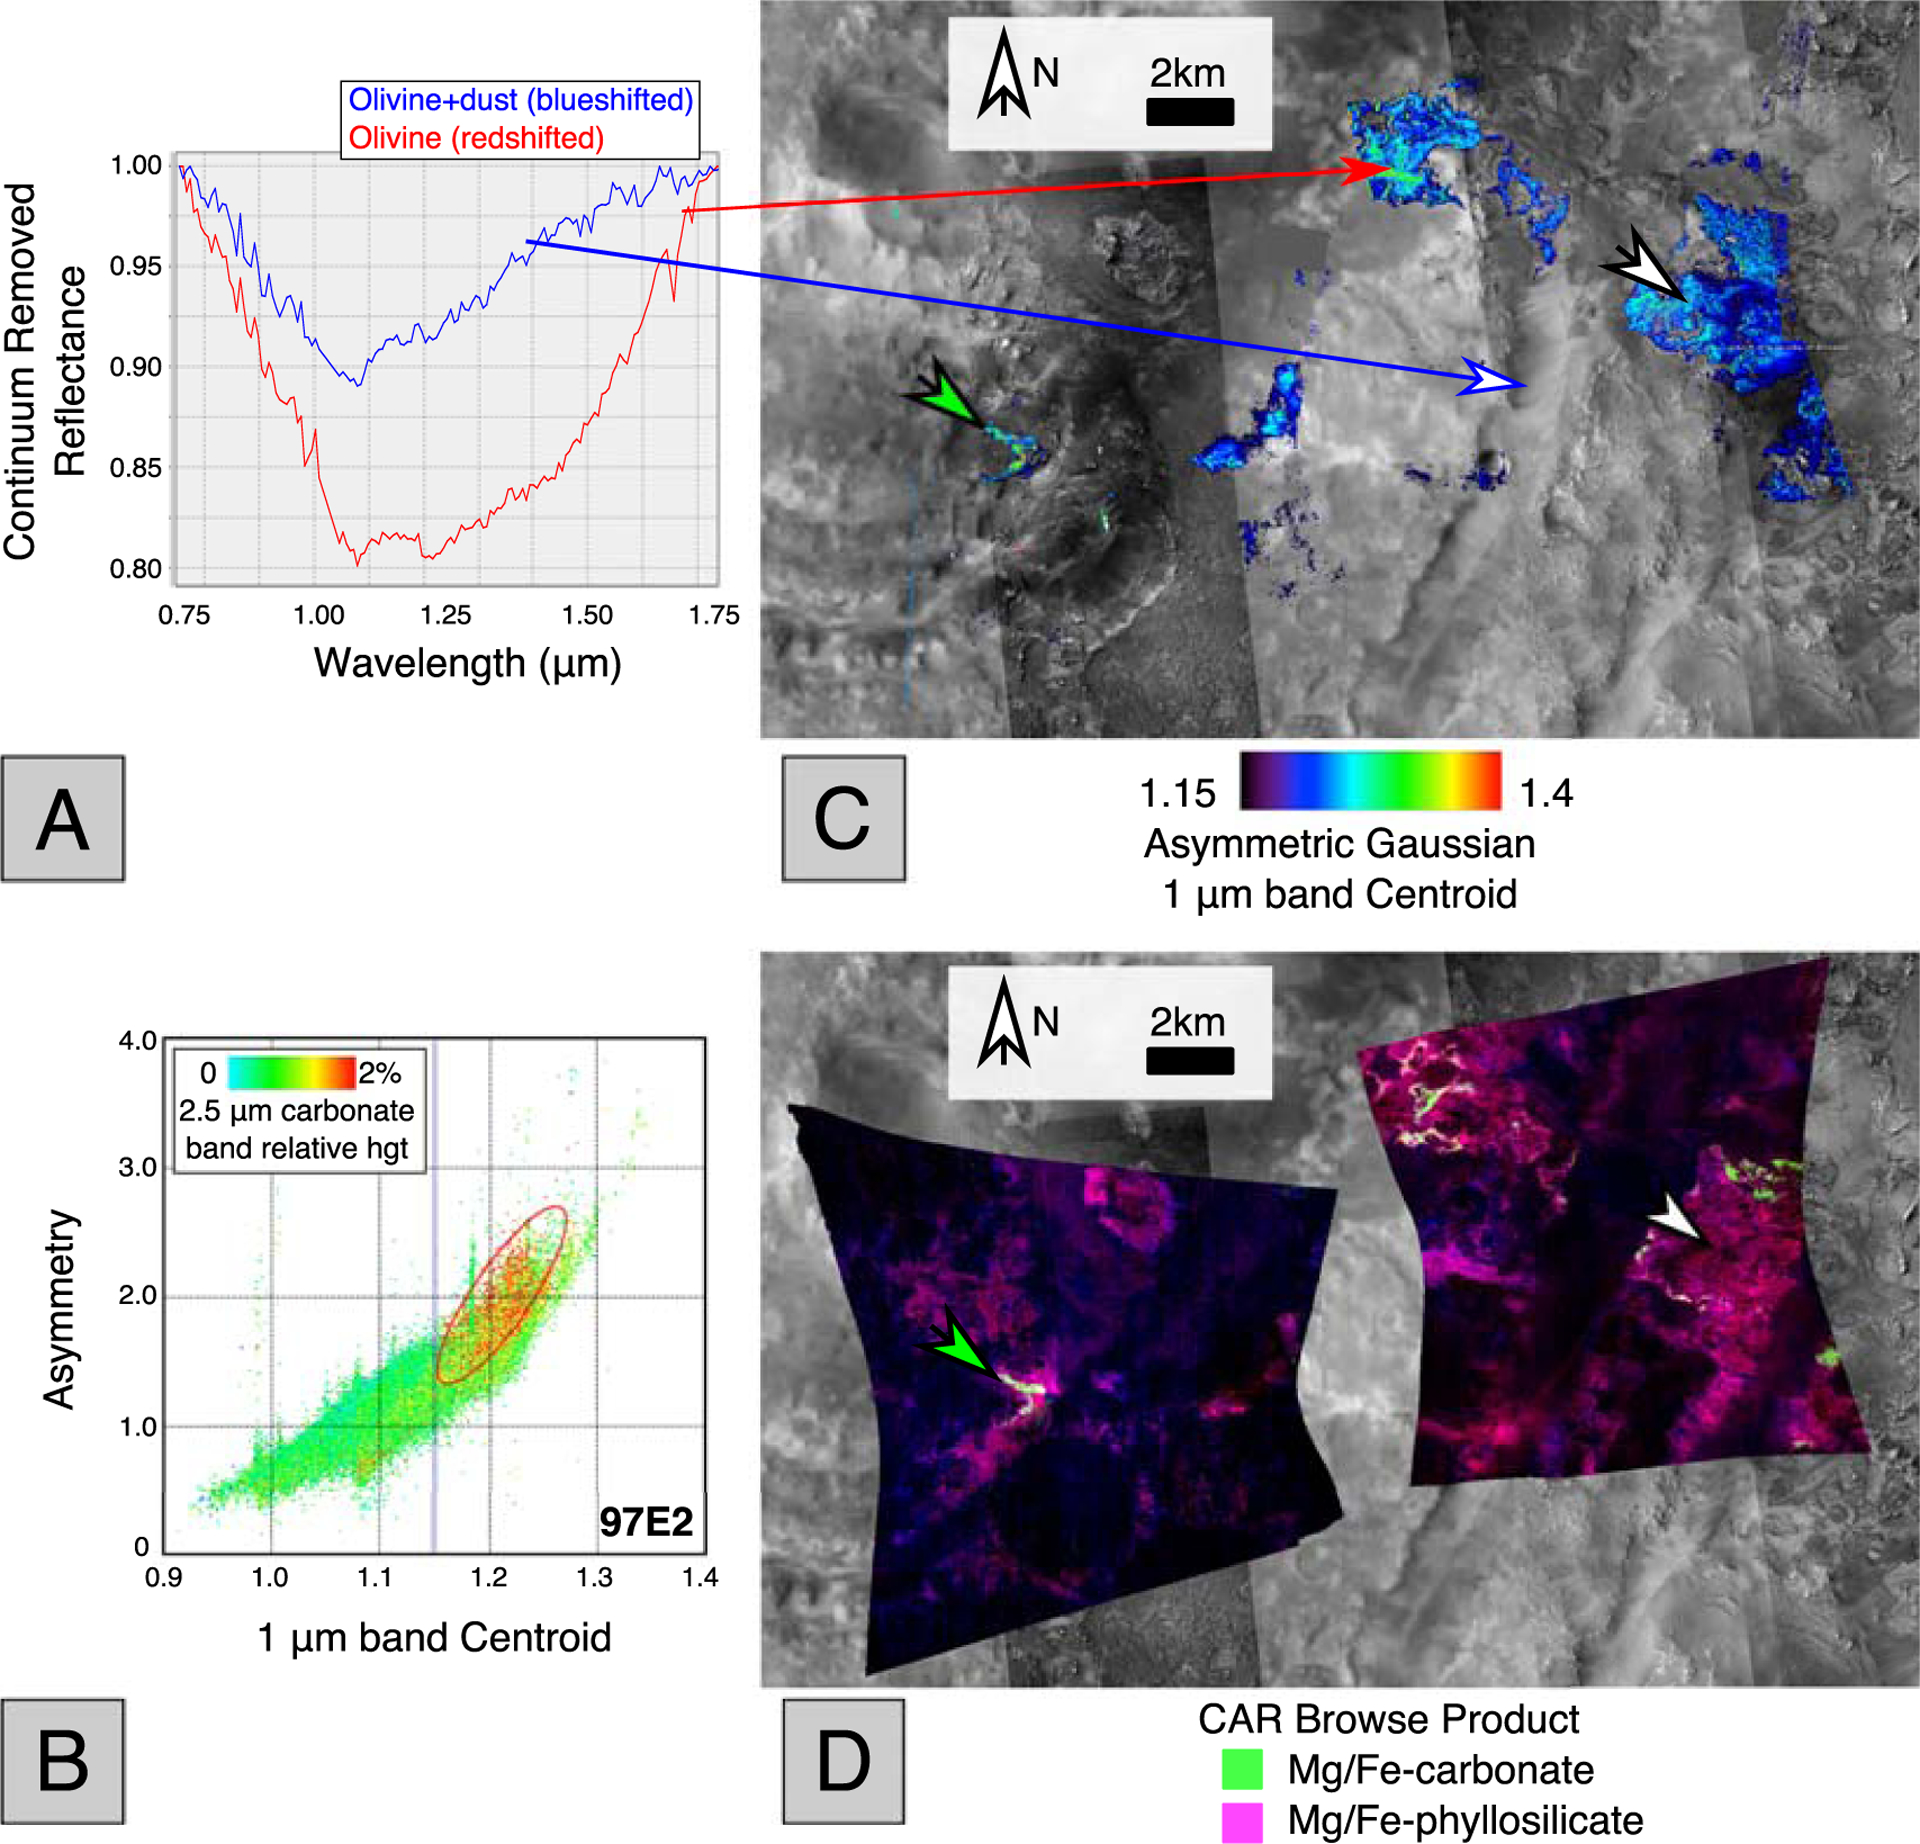
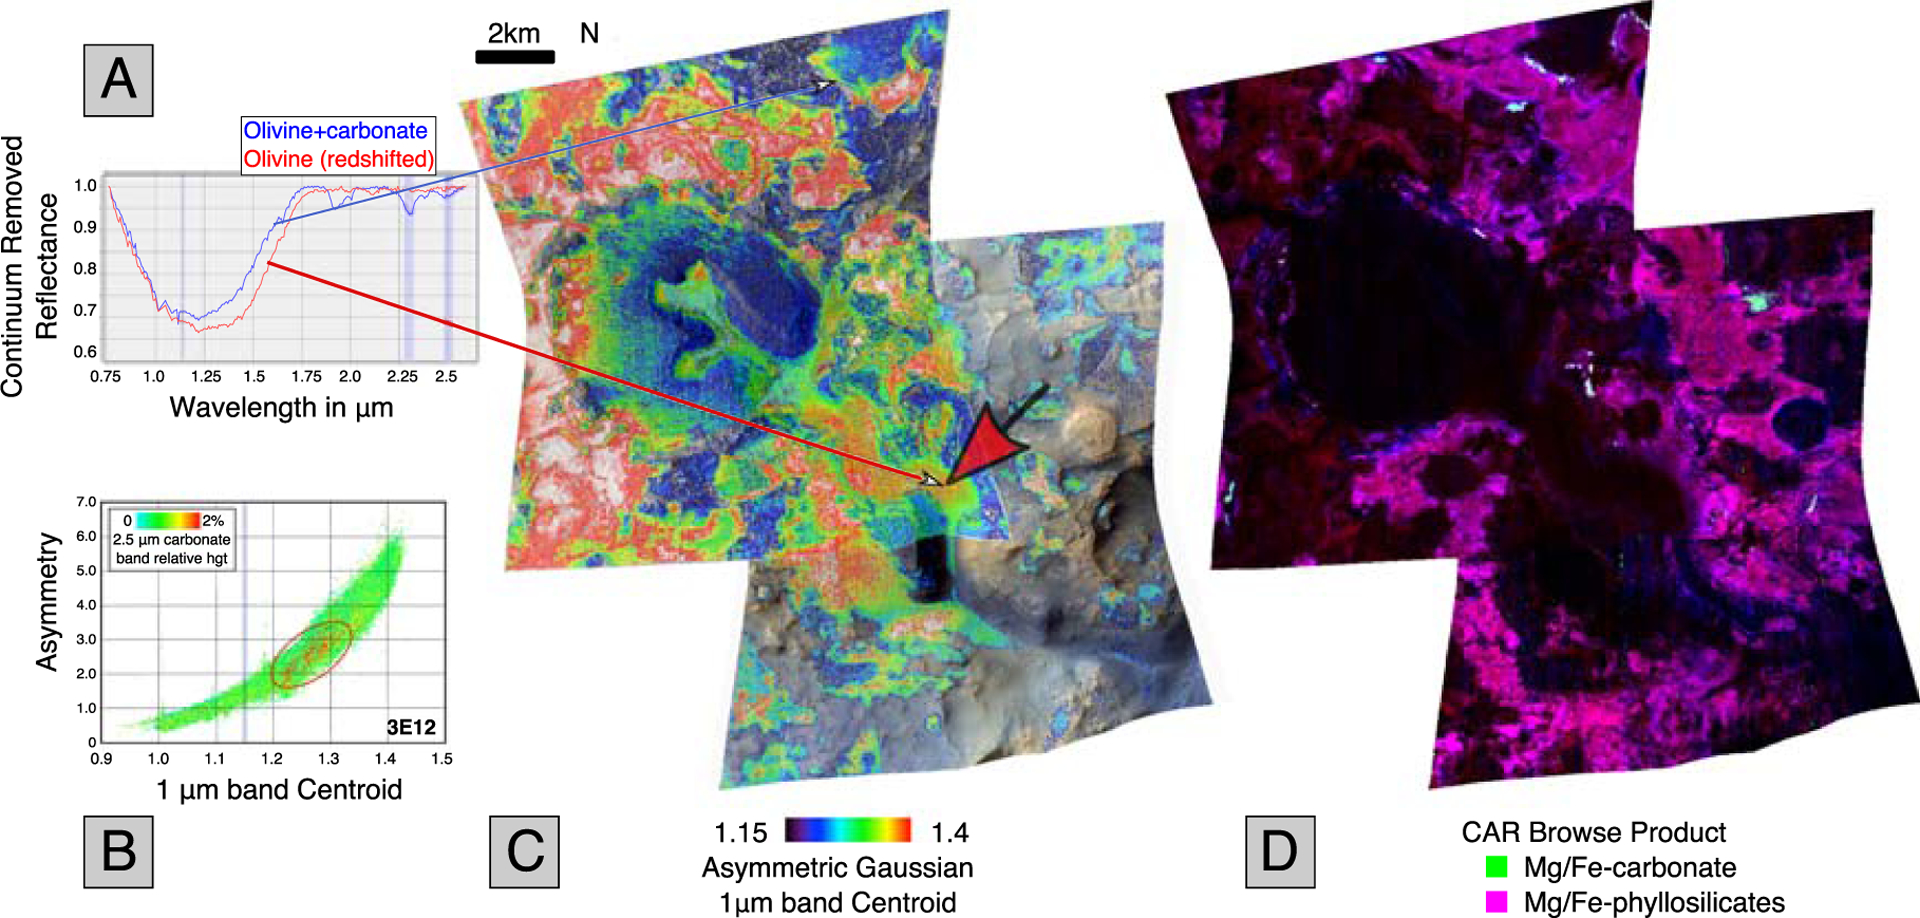
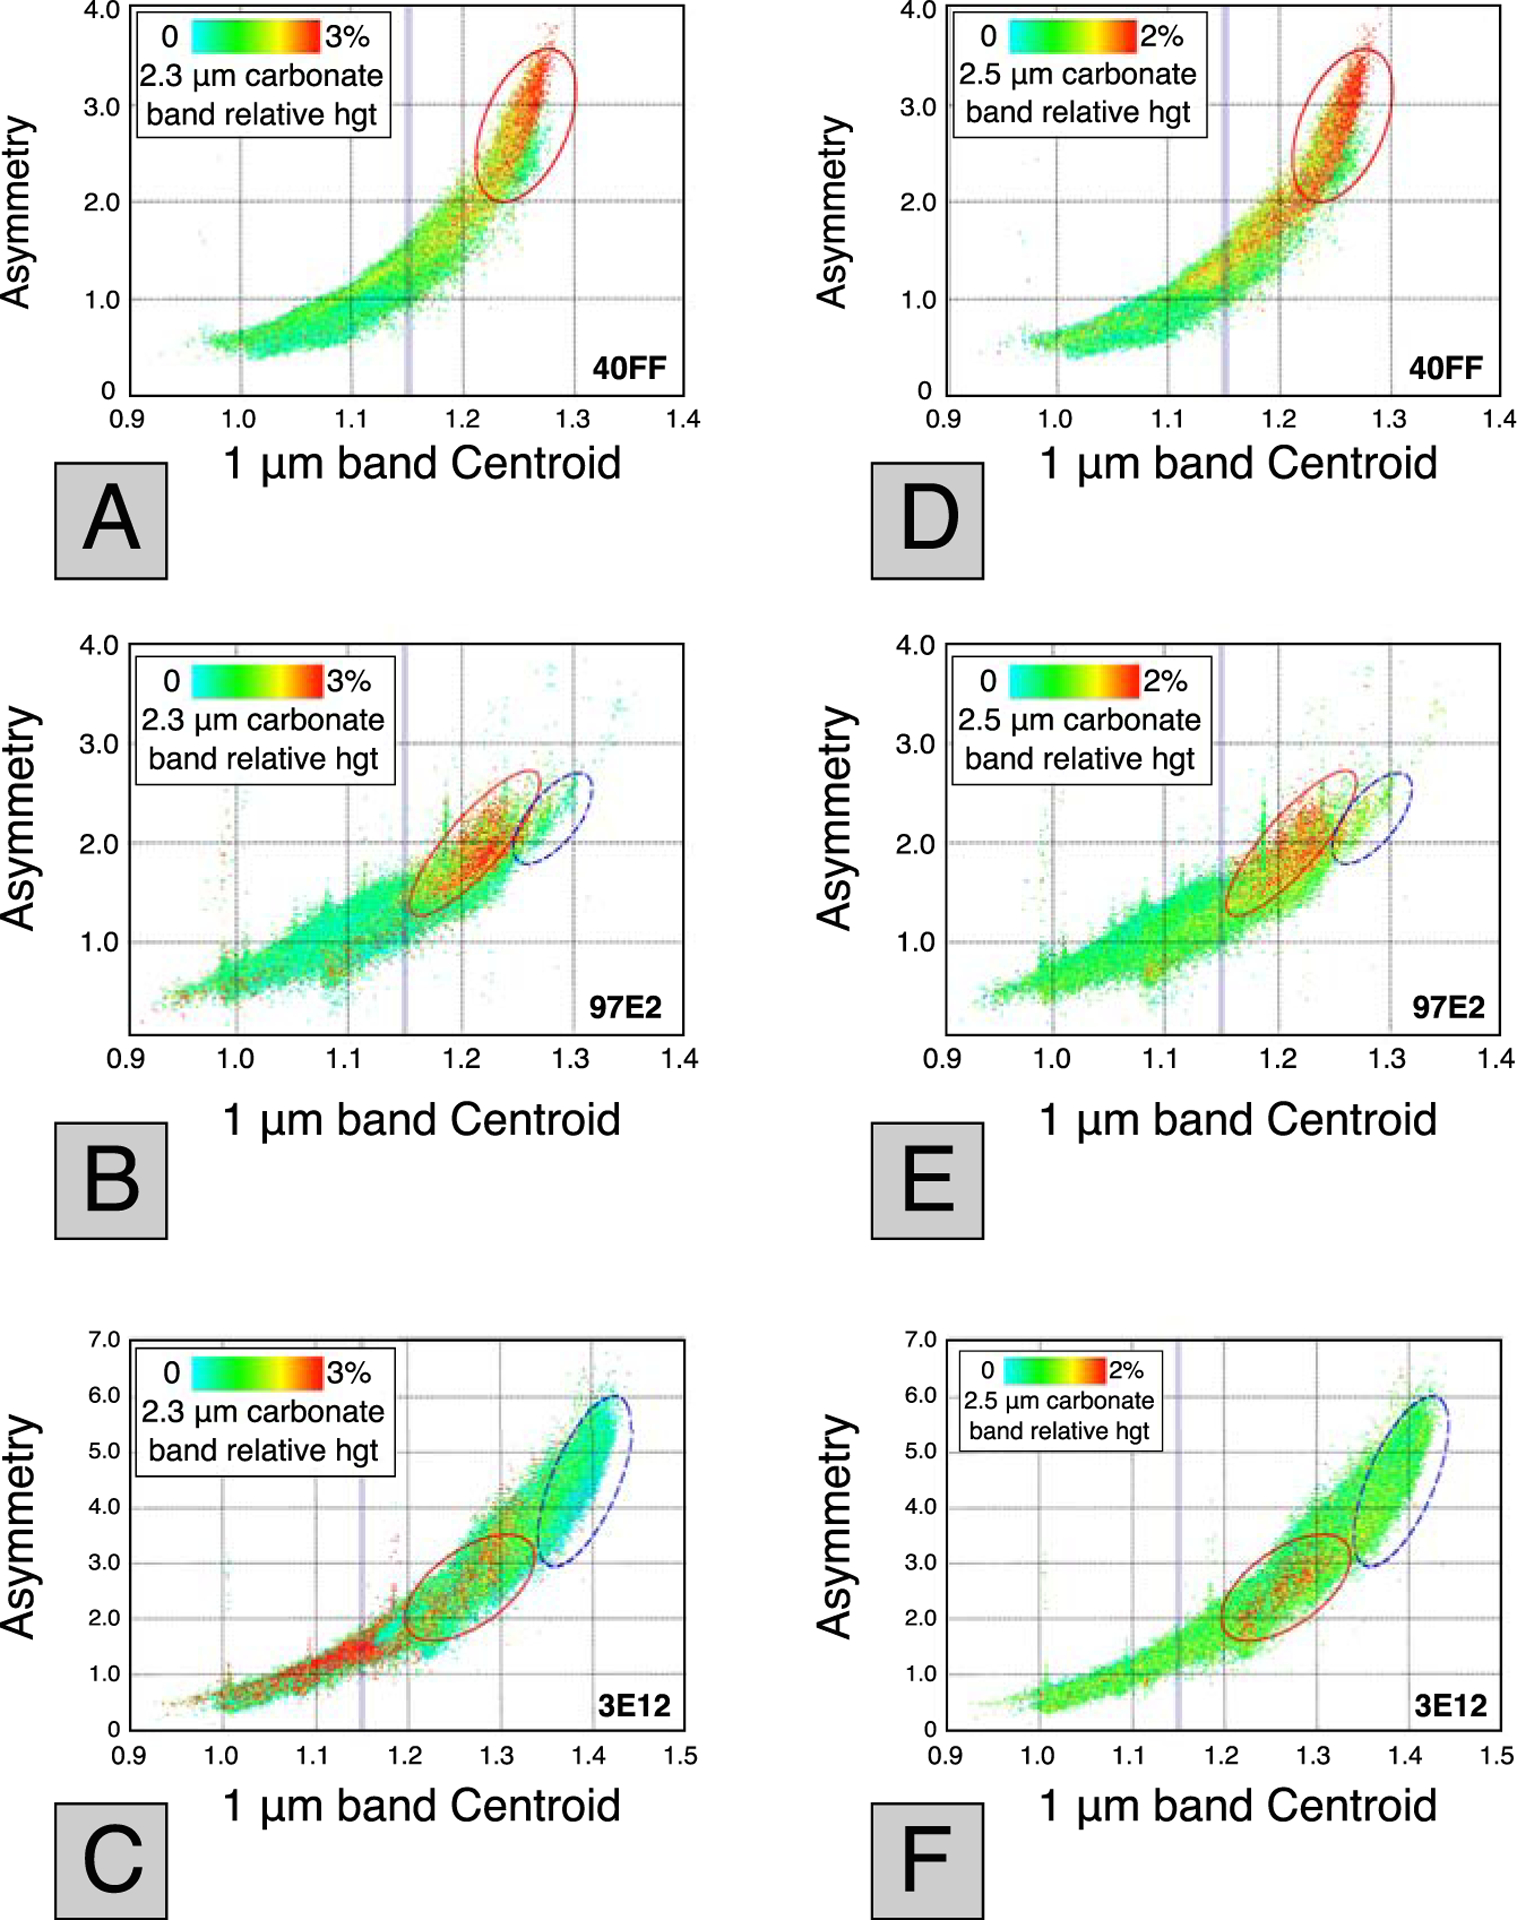
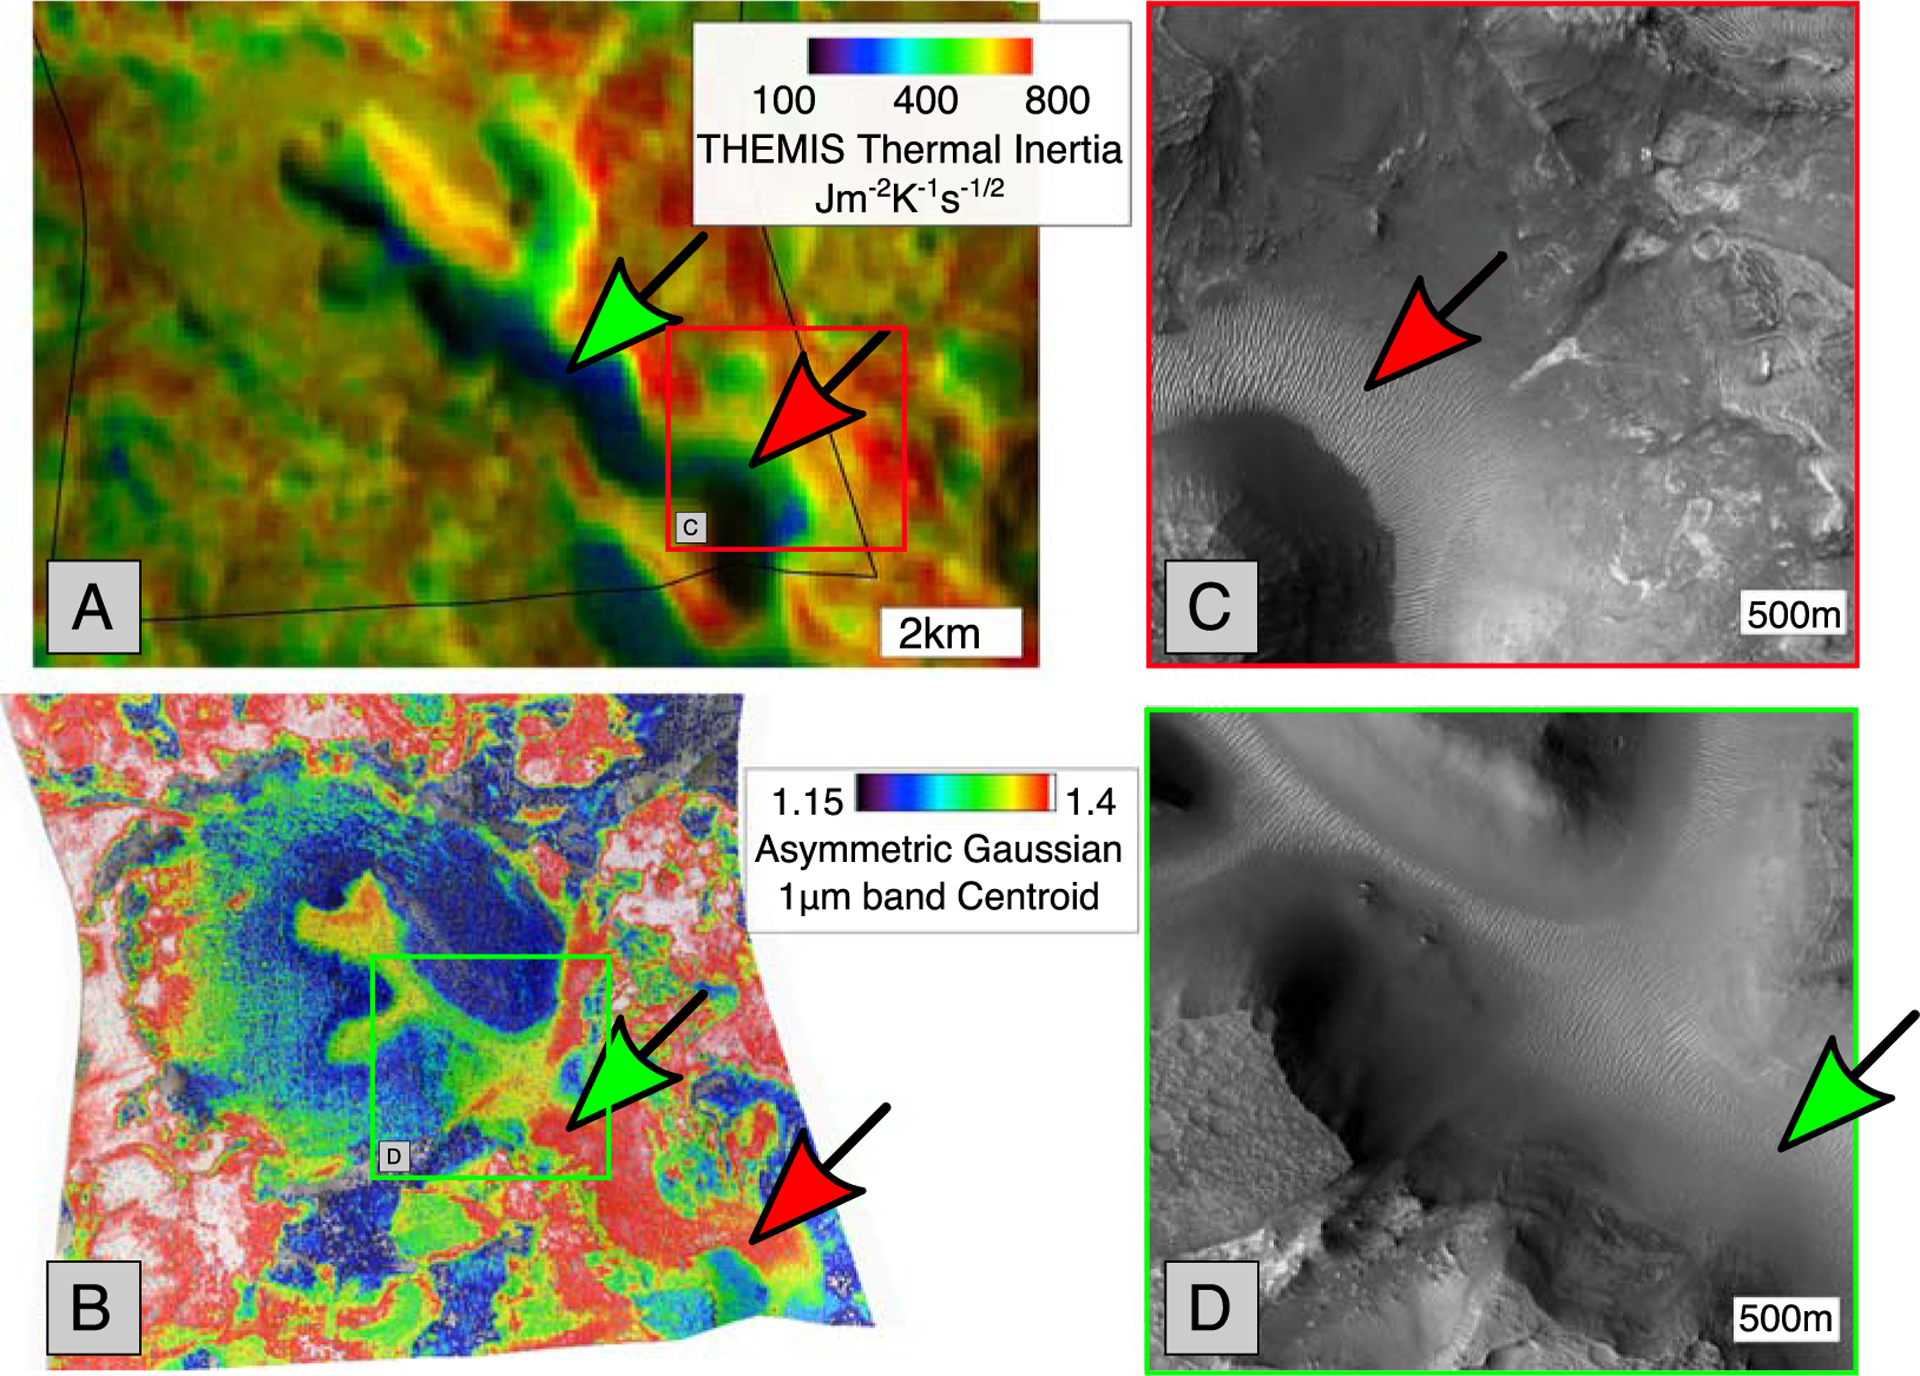
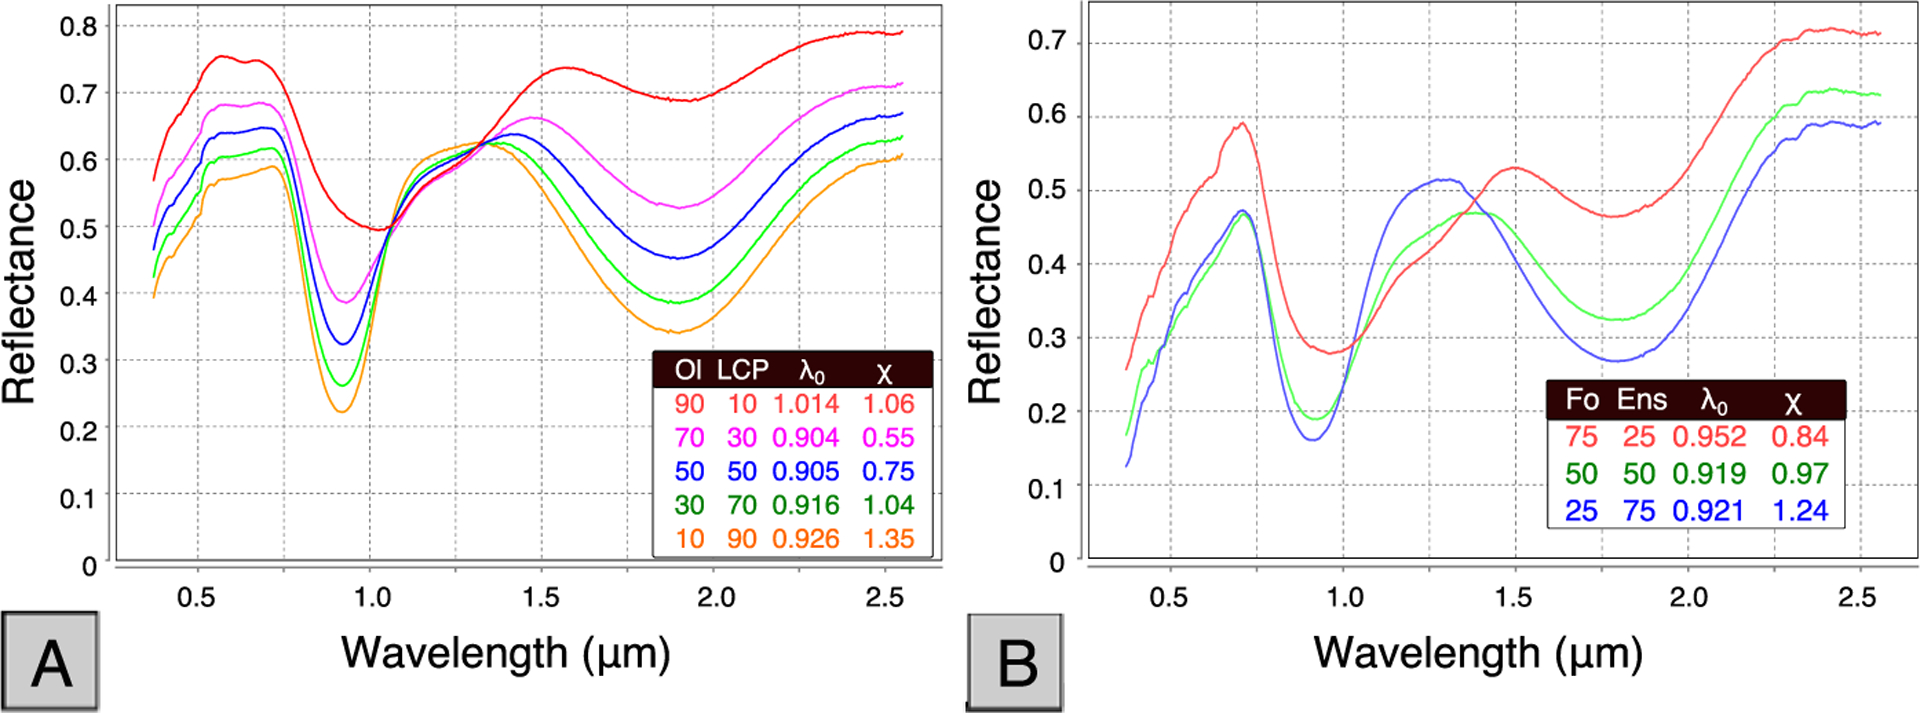
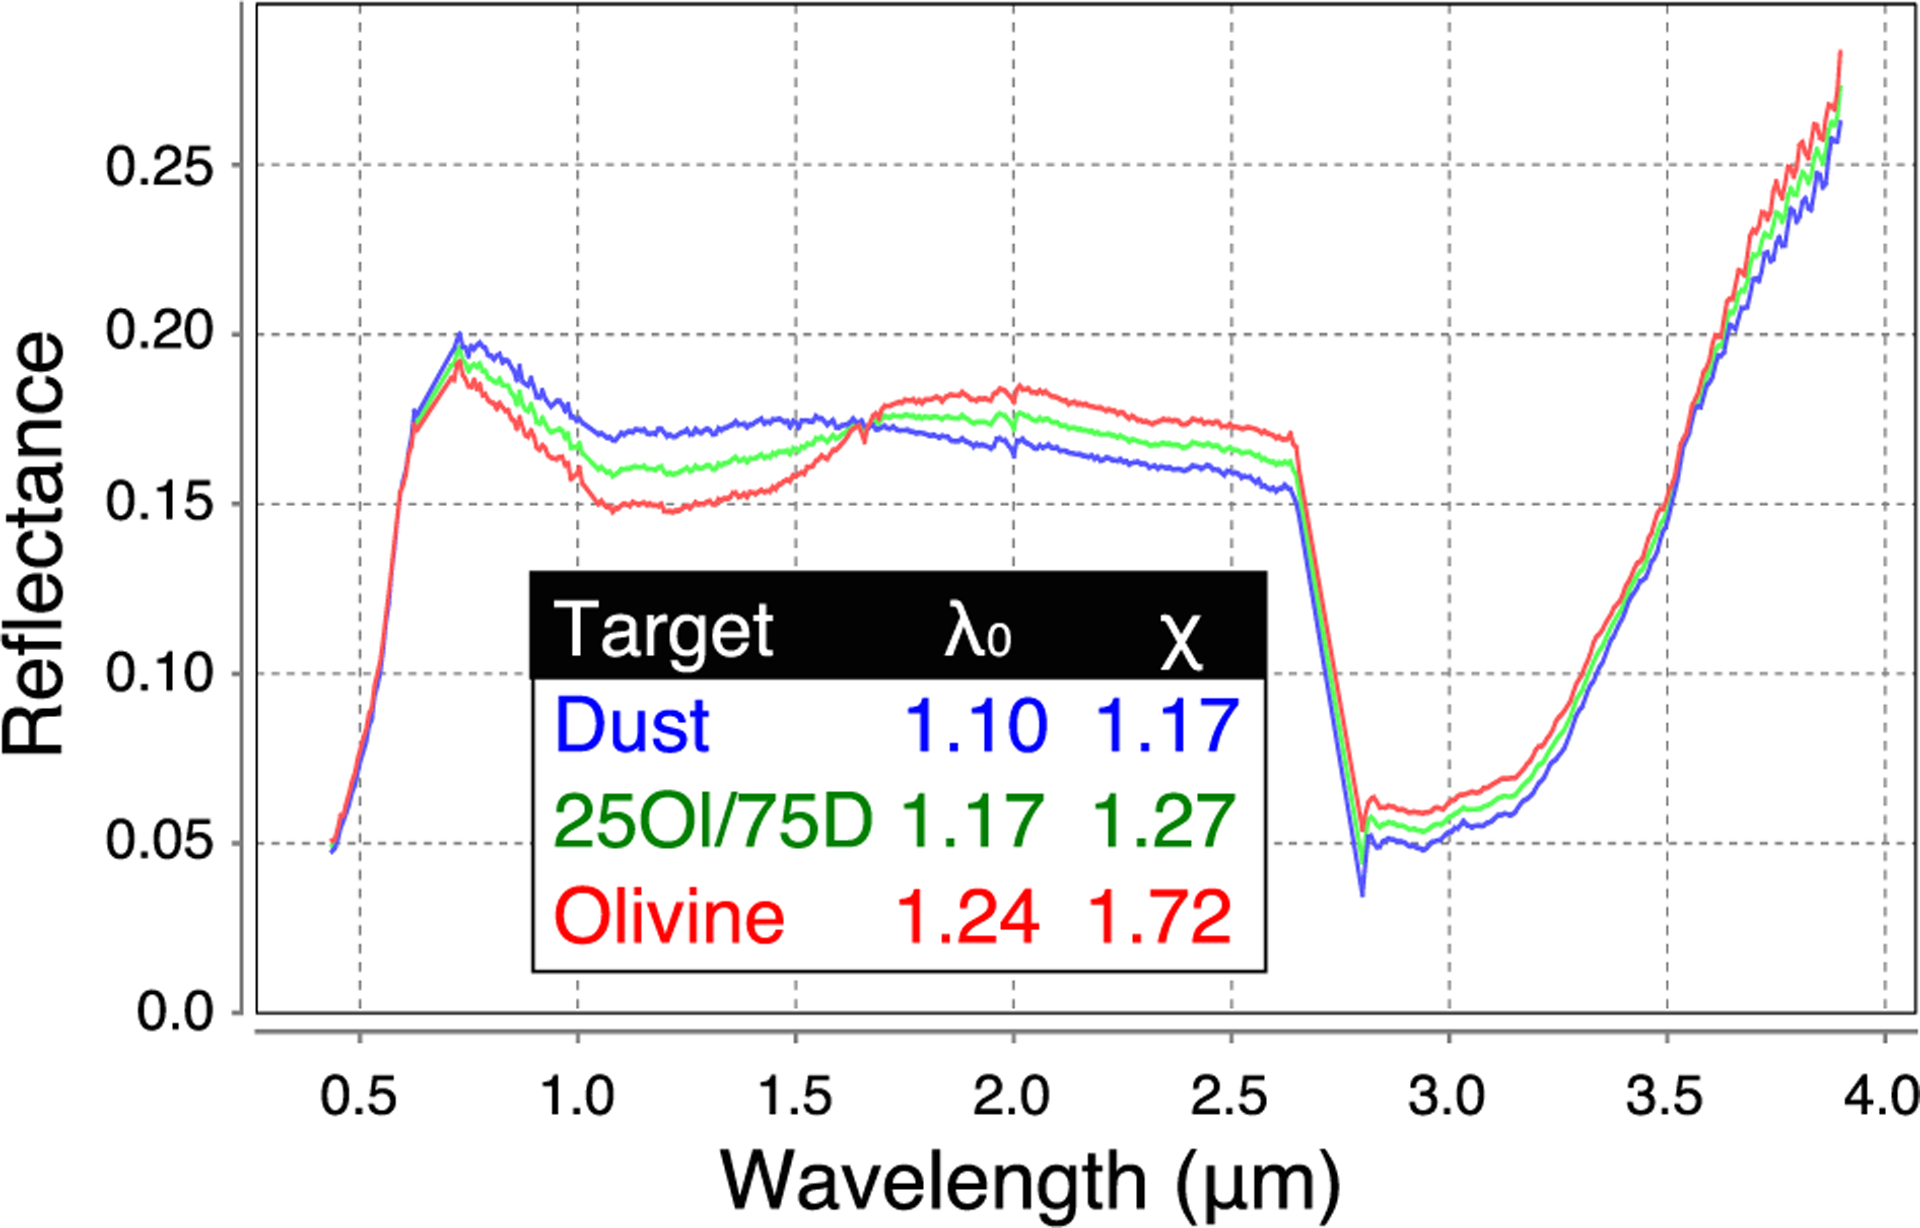
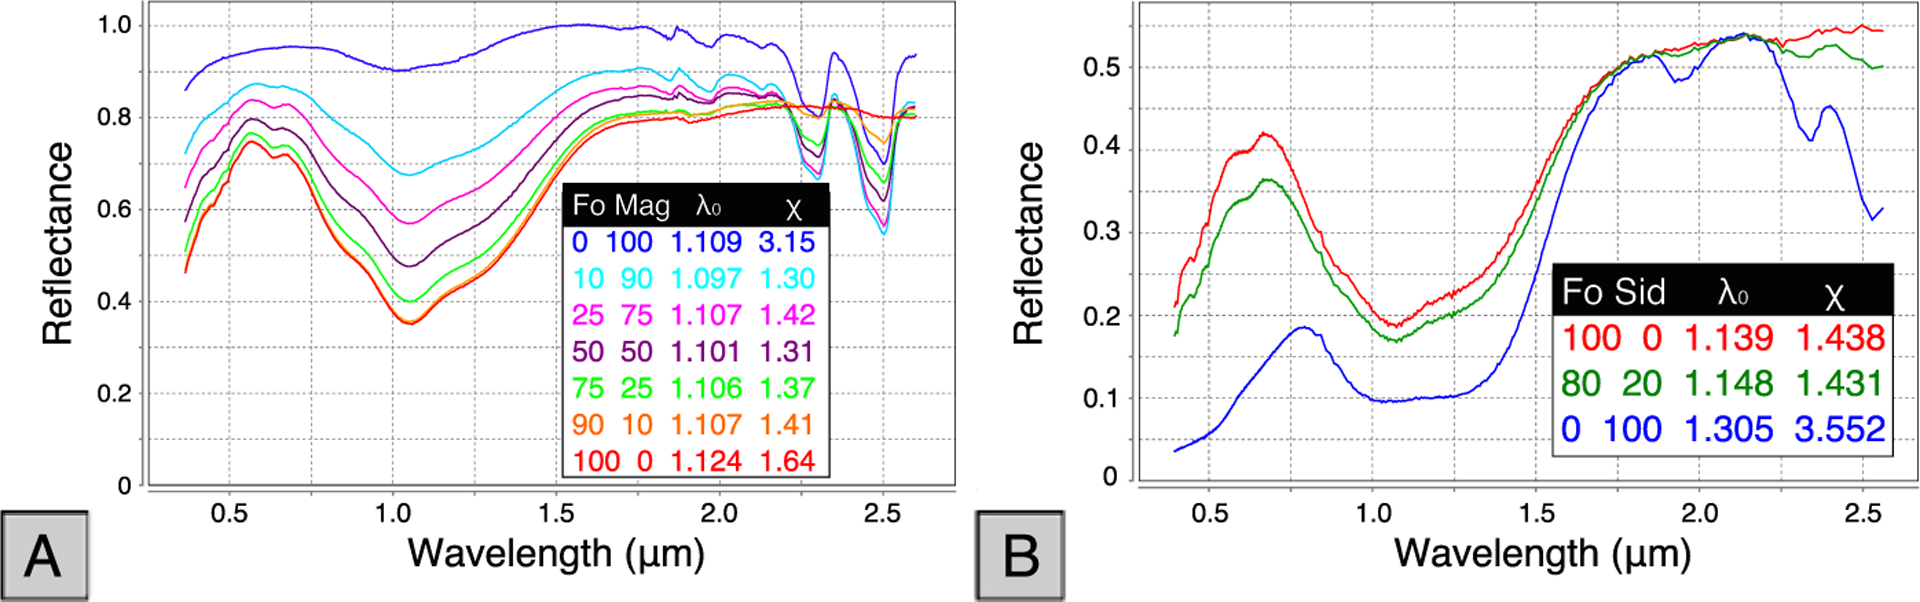
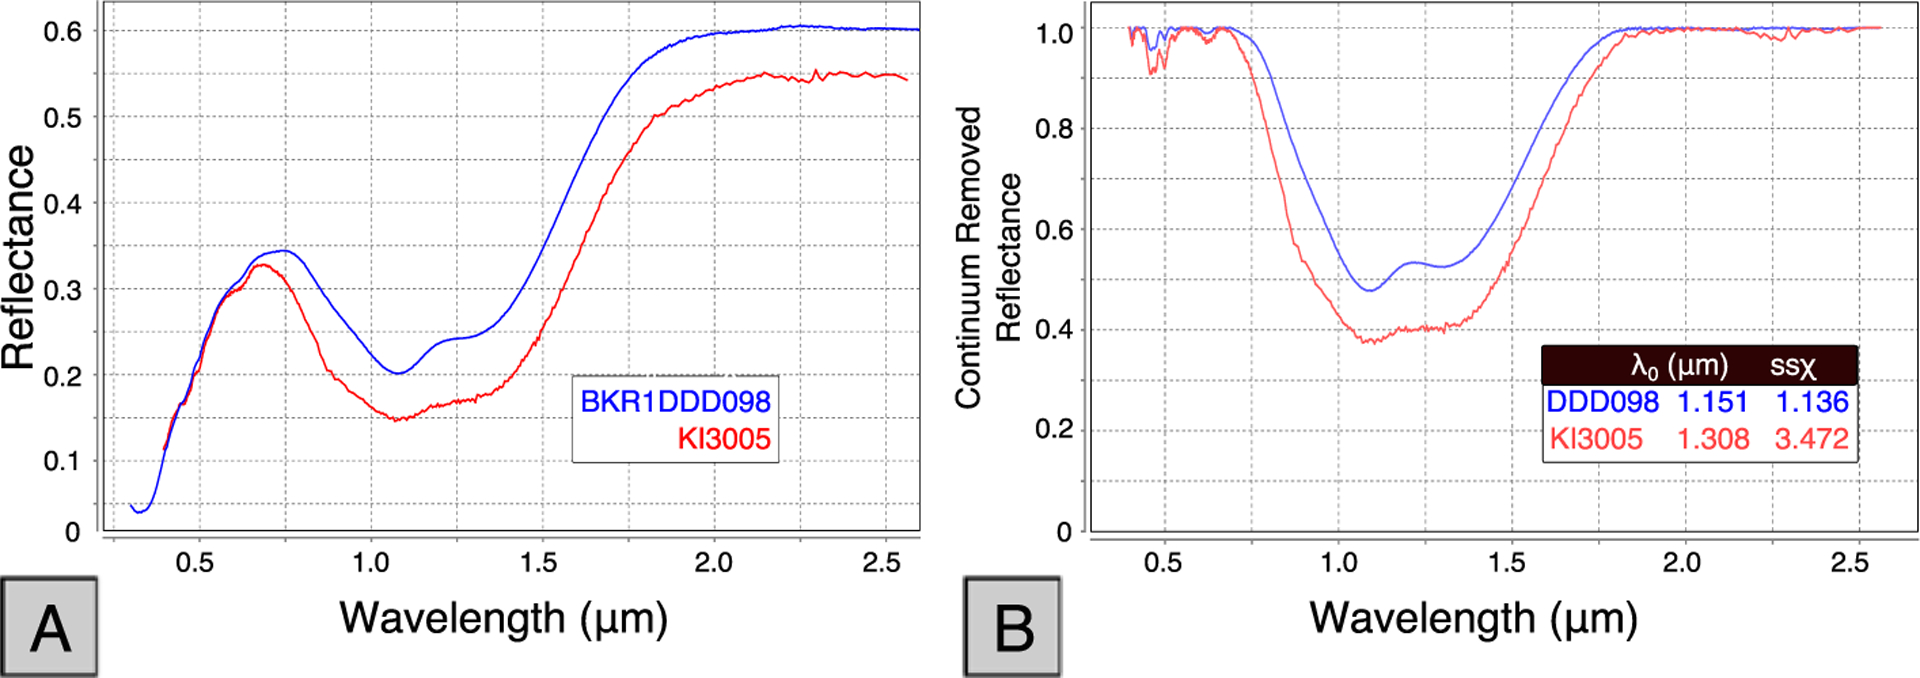
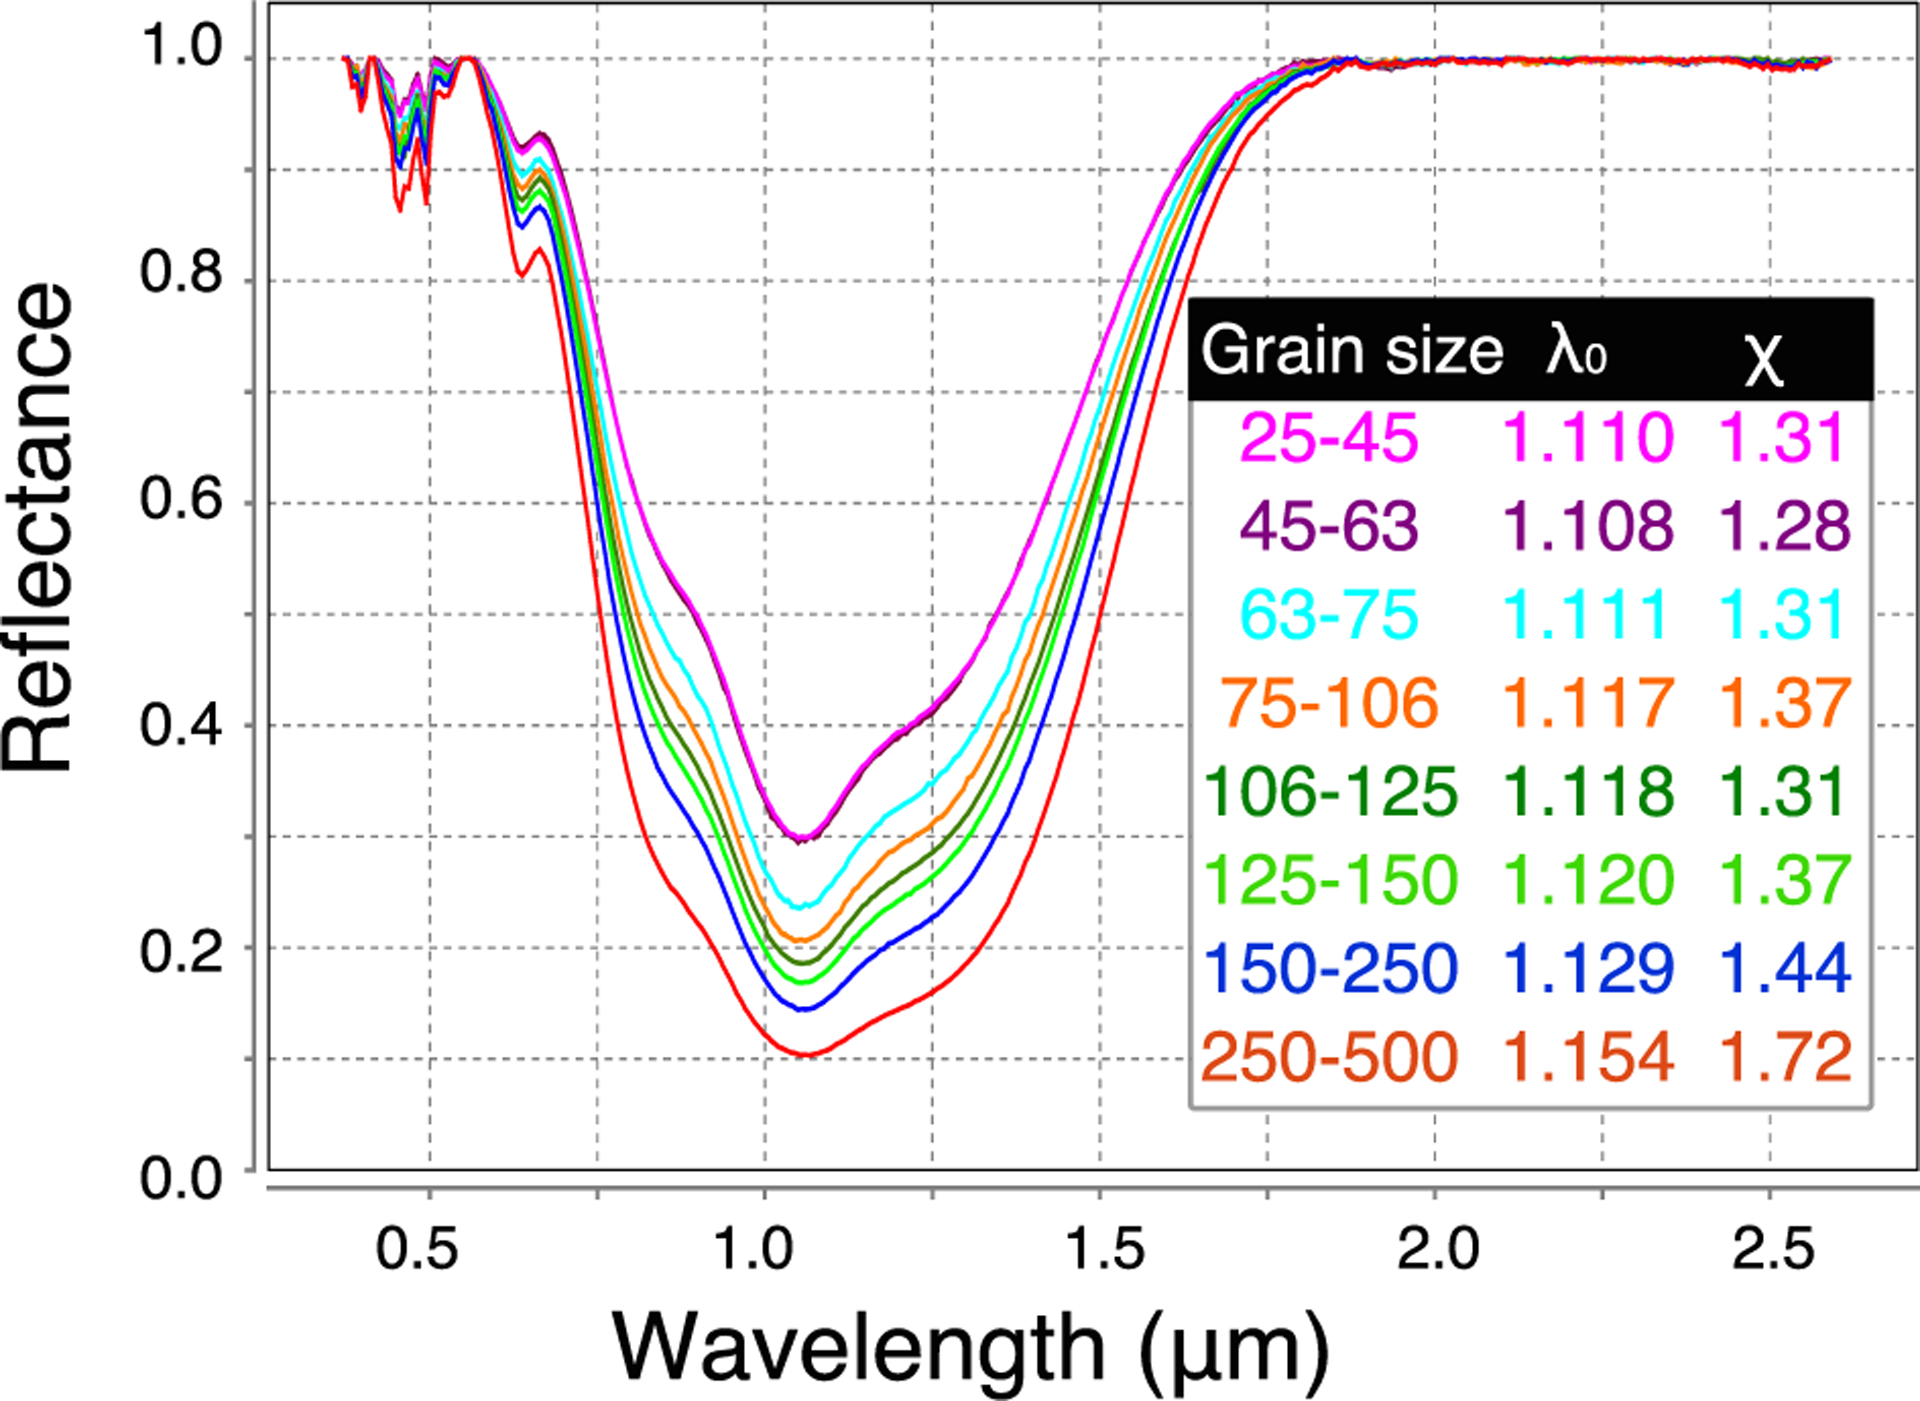
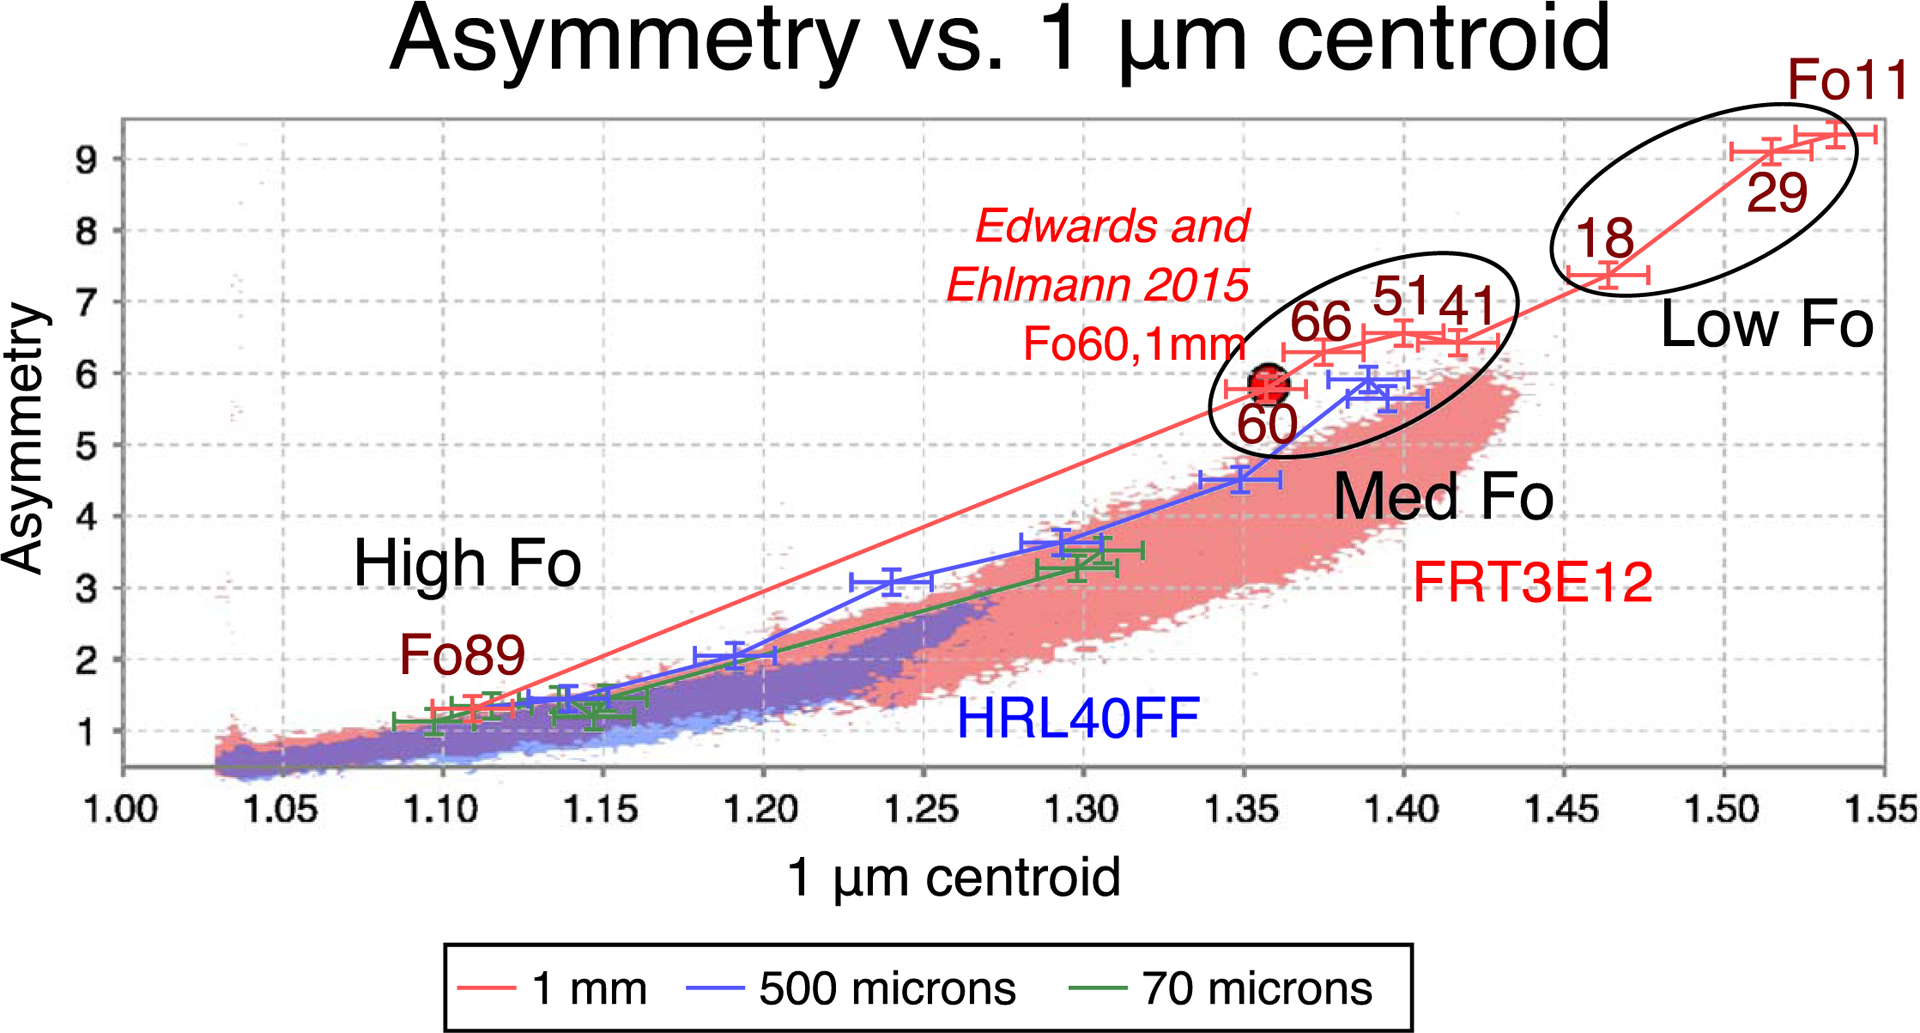
A well-preserved, ancient delta deposit, in combination with ample exposures of carbonate outcrops, makes Jezero Crater in Nili Fossae a compelling astrobiological site. We use Compact Reconnaissance Imaging Spectrometer for Mars (CRISM) observations to characterize the surface mineralogy of the crater and surrounding watershed. Previous studies have documented the occurrence of olivine and carbonates in the Nili Fossae region. We focus on correlations between these two well-studied lithologies in the Jezero crater watershed. We map the position and shape of the olivine 1 μm absorption band and find that carbonates are found in association with olivine which displays a 1 μm band shifted to long wavelengths. We then use Thermal Emission Imaging Spectrometer (THEMIS) coverage of Nili Fossae and perform tests to investigate whether the long wavelength shifted (redshifted) olivine signature is correlated with high thermal inertia outcrops. We find that there is no consistent correlation between thermal inertia and the unique olivine signature. We discuss a range of formation scenarios for the olivine and carbonate associations, including the possibility that these lithologies are products of serpentinization reactions on early Mars. These lithologies provide an opportunity for deepening our understanding of early Mars and, given their antiquity, may provide a framework to study the timing of valley networks and the thermal history of the Martian crust and interior from the early Noachian to today.


Figures

Figure 1.
Figure 1.
Location of Nili Fossae and Jezero crater (west of Isidis Basin) showing regions discussed in the text. Base map is “THEMIS Day IR with MOLA Color” obtained using JMars (Christensen et al., 2009). Inset image shows the study region in a red box, with the location shown as relatively dark and dust free. Shown in pale green is the extent of the olivine-carbonate unit as mapped by Kremer et al. (2019).
Figure 2.
Figure 2.
Framework formation history for Jezero crater lithologies for the period 3.96–2.6 Ga. Step 1 is the impact that formed Jezero, Step 2 is the emplacement of the Fe-rich olivine-carbonate lithology and the variable carbonatization of this lithology, Step 3 is the emplacement of the two deltas, and Step 4 is erosion of the deltas and emplacement of crater infill, leading to the crater as we see it today. Age of Isidis impactor is from Werner (2008), and age of crater fill unit is constrained by the crater counting study of Shahrzad et al. (2019).
Figure 3.
Figure 3.
Summary of olivine composition results from previous remote and in situ studies of global Mars surveys, MER measurements at Gusev crater, and the olivine-phyric shergotites, updated, and expanded from McSween et al. (2006).
Figure 4.
Figure 4.
Example asymmetric Gaussian modeling of the library spectra of two laboratory olivine samples (GDS70.d and KI3005) and a redshifted olivine CRISM spectrum from FRT3E12. The GDS70.d has Fo#89, and the fitting band is more symmetric. The KI3005 has Fo#11, and the fitting band is more asymmetric. The CRISM spectrum 1 μm band is more saturated than the lab spectra, and so the centroid and asymmetry are even higher than the lab spectra.
Figure 5.
Figure 5.
Laboratory spectra asymmetric Gaussian fitting results for RELAB and USGS spectra. These demonstrate the tendency of the centroid and asymmetry to decrease with increasing Fo#. This plot includes all 16 laboratory olivine spectra that have grain size <70 microns.
Figure 6.
Figure 6.
(a) Example continuum removed spectra from arrowed locations in images HRL40FF and FRT47A3. The 1.3, 2.3, and 2.5 μm regions are indicated by shaded vertical regions. (b) Plot of asymmetry versus centroid position for the 1 μm absorption band, color coded for the strengths of the 2.5 μm feature indicative of carbonates for all pixels from HRL40FF. (c) Olivine 1 μm band centroid map of Jezero western delta covered by CRISM images HRL40FF and FRT47A3. Arrows show regions where example spectra were obtained. (d) CRISM CAR standard browse product of the Jezero delta, (R: D2300, G: BD2500_2, B: BD1900_2) showing regions where carbonate is present due to the presence of a 2.3 accompanied by a 2.5 μm band (bright yellow-green-white tones). Phyllosilicates with 2.3 and 1.9 μm bands are in magenta.
Figure 7.
Figure 7.
(a) Example continuum removed 1 μm band absorption band from two example points showing olivine (red) and dust with olivine (blue). The arrows indicate their locations on the CRISM image. (b) The correlation map of carbonate versus asymmetry and centroid, showing carbonate pixels (with a 2.5 μm band present) in red. The 1.15 μm threshold is indicated by a vertical line. (c) Olivine mineralogy of Nili Fossae as mapped in CRISM images FRT23370 (left) and 97E2 (right) overlying a CTX basemap with HiRISE images where available. The 1 μm band centroid map has been thresholded as discussed in the text. (d) Carbonate standard browse product (CAR) (R: D2300, G: BD2500_2, B: BD1900_2) showing regions where carbonate is present due to the presence of a 2.3 accompanied by a 2.5 μm band (bright yellow-green-white tones). Phyllosilicates with 2.3 and 1.9 μm bands are in magenta. Note that carbonates are only associated with the redshifted olivine unit, and this lithology is only partially carbonatized (green arrow indicates carbonate is detected, white arrows where it is not).
Figure 8.
Figure 8.
Olivine and carbonate mineralogy for CRISM image FRT3E12 and FRTB438. (a) Example continuum removed spectra from CRISM FRT3E12, with locations shown by arrows. Note that 2.3 and 2.5 bands indicate the presence of carbonate in the blue spectrum. The red spectrum does not have carbonates, and the 1 μm band is further redshifted to long wavelengths. (b) Asymmetry versus centroid correlation map for 3E12, color coded in red for the presence of the 2.5 μm carbonate band. The plot shows carbonates are not associated with the extreme right shifted olivine spectra in this scene. The 1.15 μm threshold is shown as a vertical line. (c) 1 μm band centroid map for FRT3E12 and FRTB438. The large red arrow indicates an area where dunes have formed that is also indicated by a red arrow in Figure 9. (d) CRISM CAR Browse product (R: D2300, G: BD2500_2, B: BD1900_2) showing regions where carbonate is present due to the presence of a 2.3 accompanied by a 2.5 μm band (bright yellow-green-white tones). Phyllosilicates with 2.3 and 1.9 μm bands are in magenta.
Figure 9.
Figure 9.
Asymmetry versus centroid correlation maps. The 1.15 μm threshold is shown as a vertical line. (a-c) Color coded in red for the presence of the 2.3 μm phyllosilicate + carbonate band, relative height scaled to 3%. (d-f) Color coded for presence of 2.5 μm carbonate band, relative height scaled to 2%. Red ellipses correspond to pixels that show both a 2.3 and 2.5 μm band. Blue (dashed) ellipses show absence of these bands at the longest band centers.
Figure 10.
Figure 10.
(a) THEMIS thermal inertia map around CRISM image FRT3E12 (outline shown in black). (b) CRISM image 3E12 1 μm band centroid image that overlaps the THEMIS scene, showing red and green arrows pointing to redshifted olivine. (c) HiRISE image ESP_026992_2025_RED magnified showing location of dunes pointed to by red arrow. (d) HiRISE image PSP_002888_2025_RED showing magnified location of green arrow pointing to dunes in the THEMIS image (a), blue represents low thermal inertia, fine grain material, red represents bedrock, large grain size material. The red and green arrows in (a) point to blue low thermal inertia material, implying a fine grain size. In the CRISM 1 μm band image, red (and white) indicates the highest redshifted olivine. In (b) the red and green arrows point to highly redshifted material.
Figure 11.
Figure 11.
Effects on 1 μm band position of intimate mixing of olivine with pyroxene, showing a shift to shorter wavelengths with greater amounts of pyroxene. (a) Intimate mixing of olivine with low calcium pyroxene (LCP) from Corrigan et al. (2007). (b) Intimate mixing of Forsterite olivine and Enstatite pyroxene, data from Freeman et al. (2010).
Figure 12.
Figure 12.
Spectral effects of mixing an example CRISM olivine spectrum with a “dusty” spectrum from the same scene in a 25% olivine/75% dust linear mixture. Locations of the spectra are shown in Figure 7.
Figure 13.
Figure 13.
Effects of mixing olivine with carbonate on the 1 μm band position. (a) Forsterite intimately mixed with magnesite, showing the very small (10 nm) shift of the 1 μm band to shorter wavelengths with greater amounts of carbonate, data are from Bishop et al. (2013). (b) Linear mix of KI3188 Fo51 olivine with siderite HS271.3B, showing that the olivine 1 μm band is shifted by 9 nm in the case of an 80/20 mix and that the 2.3 and 2.5 μm carbonate bands are clearly visible in the mixed spectrum.
Figure 14.
Figure 14.
(a) Comparison of KI3005 (Fo11, <60 microns) and BKR1DDD098 (Fo0, <45 microns) spectra, showing blue shift behavior of the synthetic olivine. (b) Continuum removed spectra showing the blueshift of BKR1DDD098 with KI3005 using data from Dyar et al. (2009).
Figure 15.
Figure 15.
Continuum removed spectra showing the effect of grain size on the 1 μm band for the second grain size study using data from Mustard and Pieters (1989).
Figure 16.
Figure 16.
Fit of centroid versus asymmetry and olivine composition from asymmetric Gaussian fits of the olivine 1 μm band assuming a grain size of 70, 500, and 1,000 microns. Red shaded region corresponds to points in FRT3E12, blue to HRL40FF.
Figure 17.
Figure 17.
Summary of the effects of mixing and grain size on the 1 μm absorption band.

References

    1. Amador ES, Bandfield JL, & Thomas NH (2018). A search for minerals associated with serpentinization across Mars using CRISM spectral data. Icarus, 311, 113–134. 10.1016/j.icarus.2018.03.021 - DOI
    1. Baldridge AM, Hook SJ, Crowley JK, Marion GM, Kargel JS, Michalski JL, et al. (2009). Contemporaneous deposition of phyllosilicates and sulfates: Using Australian acidic saline lake deposits to describe geochemical variability on Mars. Geophysical Research Letters, 36, L19201 10.1029/2009GL040069 - DOI
    1. Bandfield JL, Glotch TD, & Christensen PR (2003). Spectroscopic identification of carbonate minerals in the Martian dust. Science, 301(5636), 1084–1087. 10.1126/science.1088054 - DOI - PubMed
    1. Bishop JL, Lane MD, Dyar MD, & Brown AJ (2008). Reflectance and emission spectroscopy of four groups of phyllosilicates: Smectites, kaolinite-serpentines, chlorites and micas. Clay Minerals, 43(1), 35–54. 10.1180/claymin.2008.043.1.03 - DOI
    1. Bishop JL, Perry KA, Darby Dyar M, Bristow TF, Blake DF, Brown AJ, & Peel SE (2013). Coordinated spectral and XRD analyses of magnesite-nontronite-forsterite mixtures and implications for carbonates on Mars. Journal of Geophysical Research: Planets, 118, 635–650. 10.1002/jgre.20066 - DOI

LinkOut - more resources