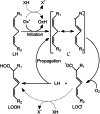
Cannabis sativa extracts protect LDL from Cu2+-mediated oxidation
- PMID: 33123676
- PMCID: PMC7592720
- DOI: 10.1186/s42238-020-00042-0
Cannabis sativa extracts protect LDL from Cu2+-mediated oxidation
Abstract
Background: Multiple therapeutic properties have been attributed to Cannabis sativa. However, further research is required to unveil the medicinal potential of Cannabis and the relationship between biological activity and chemical profile.
Objectives: The primary objective of this study was to characterize the chemical profile and antioxidant properties of three varieties of Cannabis sativa available in Uruguay during progressive stages of maturation.
Methods: Fresh samples of female inflorescences from three stable Cannabis sativa phenotypes, collected at different time points during the end of the flowering period were analyzed. Chemical characterization of chloroform extracts was performed by 1H-NMR. The antioxidant properties of the cannabis sativa extracts, and pure cannabinoids, were measured in a Cu2+-induced LDL oxidation assay.
Results: The main cannabinoids in the youngest inflorescences were tetrahydrocannabinolic acid (THC-A, 242 ± 62 mg/g) and tetrahydrocannabinol (THC, 7.3 ± 6.5 mg/g). Cannabinoid levels increased more than twice in two of the mature samples. A third sample showed a lower and constant concentration of THC-A and THC (177 ± 25 and 1 ± 1, respectively). The THC-A/THC rich cannabis extracts increased the latency phase of LDL oxidation by a factor of 1.2-3.5 per μg, and slowed down the propagation phase of lipoperoxidation (IC50 1.7-4.6 μg/mL). Hemp, a cannabidiol (CBD, 198 mg/g) and cannabidiolic acid (CBD-A, 92 mg/g) rich variety, also prevented the formation of conjugated dienes during LDL oxidation. In fact, 1 μg of extract was able to stretch the latency phase 3.7 times and also to significantly reduce the steepness of the propagation phase (IC50 of 8 μg/mL). Synthetic THC lengthened the duration of the lag phase by a factor of 21 per μg, while for the propagation phase showed an IC50 ≤ 1 μg/mL. Conversely, THC-A was unable to improve any parameter. Meanwhile, the presence of 1 μg of pure CBD and CBD-A increased the initial latency phase 4.8 and 9.4 times, respectively, but did not have an effect on the propagation phase.
Conclusion: Cannabis whole extracts acted on both phases of lipid oxidation in copper challenged LDL. Those effects were just partially related with the content of cannabinoids and partially recapitulated by isolated pure cannabinoids. Our results support the potentially beneficial effects of cannabis sativa whole extracts on the initial phase of atherosclerosis.
Keywords: Cannabis sativa; atherosclerosis; hemp; low-density lipoprotein; maturation; oxidation; phytocannabinoids.
Conflict of interest statement
7.4.Competing interests The authors declare no conflicts of interest with the contents of this article.
Figures


Similar articles
-
Copper Stimulation of Tetrahydrocannabinol and Cannabidiol Production in Hemp (Cannabis sativa L.) Is Copper-Type, Dose, and Cultivar Dependent.J Agric Food Chem. 2024 Apr 3;72(13):6921-6930. doi: 10.1021/acs.jafc.3c07819. Epub 2024 Mar 22. J Agric Food Chem. 2024. PMID: 38516700
-
Effects of short-term environmental stresses on the onset of cannabinoid production in young immature flowers of industrial hemp (Cannabis sativa L.).J Cannabis Res. 2022 Jan 4;4(1):1. doi: 10.1186/s42238-021-00111-y. J Cannabis Res. 2022. PMID: 34980266 Free PMC article.
-
Serum cannabidiol, tetrahydrocannabinol (THC), and their native acid derivatives after transdermal application of a low-THC Cannabis sativa extract in beagles.J Vet Pharmacol Ther. 2020 Sep;43(5):508-511. doi: 10.1111/jvp.12896. Epub 2020 Jul 31. J Vet Pharmacol Ther. 2020. PMID: 32735381
-
Portable biosensors for rapid on-site determination of cannabinoids in cannabis, a review.Biotechnol Adv. 2022 Dec;61:108031. doi: 10.1016/j.biotechadv.2022.108031. Epub 2022 Sep 1. Biotechnol Adv. 2022. PMID: 36058440 Review.
-
Cannabis sativa L. and Nonpsychoactive Cannabinoids: Their Chemistry and Role against Oxidative Stress, Inflammation, and Cancer.Biomed Res Int. 2018 Dec 4;2018:1691428. doi: 10.1155/2018/1691428. eCollection 2018. Biomed Res Int. 2018. PMID: 30627539 Free PMC article. Review.
Cited by
-
Decriminalization of marijuana opens doors for some scientists.Nature. 2022 Aug;608(7921):227-228. doi: 10.1038/d41586-022-01761-5. Nature. 2022. PMID: 35922558 No abstract available.
-
Targeting Nrf2 Signaling Pathway in Cancer Prevention and Treatment: The Role of Cannabis Compounds.Antioxidants (Basel). 2023 Nov 28;12(12):2052. doi: 10.3390/antiox12122052. Antioxidants (Basel). 2023. PMID: 38136172 Free PMC article. Review.
-
Cannabinoid CB2 Receptors in Neurodegenerative Proteinopathies: New Insights and Therapeutic Potential.Biomedicines. 2022 Nov 22;10(12):3000. doi: 10.3390/biomedicines10123000. Biomedicines. 2022. PMID: 36551756 Free PMC article. Review.
-
Poly(vinyl alcohol)/Plant Extracts Films: Preparation, Surface Characterization and Antibacterial Studies against Gram Positive and Gram Negative Bacteria.Materials (Basel). 2022 Mar 28;15(7):2493. doi: 10.3390/ma15072493. Materials (Basel). 2022. PMID: 35407829 Free PMC article.
-
Cannabis sativa extracts inhibit LDL oxidation and the formation of foam cells in vitro, acting as potential multi-step inhibitors of atherosclerosis development.PLoS One. 2024 Dec 20;19(12):e0310777. doi: 10.1371/journal.pone.0310777. eCollection 2024. PLoS One. 2024. PMID: 39705234 Free PMC article.
References
-
- Chapman MJ, Goldstein S, Latencyrange D, Laplaud PM. A density gradient ultracentrifugal procedure for the isolation of the major lipoprotein classes from human serum. J Lipid Res. 1981;22:339–358. - PubMed
Grants and funding
LinkOut - more resources
Full Text Sources

