. 2020 Aug;1(8):826-839.
doi: 10.1038/s43018-020-0103-x. Epub 2020 Aug 18.

Integrated analysis of patient samples identifies biomarkers for venetoclax efficacy and combination strategies in acute myeloid leukemia

Affiliations

Integrated analysis of patient samples identifies biomarkers for venetoclax efficacy and combination strategies in acute myeloid leukemia

Haijiao Zhang et al. Nat Cancer. 2020 Aug.

Abstract

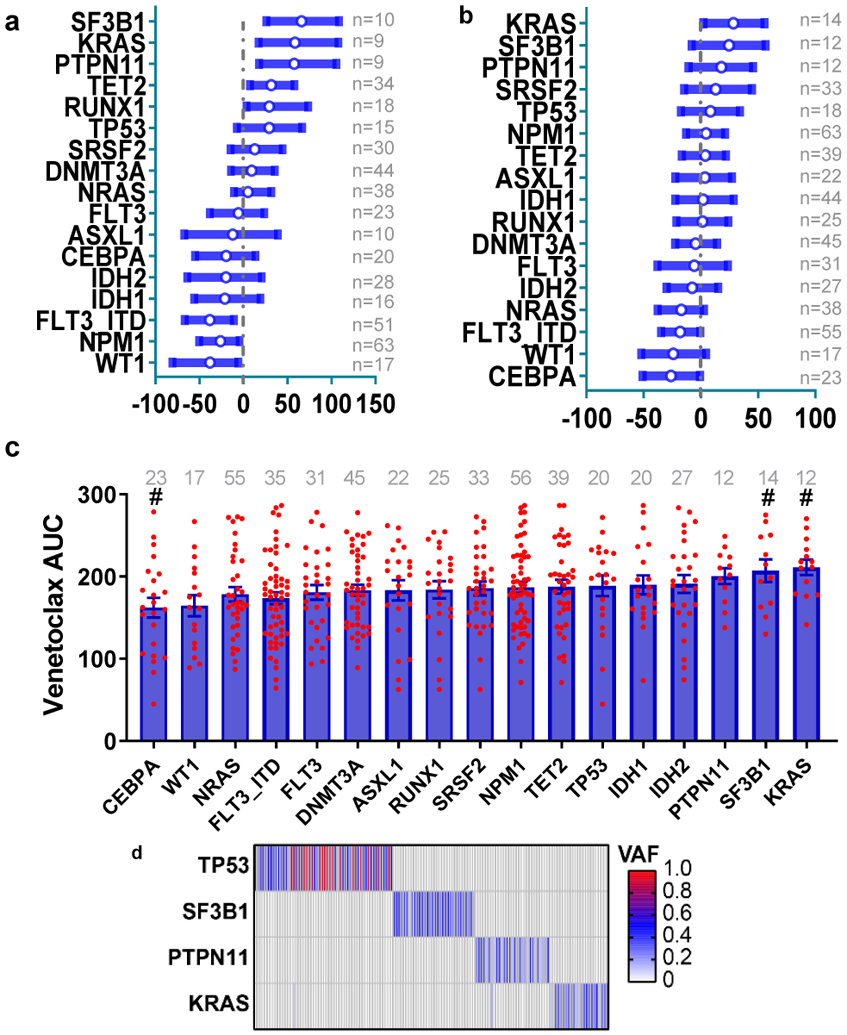
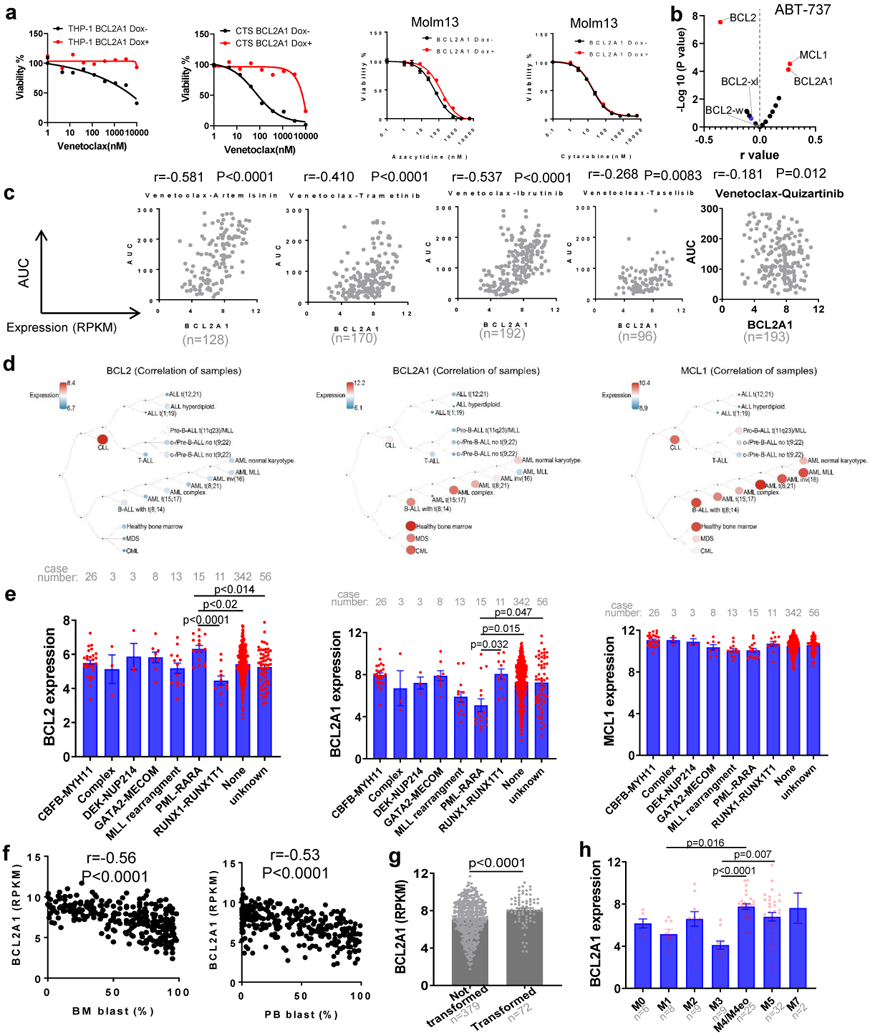
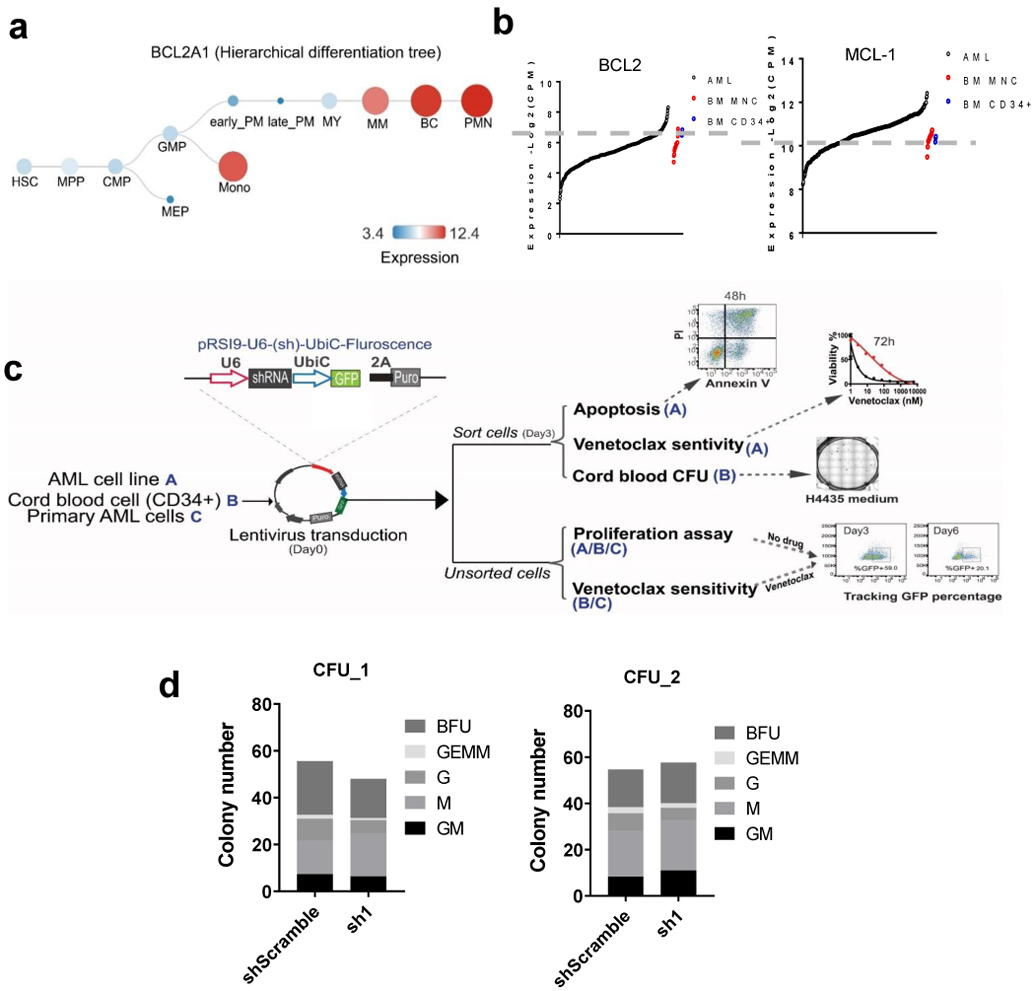
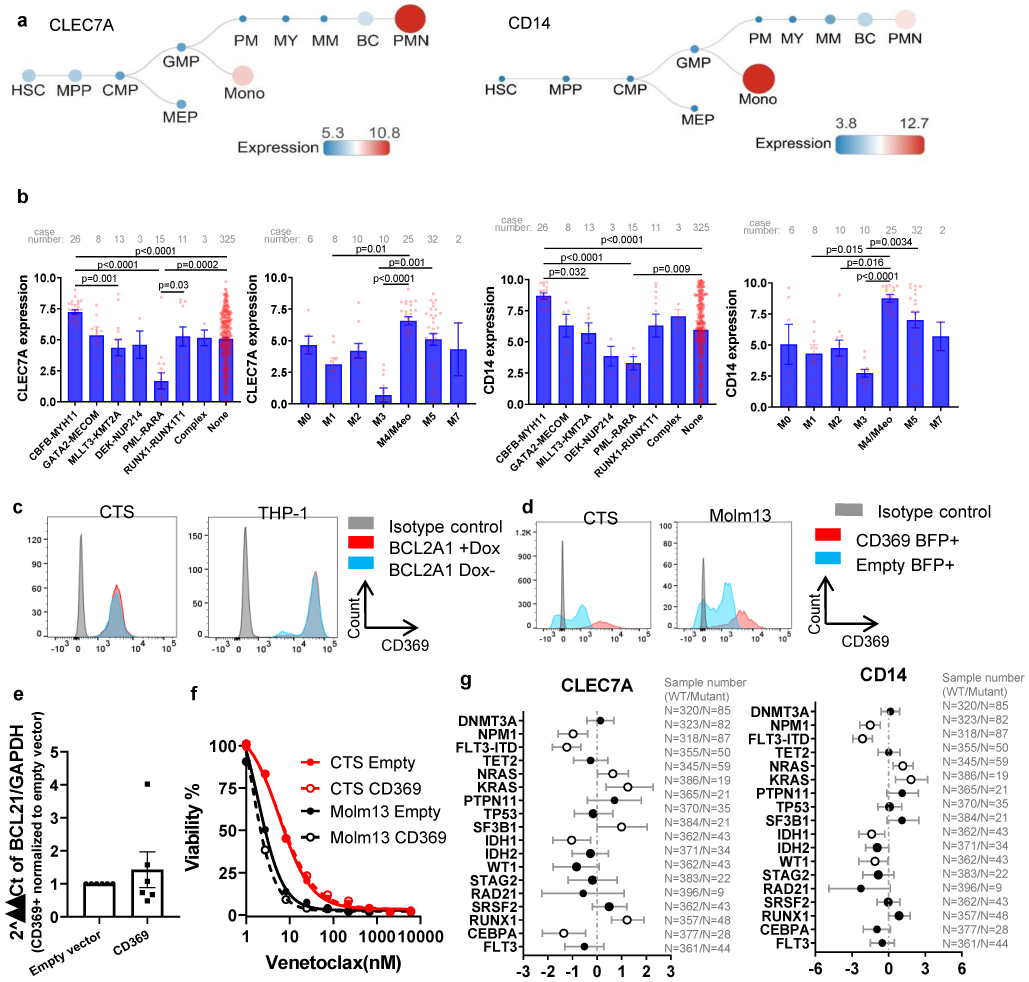
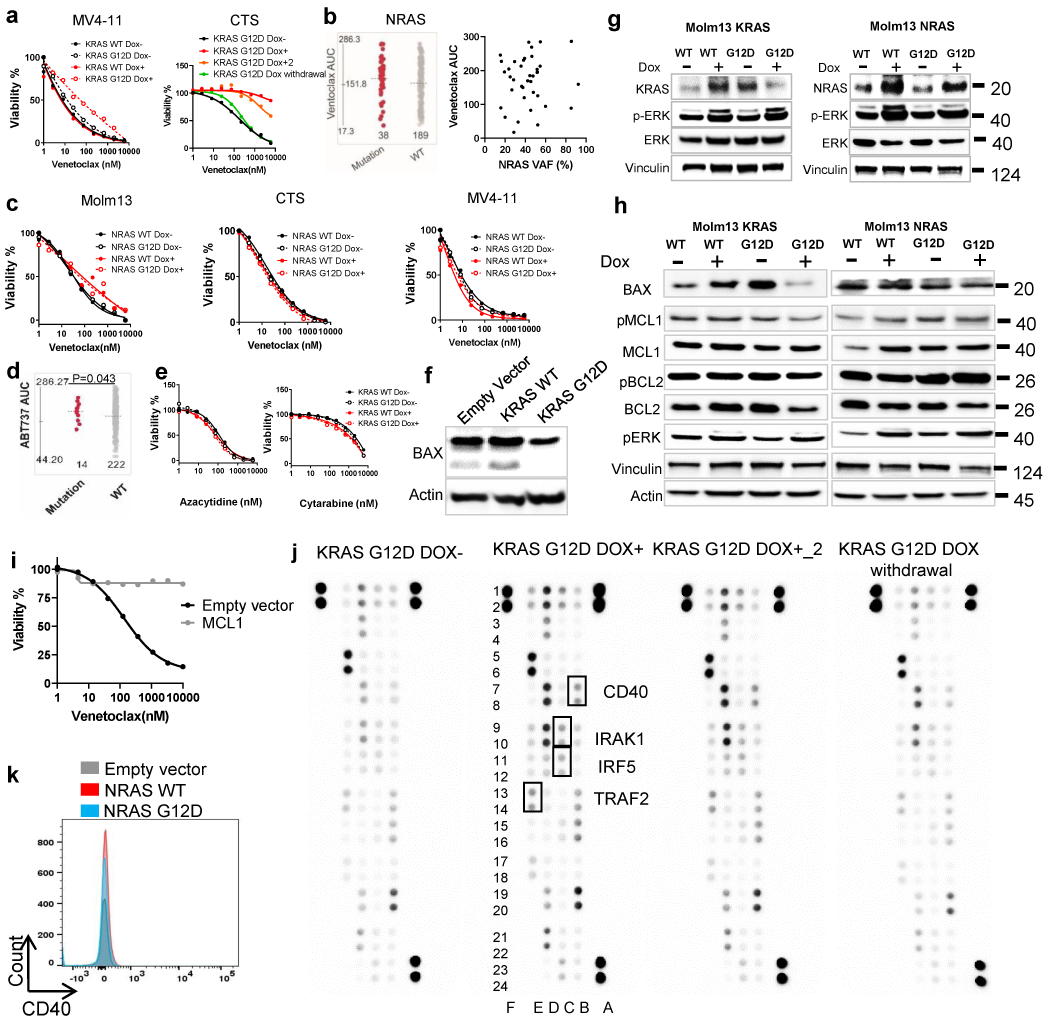
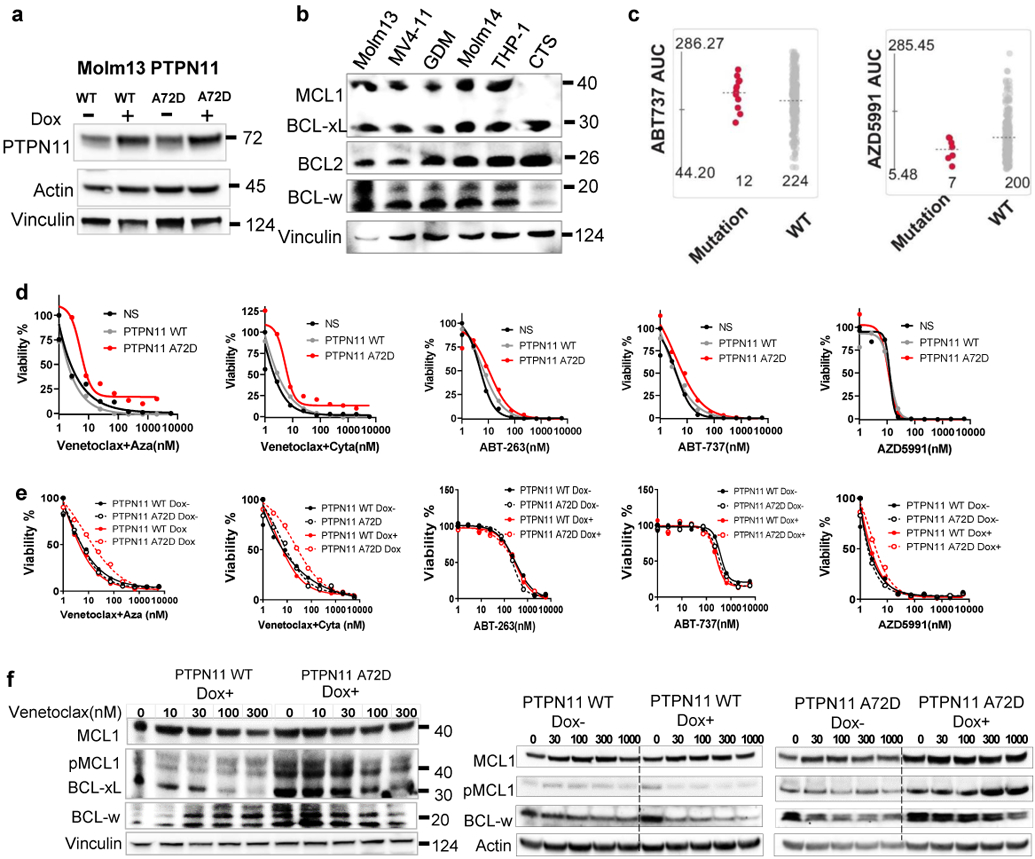
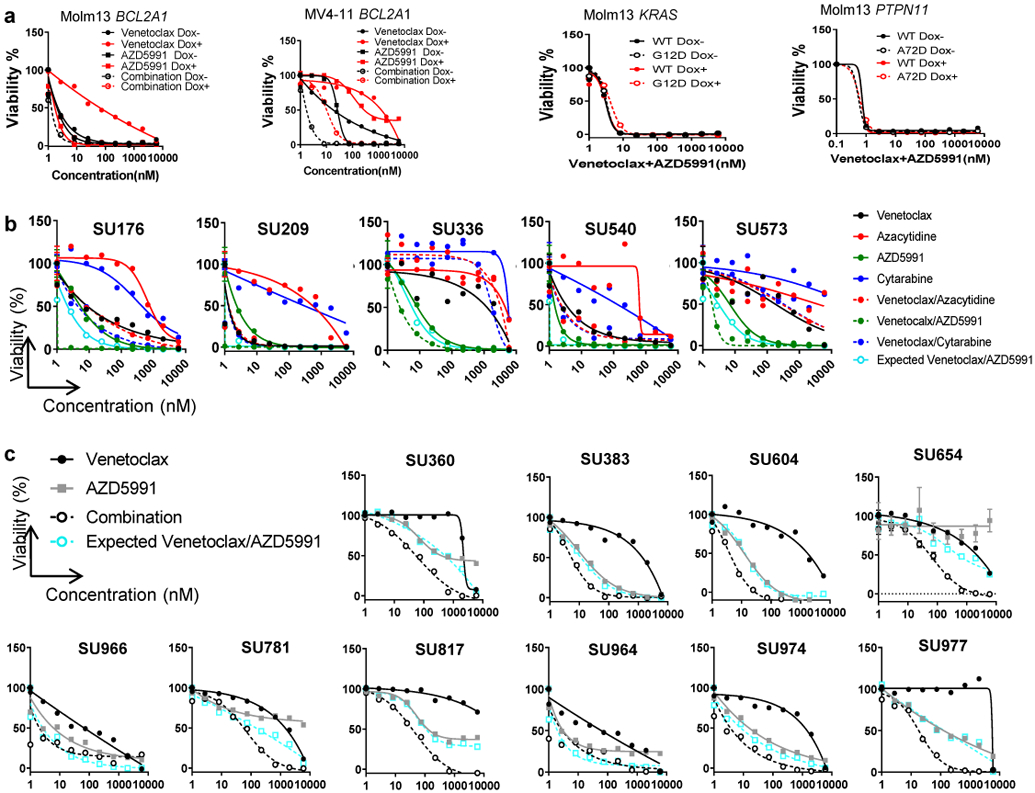
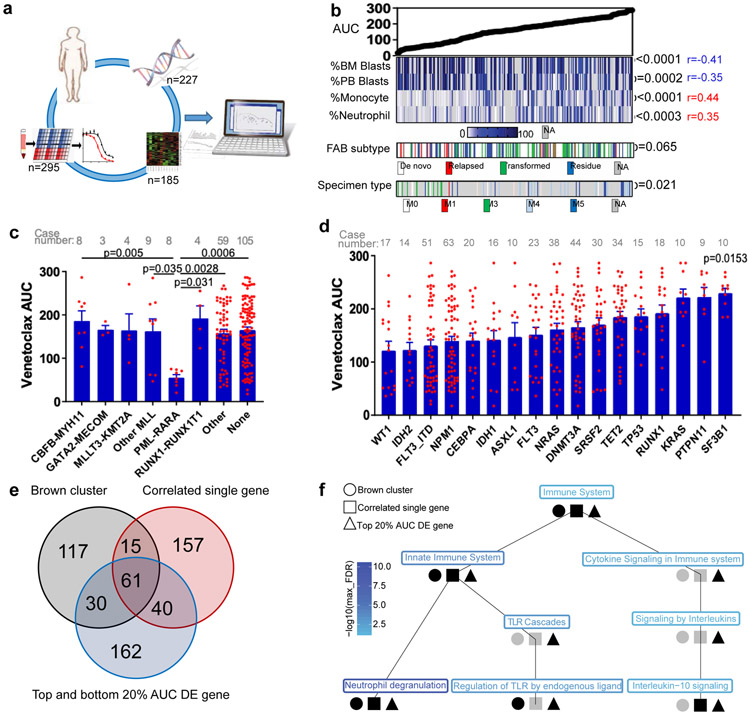
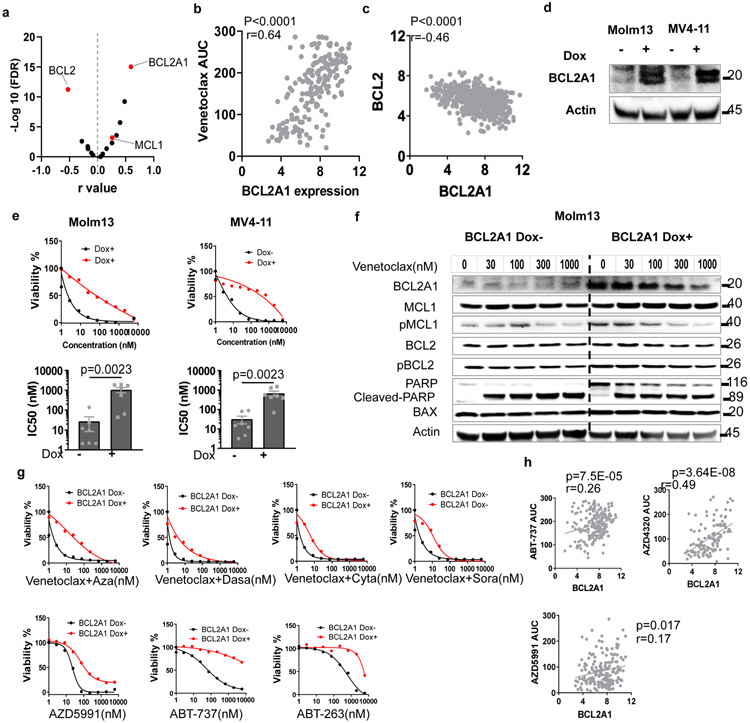
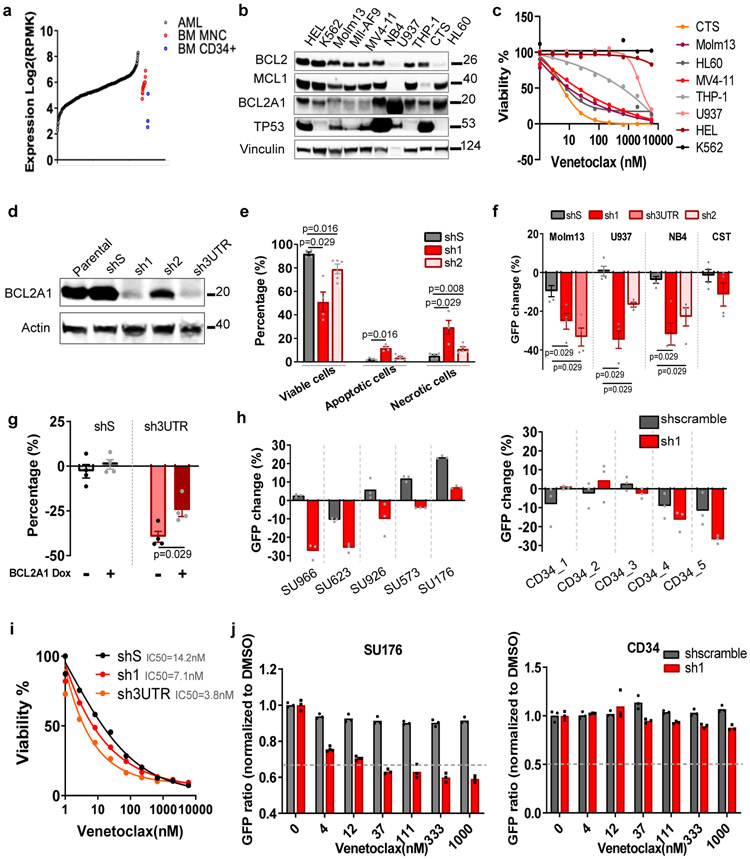
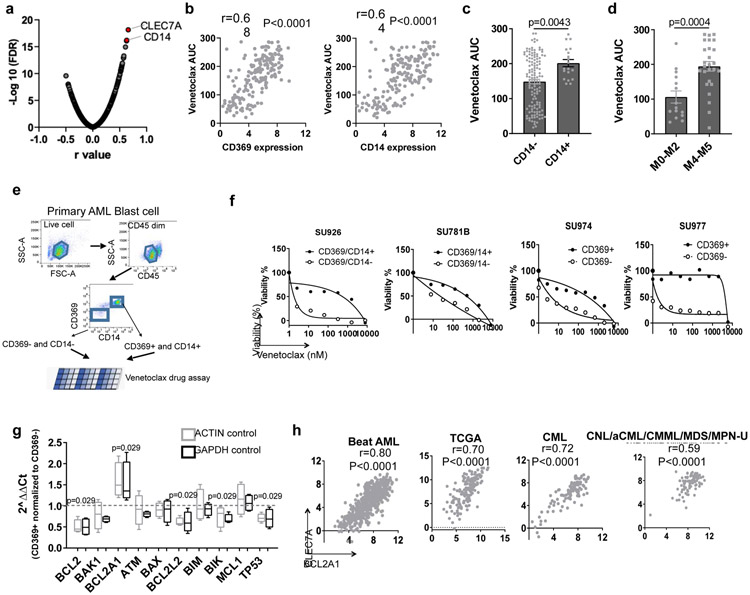
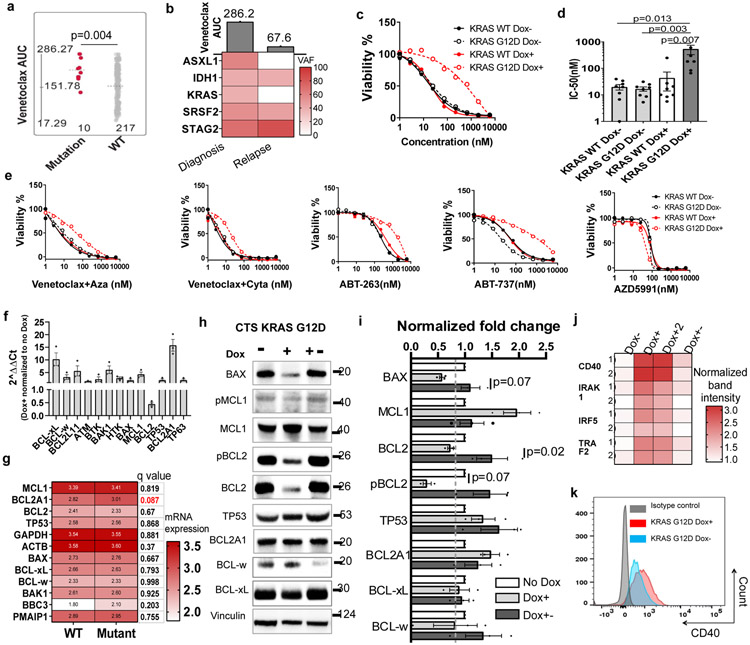
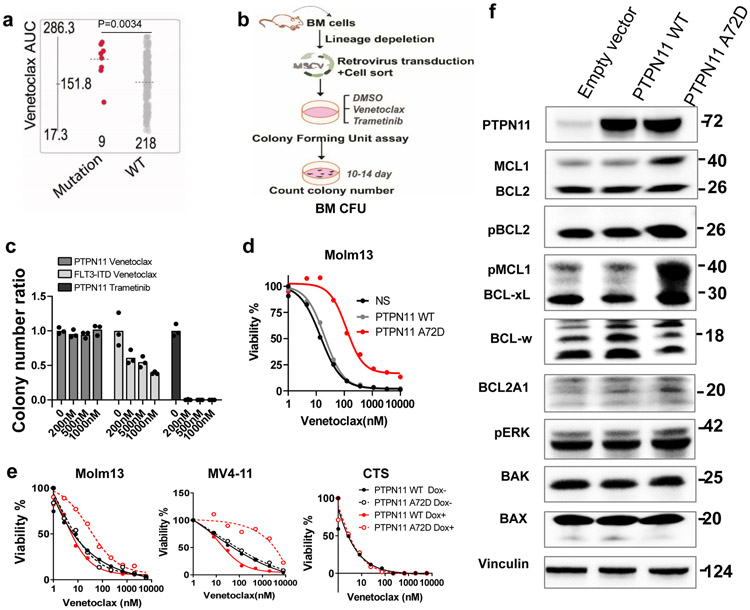
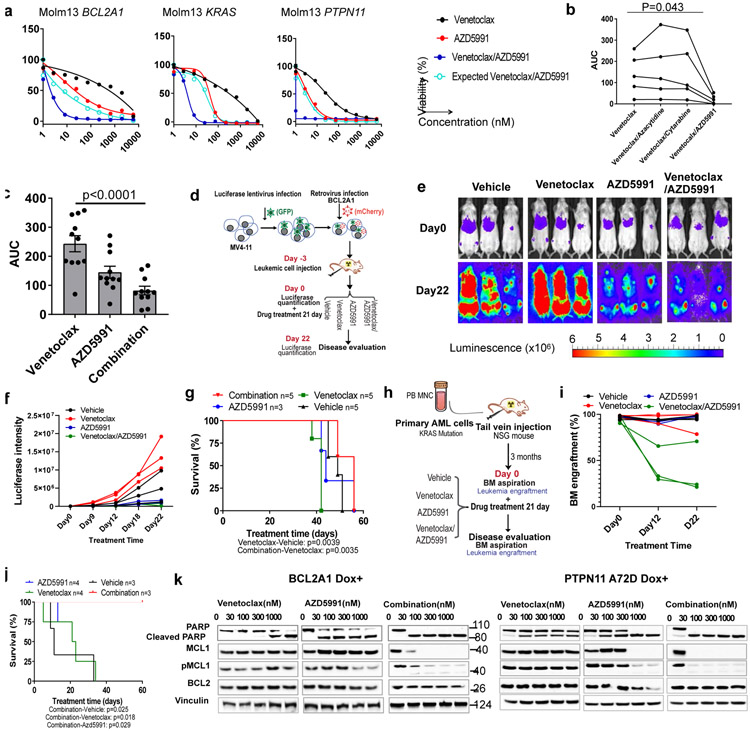
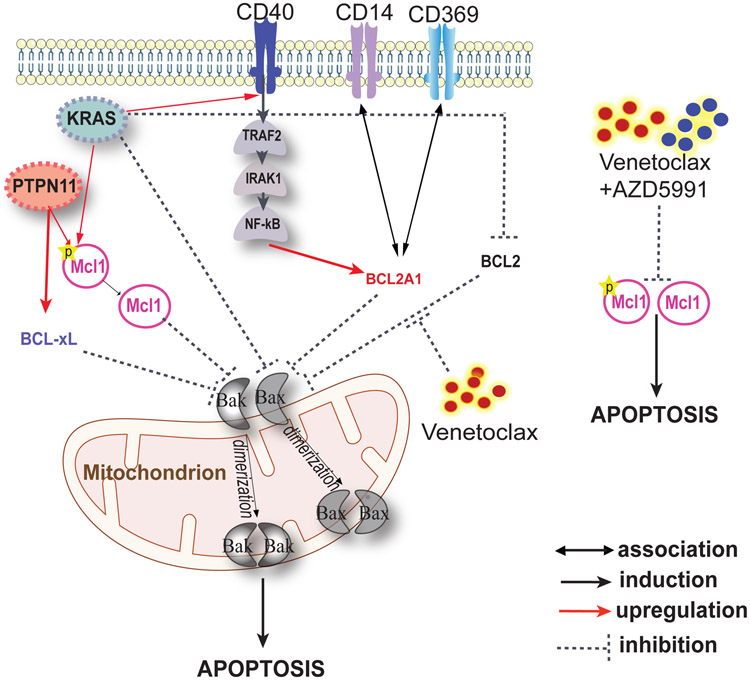
Deregulation of the BCL2 gene family plays an important role in the pathogenesis of acute myeloid leukemia (AML). The BCL2 inhibitor, venetoclax, has received FDA approval for the treatment of AML. However, upfront and acquired drug resistance ensues due, in part, to the clinical and genetic heterogeneity of AML, highlighting the importance of identifying biomarkers to stratify patients onto the most effective therapies. By integrating clinical characteristics, exome and RNA sequencing, and inhibitor data from primary AML patient samples, we determined that myelomonocytic leukemia, upregulation of BCL2A1 and CLEC7A, as well as mutations of PTPN11 and KRAS conferred resistance to venetoclax and multiple venetoclax combinations. Venetoclax in combination with an MCL1 inhibitor AZD5991 induced synthetic lethality and circumvented venetoclax resistance.


Figures

Extended Data Fig. 1
Extended Data Fig. 1. Factors influencing venetoclax and ABT-737 response
a, The graph depicts the 95% CI and Hodges-Lehmann median difference of venetoclax AUC in the presence or absence of mutations in the indicated gene calculated using two tailed Mann-Whitney tests. The case numbers are listed on the right side. b, The graph depicts the 95% CI and Hodges-Lehmann median difference of ABT-737 AUC in the presence or absence of mutations in the indicated gene calculated using two tailed Mann-Whitney tests. c, The ABT-737 AUC was compared among different common AML mutation groups. Briefly, we compared AUCs from all samples harboring each mutation to AUCs from all other samples WT for that mutation. Significance was determined using two tailed Kruskal-Wallis tests, and corrected for multiple comparisons (Bonferroni correction), and expressed as #<0.05 before Bonferroni correction. The case numbers are listed on the top. d, The heatmap depicts distributions of TP53 (N=54 positive samples), SF3B1 (N=32 positive samples), PTPN11 (N=29 positive samples), and KRAS (N=26 positive samples) mutations in the Beat AML cohort (total N=622 samples). Each column displays each patient; each row denotes a specific gene. The mutation variant allelic frequency (VAF) is colored.
Extended Data Fig. 2
Extended Data Fig. 2. Overexpression of BCL2A1 confers resistance to BCL2 family inhibitors and venetoclax
a, The graphs depict cell viabilities (mean from 3 technical replicates) of THP-1, CTS, and Molm13 cells transduced with Dox-inducible BCL2A1 virus in the absence or presence of Dox and indicated inhibitors. The graph is representative of two independent experiments with consistent results. The numerical source data have been provided as Extended Source Data_Extended Data Fig. 2a. b, Data represent −log10(p) values vs. the Pearson r values between ABT-737 AUC and BCL2 family gene expression RPKM levels from 233 AML patient samples, determined by two tailed Pearson correlation coefficient tests and corrected for multiple comparisons using Bonferroni correction. c, Graphs depict the correlation between BCL2A1 gene expression levels and indicated inhibitor AUC (N=186 samples) from the Beat AML patient samples determined by the Pearson correlation coefficient tests. d, Graphs depict the expression of BCL2, BCL2A1, and MCL1 in different hematological malignancies. Graphs are generated by Bloodspot website and the gene expression data are from Microarray Innovations in LEukemia (MILE) study: Stage 1 data (GSE13159). e, The expression of BCL2, BCL2A1, and MCL1 was compared among different chromosome translocation groups. Significance was determined using Kruskal-Wallis tests. f, Graphs depict the correlation between BCL2A1 gene expression levels and BM or PB blast percentage from the Beat AML cohort determined by the Pearson correlation coefficient tests. N refers to number of patient samples. g, Graphs depict the BCL2A1 gene expression levels in transformed or not transformed AML samples from the Beat AML cohort. Significance was determined using two tailed Mann-Whitney tests. N refers to number of patient samples. h, The expression of BCL2A1 was compared among different AML FAB subgroups. Significance was determined using Kruskal-Wallis tests. The numerical source data have been provided as Extended Source Data Extended Data Fig. 2h.
Extended Data Fig. 3
Extended Data Fig. 3. Targeting BCL2A1 has antileukemic effect
a, Graphs depict the expression of BCL2A1 during normal hematopoiesis. Graphs are generated by Bloodspot website: Normal human hematopoiesis (HemaExplorer) and the gene expression data are from GSE17054, GSE19599, GSE11864, and E-MEXP-1242. b, Graphs depict gene expression of BCL2 and MCL1 in leukemia samples (N=453), BM MNC (N=19), and CD34+ HSC controls (N=3) from the Beat AML cohort. c, Schematic diagram of knockdown of BCL2A1 using shRNAs and indicated functional assays. d, Graphs depict the colony numbers (mean from 3 technical replicates) of shS or sh1 transduced cord blood HSPCs cultured in H4435 for 10 days. Data from two cord blood donors are shown. G: granulocyte colony. GM: granulocyte, macrophage. M: monocyte colony. BFU: erythroid burst-forming units. GEMM: granulocyte, erythroid, macrophage, megakaryocyte. The numerical source data have been provided as Extended Source Data_Extended Data Fig. 3d.
Extended Data Fig. 4
Extended Data Fig. 4. Expression of CLEC7A or CD14 predicts venetoclax response
a, Graphs depict the expression of CLEC7A and CD14 during normal hematopoiesis. Graphs are generated from Bloodspot website: Normal human hematopoiesis (HemaExplorer) and the gene expression data are from GSE17054, GSE19599, GSE11864, and E-MEXP-1242. b, Graphs depict the mean ± SEM of CLEC7A and CD14 expression among different FAB and chromosome translocation groups. N refers to number of patient samples. Significance was determined using two tailed Kruskal-Wallis tests. c, FACS histogram plots demonstrated the expression of CD369 on CTS and THP-1 cells expressing Dox inducible BCL2A1 in the presence or absence of Dox. The experiments were performed three times independently with consistent results. d, FACS histogram plots demonstrated the expression of CD369 in CTS and Molm13 cells transduced with lentivirus encoding an empty vector or a CD369 vector. The experiments were performed three times independently with consistent results. e, CTS and Molm13 cells were transduced with lentivirus encoding an empty vector or a CD369 vector. The graph depicts the mean ± SEM (N=3 independent experiments) of 2^ΔΔCt of BCL2A1 in empty vector or CD369 expressing cells. GAPDH was used as a control. Significance was determined using a Mann-Whitney test. P>1. The numerical source data have been provided as Extended Source Data Extended Data Fig. 4e. f, Graph depicts cell viabilities (mean from 3 technical replicates) of CTS and Molm13 cells expressing an empty vector or CD369 in the presence of dose gradients of venetoclax. The graph is representative of two independent experiments. The numerical source data have been provided as Extended Source Data Extended Data Fig. 4f g, The graph depicts the 95% CI and Hodges-Lehmann median difference of CD14 and CLE7A expression in the presence or absence of mutations in the indicated gene calculated using Mann-Whitney tests. N refers to number of patient samples. The numerical source data have been provided as Extended Source Data Extended Data Fig. 4g.
Extended Data Fig. 5
Extended Data Fig. 5. KRAS, but not NRAS mutations confer venetoclax resistance
a, CTS or MV4-11 cells were transduced with Dox-inducible KRAS WT and G12D virus. KRAS G12D transduced cells were cultured in the presence of Dox (for 2 weeks), in the absence of Dox, and/or after 2 weeks of induction followed by Dox withdrawal for 3 weeks. Representative graphs depict cell viabilities (mean from 3 technical replicates) in the presence of dose gradients of venetoclax. The graph for MV4-11 is representative of two independent experiments with consistent results. For CTS, Dox conditions have two biological independently established replicates, whereas no Dox and Dox withdrawal controls were established once. The numerical source data have been provided as Extended Source Data Extended Data Fig. 5a. b, The graph (left) demonstrates similar venetoclax AUCs in AML samples with NRAS mutations (N=38 samples) compared with NRAS WT samples (N=189 samples). Significance was determined using two tailed Mann-Whitney tests. P=0.272. The dot plot (right) depicts the correlation between NRAS mutation variant allelic frequency (VAF) and venetoclax AUC determined by two tailed Pearson correlation (N=38). No significant correlation was observed. c, Representative graphs depict similar cell viabilities (mean from 3 technical replicates) of NRAS WT or G12D transduced cells in the presence of dose gradients of venetoclax. The graph is representative of two independent experiments with consistent results. The numerical source data have been provided as Extended Source Data_Extended Data Fig. 5c d, The graph demonstrates higher ABT-737 AUCs in AML samples with KRAS mutations (N=14 samples) compared with KRAS WT samples (N=222). Significance was determined using two tailed Mann-Whitney tests. e, Representative graphs depict similar cell viabilities (mean from 3 technical replicates) of KRAS WT or G12D transduced cells in the presence of dose gradients of Azacytidine or Cytarabine. The graph is representative of two independent experiments with consistent results. The numerical source data have been provided as Extended Source Data_Extended Data Fig. 5e. f, Molm13 cells were transduced with lentiviral vectors encoding an empty, KRAS WT, or KRAS G12D construct constitutively. Western blot analyses show decreased BAX in KRAS G12D cells. Blots are representative of two independent experiments with consistent results. g, Western blot analyses showing pERK activation in NRAS or KRAS WT and mutant transduced cells. Blots are representative of two independent experiments with consistent results. The image source data have been provided as Source Data Extended Data Fig. 5. h, Western blot analyses showing decreased BAX and BCL2 in KRAS mutant, but not KRAS WT, NRAS WT, or NRAS mutant transduced cells. Blots are representative of two independent experiments with consistent results. i, The graph depicts cell viabilities (mean from 3 technical replicates) of Molm13 cells expressing MCL1 or an empty control vector in the presence of dose gradients of venetoclax. The graphs are representative of two independent experiments with consistent results. The numerical source data have been provided as Extended Source Data_Extended Data Fig. 5i j, The inducible KRAS G12D transduced cells were cultured in the presence of Dox (for 2 weeks), in the absence of Dox, or after 2 weeks of induction followed by Dox withdrawal for three weeks. Cell lysates were extracted and subjected to an NFkB pathway proteome array according to the manufacturer’s instructions. Immunoblot depicts 41 human proteins and 4 serine or tyrosine phosphorylation sites in duplicate. For CTS, Dox conditions have two biological independently established replicates, whereas no Dox and Dox withdrawal controls were established once. The image source data have been provided as Source Data Extended Data Fig. 5. k, Representative flow cytometry overlayed histograms showing no change of CD40 expression in NRAS WT and G12D cells. The graph is representative of two independent experiments with consistent results.
Extended Data Fig. 6
Extended Data Fig. 6. PTPN11 mutations confer venetoclax resistance
a, Representative immunoblots depict induction of PTPN11 expression in cells transduced with inducible PTPN11 WT and A72D in the presence of Dox for 72 hours. The experiments were conducted twice independently with consistent results. b, The immunoblot shows the expression of BCL2 family pro-survival proteins in different leukemia cell lines. Blots are representative of two independent experiments with consistent results. c, The graphs demonstrate ABT-737 and AZD5991 AUCs in AML samples harboring PTPN11 mutations (N=12 and 7 samples for ABT-737 and AZD5991, respectively) compared to samples without PTPN11 mutations (N=224 and 200 samples for ABT-737 and AZD5991, respectively). d-e, Representative graphs depict the viabilities (mean from 3 technical replicates) of Molm13 cells expressing PTPN11 WT or A72D in the presence or absence of Dox and dose gradients of indicated drugs The upper panel d, is the constitutive transduction system, and the bottom e, is the Dox inducible transduction system. The constitutive transduction system experiment was conducted once. The Dox inducible transduction experiment was performed twice independently with consistent results. The numerical source data have been provided as Extended Source Data_ Extended Data Fig. 6d,e. f, Western blot images showing sustained pMCL1,BCL-xL and BCL-w expression of PTPN11 A72D expressing cells in a constitutive expression system (left) or a inducible expression system (right), when treated with venetoclax. Blots are representative of two independent experiments with consistent results. The image source data for Extended Data Fig. 6f has been provided as Source Data Extended Data Fig. 6.
Extended Data Fig. 7
Extended Data Fig. 7. Venetoclax and AZD5991 combination overcomes venetoclax resistance
a, Graphs depict the cell viabilities (mean from 3 technical replicates) of indicated cells in the absence or presence of Dox and dose gradients of venetoclax, AZD5991, and the two drugs in combination. The graphs are representative of two independent experiments with consistent results. The numerical source data have been provided as Source Data_Figure 7a_Extended data Fig.7a b, Graphs depict cell viabilities viabilities (mean from 3 technical replicates) of 5 different primary leukemia samples treated with indicated inhibitors. Available samples were used from adult patients with myeloid malignancies from both genders and all age groups. EOB was used to calculate the expected effect of the combination. The numerical source data have been provided as Source Data_Figure 7b_Extended Data Fig.7b. c, Graphs depict cell viabilities viabilities (mean from 3 technical replicates) in 10 primary leukemia samples treated with indicated inhibitors. Available samples were used from adult patients (different from b) with myeloid malignancies from both genders and all age groups. EOB was used to calculate the expected effect of the combination. Source data for Extended Data Fig. 7c have been provided as Extended Source Data_Extended Data Fig. 7c.
Figure 1.
Figure 1.. Identification of molecular markers for venetoclax resistance
a, Schematic of integrating patient clinical, demographic, WES, RNAseq, and venetoclax in vitro screening assay data to identify biomarkers predicting venetoclax response. b, Venetoclax AUC from primary AML patient samples (N=297 samples) was compared among a multitude of clinical characteristics (Supplementary Table 1). Significance was determined using either two tailed Mann-Whitney or Kruskal-Wallis tests (for categorical variables) or two tailed Pearson correlations (for continuous variables), and corrected for multiple comparisons (Bonferroni correction). The numerical source data have been provided as Source Data_Figure 1b. c, The graph depict mean ± SEM of venetoclax AUC among different chromosome translocation groups. The presence/absence of translocations was determined from karyotype. Only translocations that were found in ≥3 patients were considered. Significance was determined using a Kruskal-Wallis test. The numerical source data have been provided as Source Data_Figure 1c. d, The graph depicts mean ± SEM of venetoclax AUCs among common AML mutation groups. Briefly, we compared AUCs from all samples harboring each mutation to AUCs from all other samples WT for that mutation. Mutation data were collected by either targeted sequencing, whole-exome sequencing, or targeted polymerase chain reaction (PCR)-based methods (FLT3-ITD and NPM1). Significance was determined using two tailed Mann-Whitney tests and corrected for multiple comparisons (Bonferroni correction). The numerical source data have been provided as Source Data_Figure 1d. e, Venn diagrams depict distribution and overlap of the three gene lists: WGCNA brown gene expression cluster, most correlated single genes (single genes correlated with venetoclax AUC with r>=0.5 or r<=0.5 and FDR <0.05), and top 20% DE genes (the most differentially expressed genes between the top 20% and the bottom 20% venetoclax AUC samples) (N=180 samples). For the single-gene correlations, two tailed student's t-tests were used testing whether the slope of the regression line (auc~gene_expression) was different than zero. FDR correction was used for multiple comparison adjustments. For the top 20% and the bottom 20% AUC DE analyses, two tailed student's t-tests were computed testing for significance for the ‘top 20%’ – ‘bottom 20%’ (resistant - sensitive) expression log2 fold changes. The resulting p-values were FDR corrected per inhibitor. We did not perform a familywise error correction. Venn diagrams were generated using an online tool: http://bioinformatics.psb.ugent.be/webtools/Venn/. DE: differentially expressed. The numerical source data have been provided as Source Data_Figure 1e. f, The graph shown is the Reactome pathway hierarchy containing all pathways significant in at least 1 of the 3 analyses (WGCNA brown gene expression cluster; single genes correlated with venetoclax AUC with r>=0.5 or r<=0.5; and the most DE genes between the top 20% and the bottom 20% AUC samples (N=180 samples)). All pathways were assessed for significance at the FDR <0.05 level based on an over-representation analysis using the hypergeometric distribution and Benjamani-Hochberg adjustment. Black indicates the pathway was significant at FDR <0.05 and grey indicates otherwise. The pathway names are colored by the level of significance with blue being the most significant and light blue being least significant in terms of the maximum of the significant FDR for the three analyses.
Figure 2.
Figure 2.. Overexpression of BCL2A1 confers resistance to BCL2 family inhibitors and venetoclax combinations
a, Data represent −log10(FDR) values vs. the Pearson r values between venetoclax AUC and BCL2 family gene expression levels from 180 AML patient samples, determined by the two tailed Pearson correlation coefficients. Two tailed student's t-tests were used testing whether the slope of the regression line (auc~gene_expression) was different than zero and adjusted for multiple comparisons using FDR correction. The numerical source data have been provided as Source Data_Figure 2a. b, Correlation between BCL2A1 gene expression levels and venetoclax AUC (N=180 samples) from Beat AML patient samples determined by a two tailed Pearson correlation coefficient. The numerical source data have been provided as Source Data_Figure 2b. c, Correlation between BCL2A1 and BCL2 gene expression levels from Beat AML patient samples (N=601 samples) determined by a two tailed Pearson correlation coefficient. The numerical source data have been provided as Source Data_Figure 2c. d, Western blot showing overexpression of BCL2A1 from Molm13 and MV4-11 cells transduced with Dox-inducible BCL2A1 virus in the presence of Dox. Actin was used as a control. The blot shown is representative of two independent experiments with consistent results. The image source data have been provided as Source Data Fig. 2. e, Representative graphs depict higher viabilities (mean from 3 technical replicates) of Molm13 and MV4-11 cells transduced with Dox-inducible BCL2A1 virus in the presence of Dox and dose gradients of venetoclax (top). Bar graphs depict higher mean ± SEM of venetoclax IC50 (N=7 independently repeated experiments) of Molm13 and MV4-11 cells transduced with Dox-inducible BCL2A1 virus in the presence of Dox (bottom). Significance was determined using two tailed Mann-Whitney tests. f, Western blot analysis of BCL2 family proteins and full-length/cleaved PARP of Molm13 cells transduced with Dox-inducible BCL2A1 virus in the absence or presence of Dox and dose gradients of venetoclax for 16 hours (h). Actin was used as a control. Blots shown are representative of two independent experiments with consistent results. The image source data have been provided as Source Data Fig. 5. g, Graphs depict the viabilities (mean from 3 technical replicates) of Molm13 and MV4-11 cells transduced with Dox-inducible BCL2A1 virus in the absence or presence of Dox and indicated venetoclax combination and other BCL2 inhibitors. Graphs shown are representative of two independent experiments. Aza: azacytadine; Dasa: dasatinib; Cyta: cytarabine; and Sora: sorafenib. The numerical source data have been provided as Source Data_Figure 2g. h, Graphs depict the correlation between BCL2A1 gene expression levels ABT-737 (N=209 samples), AZD4320 (N=119 samples), or AZD5991 from AML patient samples (N=178 samples) determined by two tailed Pearson correlation coefficient tests. The numerical source data have been provided as Source Data_Figure 2h.
Figure 3.
Figure 3.. Targeting BCL2A1 induces apoptosis, inhibits cell growth, and synergizes with venetoclax
a, BCL2A1 expression in 453 primary AML samples, 3 BM CD34+ HSPCs, and 19 BM MNC controls. b, Western blot analyses of BCL2 family proteins in AML cell lines. Vinculin was used as a control. The experiment was conducted twice independently with similar results. The image source data have been provided as Source Data Fig. 3. c, The graph depicts cell viabilities (mean from 3 technical replicates) of AML cell lines in the presence of dose gradients of venetoclax. The graph is representative of two independent experiments with consistent results. The numerical source data have been provided as Source Data_Figure 3c. d, Western blot analysis of BCL2A1 expression of U937 cells transduced with control shS or shRNA targeting BCL2A1 (sh1, sh2, and sh3UTR). Actin was used as a control. The experiment was conducted twice independently with similar results. The image source data have been provided as Source Data Fig. 5. e, The graph depicts mean ± SEM of percentages of viable (Annexin V−/PI−), apoptotic (Annexin V+/PI−), and necrotic cells (Annexin V+/PI+) of U937 cells transduced with shS, sh1, and sh2 48h after FACS sorting as assessed by flow cytometry (five independent experiments). Significance was determined using two tailed Mann-Whitney tests comparing to the respective shS control. f, The graph depicts the mean ± SEM of percentage changes of indicated double transduced cells (GFP+) after 72h cell culture (N=15 independent experiments). Significance was determined using two tailed Mann-Whitney tests, comparing to the respective shS control. g, The graph depicts the mean ± SEM of percentage changes (N=4 independent experiments) of shS or sh3UTR transduced (GFP+) U937 cells expressing Dox-inducible BCL2A1 construct in the presence or absence of Dox after 72h of cell culture. Significance was determined using two tailed Mann-Whitney tests comparing to the respective Dox− control. h, The graph depicts percentage changes (N=3 cell culture technical replicates) of shS and sh1 transduced (GFP+) primary AML cells (left) and CD34+ cord blood HSPCs (right). The numerical source data have been provided as Source Data_Figure 3h. i, The graph depicts the mean ± SEM of cell viabilities (N=3 technical cell culture replicates) of Molm13 cells transduced with shS, sh1, and Sh3UTR in the presence of dose gradients of venetoclax. The graph is representative of two independent experiments with consistent results. The numerical source data have been provided as Source Data_Figure 3i. j, The graph depicts GFP ratios (normalized to non-transduced cells, N=3 technical cell culture replicates) of shS and sh1 transduced (GFP+) primary AML cells (left) and CD34+ cord blood HSPCs (right) in the presence of concentration gradients of venetoclax. The numerical source data have been provided as Source Data_Figure 3j.
Figure 4.
Figure 4.. Expression of CLEC7A or CD14 predicts venetoclax sensitivity
a, Data represent −log10(FDR) values vs. the Pearson r values between venetoclax AUC and gene expression levels of cell surface GO term genes from 180 AML patient samples, determined by a two tailed Pearson correlation coefficient test. The list of cell surface proteins is provided as Source Data_Figure 4a. b, Correlation between CLEC7A and CD14 gene expression levels and venetoclax AUC (N=180 samples) from AML patient samples determined by two tailed Pearson correlation coefficient tests. c, The graph depicts the mean ± SEM of venetoclax AUCs of primary AML patient samples categorized based on the presence (N=19 samples) or absence of CD14 (N=131 samples) expression detected by clinical flow cytometry. Significance was determined using a two tailed Mann-Whitney test. d, The graph depicts the mean ± SEM of venetoclax AUCs of primary AML patient samples in the non-M4/M5 (N=15 samples) and M4/M5 (N=26 samples) groups for those samples with clinical annotation. Significance was determined using a two tailed Mann-Whitney test. e, Schematic diagram of isolating CD369 and/or CD14 positive and negative primary AML blasts and performing venetoclax sensitivity assay. f, Graphs depict cell viabilities (mean from 3 technical replicates) of CD369/CD14+ or CD369/CD14− primary leukemia blast cells in the presence of dose gradients of venetoclax from 4 different leukemia patients’ samples. The numerical source data have been provided as Source Data_Figure 4f. g, The box plot depicts the 5-95 percentile of 2^ΔΔCt of indicated apoptosis-related genes between CD369 and/or CD14 positive and negative primary AML blasts (N=4 biologically independent experiments). ACTIN and GAPDH were used as controls. Significance was determined using two tailed Mann-Whitney tests. The numerical source data have been provided as Source Data_Figure 4g. h, Graphs depict positive correlations between CLEC7A and BCL2A1 gene expression of primary patient samples from the Beat AML (N=601 samples), TCGA AML (N=173 samples), CML (N=102 samples), and CNL/aCML/CMML/MDS/MPN-U (N=94 samples) cohorts determined by two tailed Pearson correlation coefficient tests. The numerical source data have been provided as Source Data_Figure 4h.
Figure 5.
Figure 5.. KRAS mutations confer venetoclax resistance
a, The graph demonstrates higher venetoclax AUCs in AML samples harboring KRAS mutations (N=10 samples) compared to samples without KRAS mutations (N=217 samples). Significance was determined using a two tailed Mann-Whitney test. Slashed line indicates the mean of the group. b, The graph summarizes the change of mutation VAF and venetoclax AUC from an AML patient at diagnosis and disease relapse. c, Representative graphs depict cell viabilities (mean from 3 technical replicates) of Molm13 transduced with Dox-inducible KRAS WT and G12D virus in the absence or presence of Dox and dose gradients of venetoclax. The experiment was performed 8 times independently with consistent results. The numerical source data have been provided as Source Data_Figure 5c. d, The graph depicts the mean ± SEM of IC50 (N=8 biological independently repeated experiments) of Molm13 cells expressing Dox-inducible KRAS WT and G12D virus in the absence or presence of Dox. Significance was determined using a Kruskal-Wallis test. The numerical source data have been provided as Source Data_Figure 5d. e, Graphs depict cell viabilities (mean from 3 technical replicates) of Molm13 transduced with Dox-inducible KRAS WT and G12D virus in the absence or presence of Dox and dose gradients of venetoclax combinations and other BCL2 family inhibitors. The graph is representative of two independent experiments. Aza: azacytidine; Cyta: cytarabine. The numerical source data have been provided as Source Data_Figure 5e. f, Graphs depict 2^ ΔΔCt of indicated apoptosis-related genes of KRAS G12D expressing cells in the presence of Dox normalized to cells cultured in the absence of Dox (N=4 independent experiments). HPRT was used as a control. Significance was determined using two tailed Mann-Whitney tests. The numerical source data have been provided as Source Data_Figure 5f. g, The graph depicts the mean log2 expression of the listed gene in samples in KRAS mutant (N=25 samples) and WT (N=597 samples) group. RNAseq analysis from the BeatAML cohort exported from cBioPortal (https://www.cbioportal.org/). Two tailed student's t-tests were performed and corrected Benjamini-Hochberg procedure. Please find more information at cBioPortal website. h, Western blot analyses of BCL2 family proteins extracted from Molm13 cells transduced with Dox-inducible KRAS G12D virus in the absence of Dox, presence of Dox, or after Dox withdrawal for more than 3 weeks. The graph is representative of three independent experiments with similar results. The image source data have been provided as Source Data Fig. 5. i, The graph depicts the mean ± SEM of western blot band intensities quantified using ImageJ software. The bar graph depicts normalized fold changes of the band intensity of BCL2 family proteins extracted from inducible KRAS G12D expressing cells in the presence of Dox normalized to cells cultured without Dox. Significance was determined using two tailed Mann-Whitney tests from three independent experiments. j, The graph summarizes the dot intensities from the NFkB pathway proteome array blot quantified using ImageJ Figi software. Each antibody is spotted in duplicate. Dox conditions have two biological independently established replicates. No Dox and Dox withdrawal controls were established once. Image source data have been provided as Extended Data Fig. 5j. k, Representative flow cytometry overlayed histograms showing increased CD40 expression in KRAS G12D cells in the presence of Dox. The graph is representative of two independent experiments with consistent results.
Figure 6.
Figure 6.. PTPN11 mutations confer venetoclax resistance
a, The graph demonstrates higher venetoclax AUCs in AML samples with PTPN11 mutations (N=9 samples) compared with PTPN11 WT samples (N=218 samples). Significance was determined using a two tailed Mann-Whitney test. The slashed line indicates the mean of the group. b, Schematic illustrates BM CFU assay. c, The graph depicts the normalized colony number ratios (N=3 technical cell culture replicates) of PTPN11 A72D transduced BM HSPCs treated with gradient concentrations of venetoclax or trametinib. The graph is representative of two independent experiments with similar results. The numerical source data have been provided as Source Data_Figure 6c. d, Representative graphs depict viabilities (mean from 3 technical replicates) of Molm13 transduced with lentivirus encoding an empty vector, PTPN11 WT, or A72D constitutively. The graph is representative of two independent experiments with consistent results. The numerical source data have been provided as Source Data_Figure 6d. e, Representative graphs depict cell viabilities (mean from 3 technical replicates) of Molm13, MV4-11, and CTS cells transduced with Dox-inducible PTPN11 WT and A72D virus in the absence or presence of Dox and dose gradients of venetoclax. The graph is representative of two independent experiments. The numerical source data have been provided as Source Data_Figure 6e. f, Western blot analyses of BCL2 family proteins extracted from Molm13 cells expressing an empty vector, PTPN11 WT, or PTPN11 A72D constitutively. Actin was used as a control. Blots are representative of three independent experiments. The image source data have been provided as Source Data Fig. 6.
Figure 7.
Figure 7.. Venetoclax and AZD5991 in combination treatment overcomes venetoclax resistance
a, Graphs depict cell viabilities (mean from 3 technical replicates) of BCL2A1, KRAS G12D, and PTPN11 A72D transduced cells treated with indicated inhibitors in the presence of Dox. EOB was used to calculate the expected effect of the combination. The graphs are representative of two independent experiments with similar results. EOB; Excess over Bliss. The numerical source data have been provided as Source Data_ Figure 7a_Extended data Fig.7a b, The graph depicts the AUCs of the indicated drug from 5 primary AML samples. Available samples were used from adult patients with myeloid malignancies from both genders and all age groups. Significance was assessed using a matched one way ANOVA (Friedman test). The numerical source data have been provided as Source Data_ Figure 7b_Extended Data Fig.7b. c, The graph depicts the mean ± SEM of drug AUCs of venetoclax, AZD5991, and two drugs in combination from 10 primary AML samples. Available samples were used from adult patients with myeloid malignancies from both genders and all age groups. Significance was assessed using a two tailed Kruskal-Wallis test. d, Schematic illustrates the in vivo model of BCL2A1 mediated venetoclax resistance (MV4-11 cells overexpressing BCL2A1). e, Serial bioluminescence images of MV4-11 BCL2A1 overexpression-engrafted NSG mice during treatment. The experiment was performed once. f, The graph depicts luciferase intensity (average radiance (p/s/cm2/sr), N=3 mice) of MV4-11 cells expressing BCL2A1 in the presence of indicated treatment. The experiment was performed once. The numerical source data have been provided as Source Data_Figure 7f. g, Survival curves of 7-week old female NSG mice transplanted with BCL2A1 and luciferase-GFP treated with indicated drugs. The experiment was performed once. The numerical source data have been provided as Source Data_Figure 7g. h, Schematic outline of the mouse model of KRAS mutation mediated venetoclax resistance (primary AML cell). i, The graph depicts BM engraftment (N=3 mice) of SU176 patient AML cells in 7-week old female NSG mice before and during treatment. The experiment was performed once. The numerical source data have been provided as Source Data_Figure 7i. j, Survival curves of mice transplanted with blasts from SU176 leukemia sample harboring a KRAS G12D mutation treated with indicated drugs. N refers to the number of mice. The numerical source data have been provided as Source Data_Figure 7j. k, Western blot analyses of BCL2 family proteins of Molm13 cells expressing BCL2A1 (left) and PTPN11 A72D (right) in the presence of Dox-treated with dose gradients of venetoclax, AZD5991, and the two drugs in combination for 16h. Blots are representative of two independent experiments. The image source data have been provided as Source Data Fig. 7.
Figure 8.
Figure 8.. Schematic illustrates phenotypic markers and mechanisms associated with venetoclax resistance.
High expression of BCL2A1 confers venetoclax resistance. High expression of cell surface marker CD369 and CD14 confers venetoclax resistance, potentially through correlation with high BCL2A1 expression. KRAS mutations are resistant to venetoclax through downregulating BCL2 and BAX, as well as upregulating BCL2A1, MCL1, and CD40. PTPN11 mutations confer venetoclax resistance through upregulation of MCL1 and BCL-xL. Venetoclax in combination with AZD5991 demonstrates robust efficacy and synergy by eliminating MCL1 and pMCL.

References

    1. Papaemmanuil E et al. Genomic Classification and Prognosis in Acute Myeloid Leukemia. N. Engl. J. Med 374, 2209–2221 (2016). - PMC - PubMed
    1. Patel JP et al. Prognostic Relevance of Integrated Genetic Profiling in Acute Myeloid Leukemia. N. Engl. J. Med (2012). doi: 10.1056/NEJMoa1112304 - DOI - PMC - PubMed
    1. Ley TJ et al. Genomic and epigenomic landscapes of adult de novo acute myeloid leukemia. N. Engl. J. Med 368, 2059–74 (2013). - PMC - PubMed
    1. DiNardo CD et al. Clinical experience with the BCL2-inhibitor venetoclax in combination therapy for relapsed and refractory acute myeloid leukemia and related myeloid malignancies. Am. J. Hematol (2018). doi: 10.1002/ajh.25000 - DOI - PubMed
    1. Wei A et al. Phase 1/2 Study of Venetoclax with Low-Dose Cytarabine in Treatment-Naive, Elderly Patients with Acute Myeloid Leukemia Unfit for Intensive Chemotherapy: 1-Year Outcomes. Blood (2017).

Publication types