. 2020 Oct 30;22(12 Suppl 2):iv1-iv96.
doi: 10.1093/neuonc/noaa200.

CBTRUS Statistical Report: Primary Brain and Other Central Nervous System Tumors Diagnosed in the United States in 2013-2017

Affiliations

CBTRUS Statistical Report: Primary Brain and Other Central Nervous System Tumors Diagnosed in the United States in 2013-2017

Quinn T Ostrom et al. Neuro Oncol. .

Erratum in

Abstract

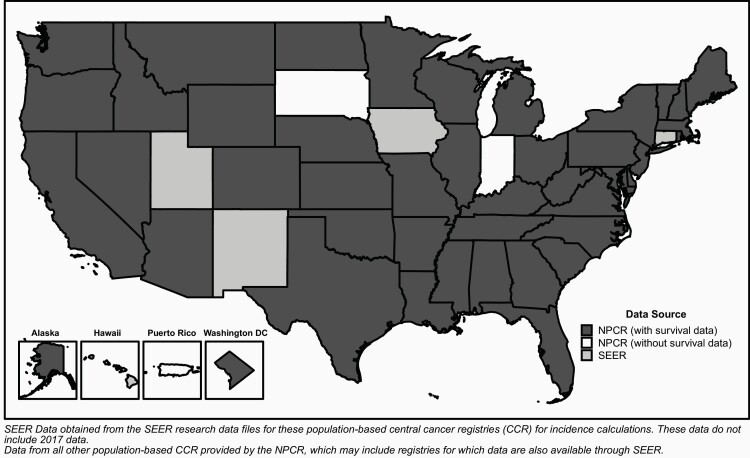
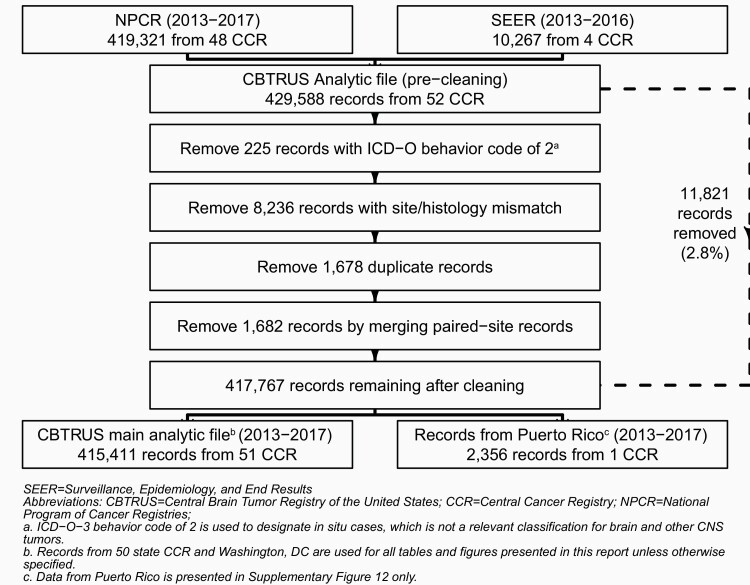
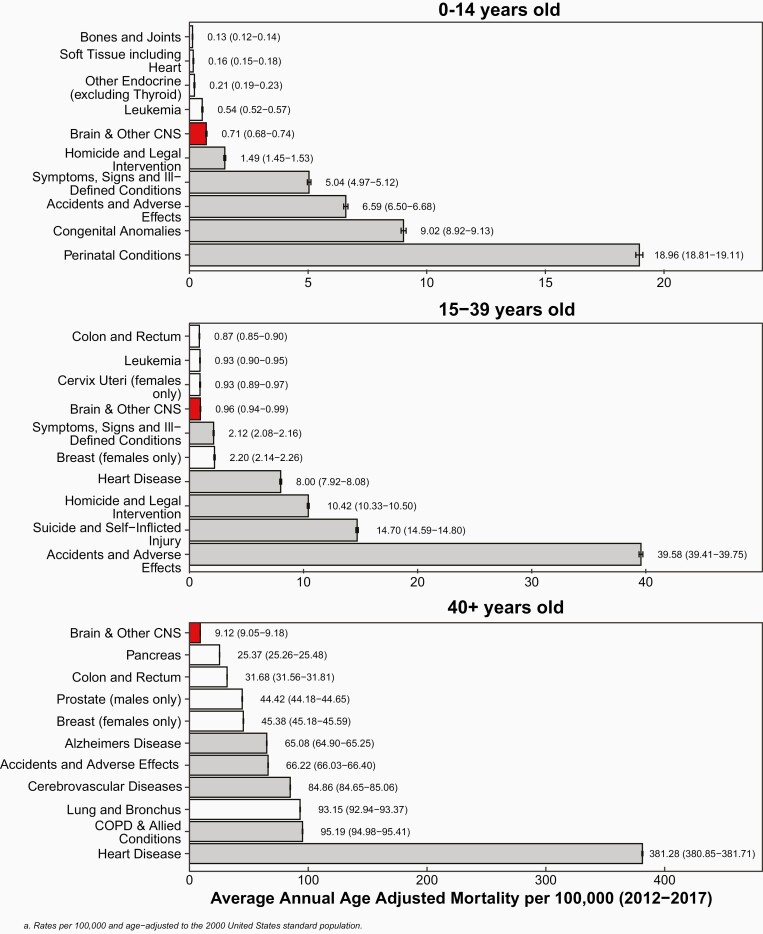
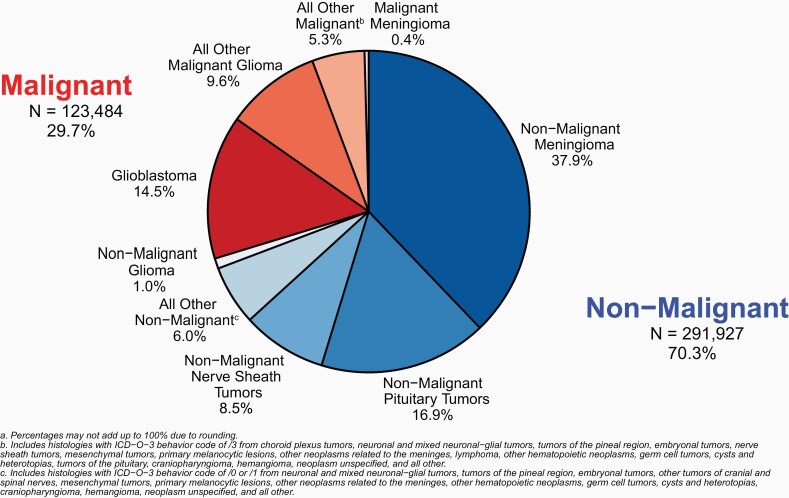
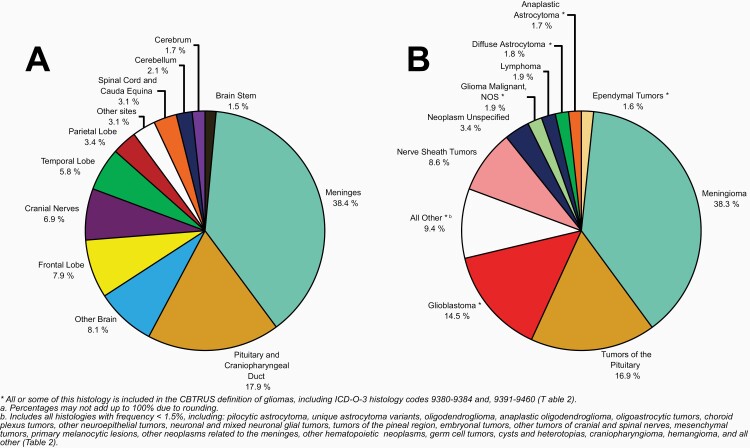
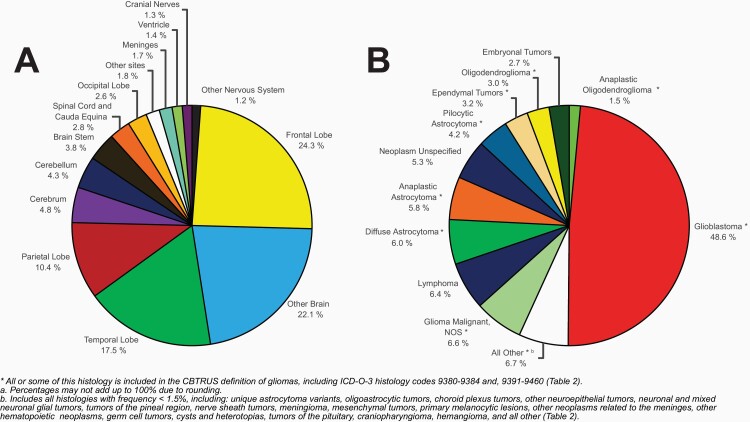
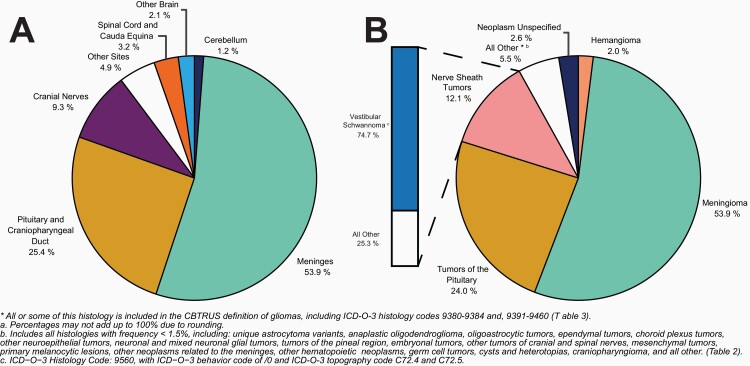
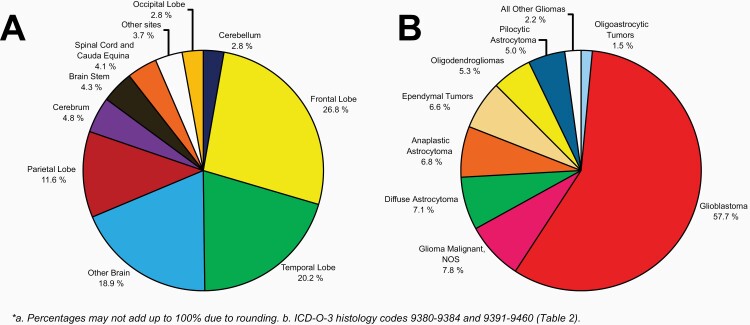
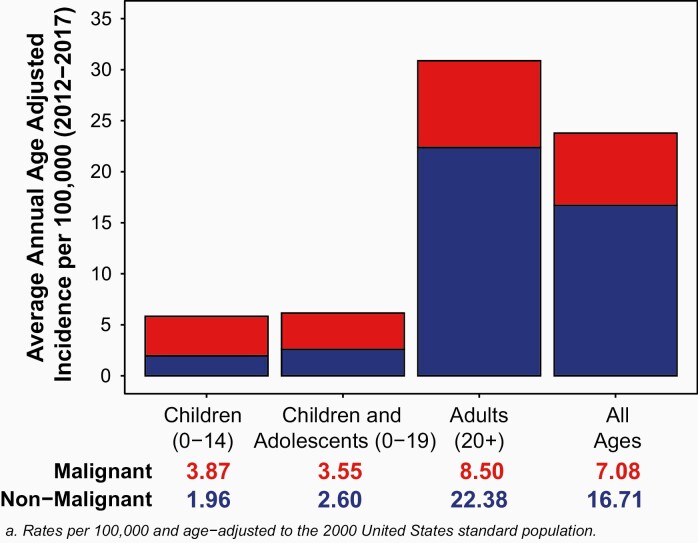
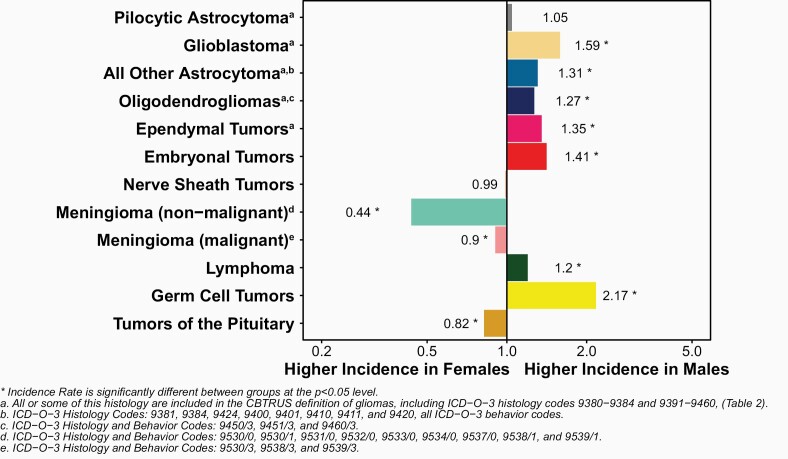
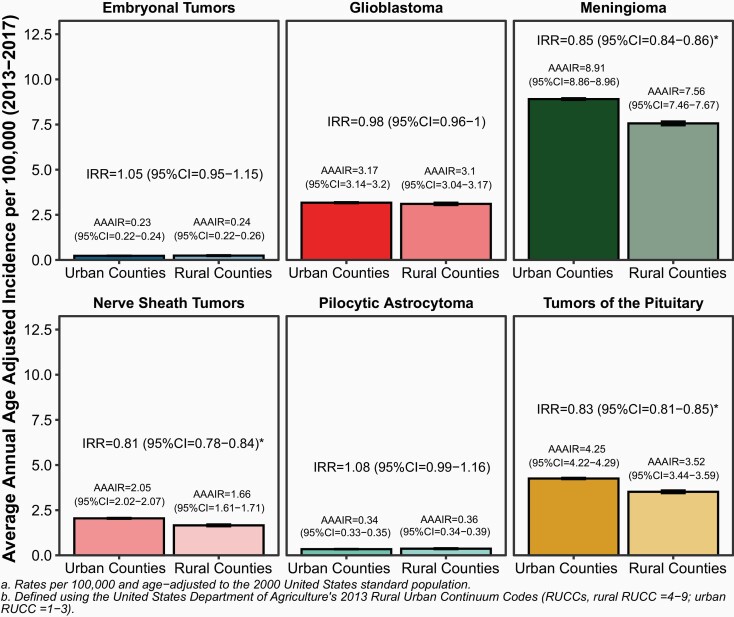
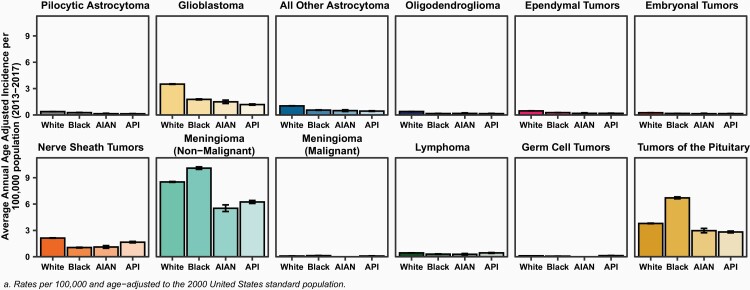
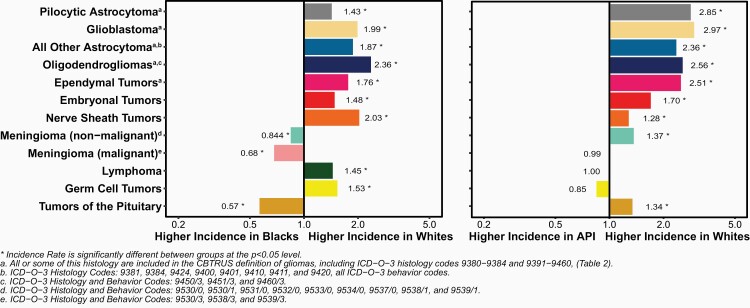
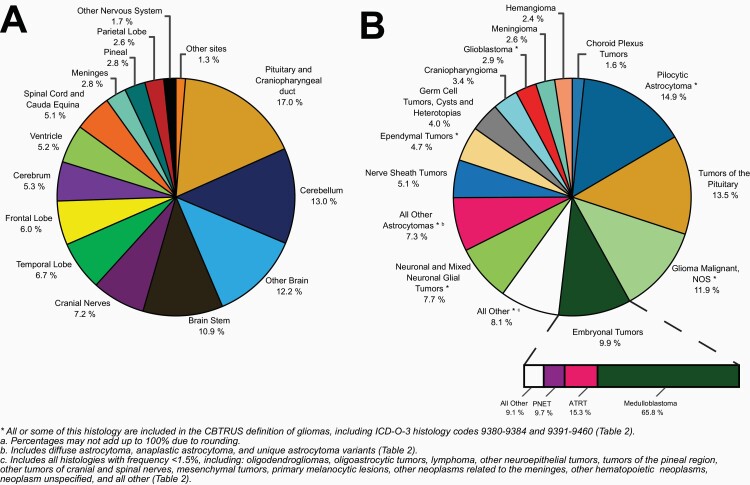
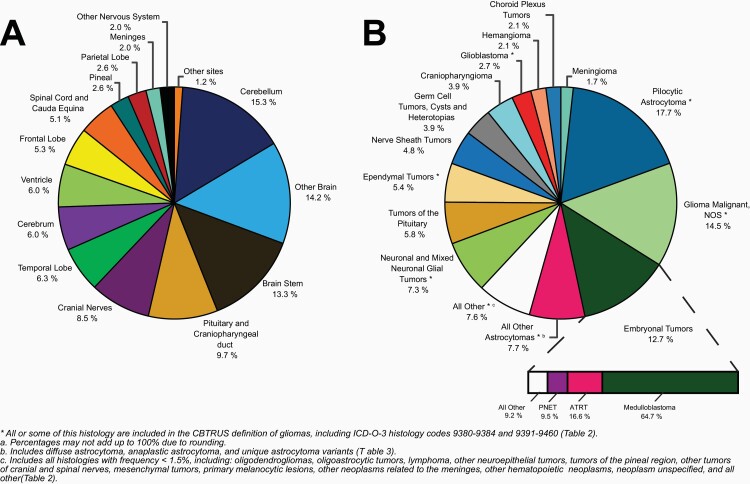
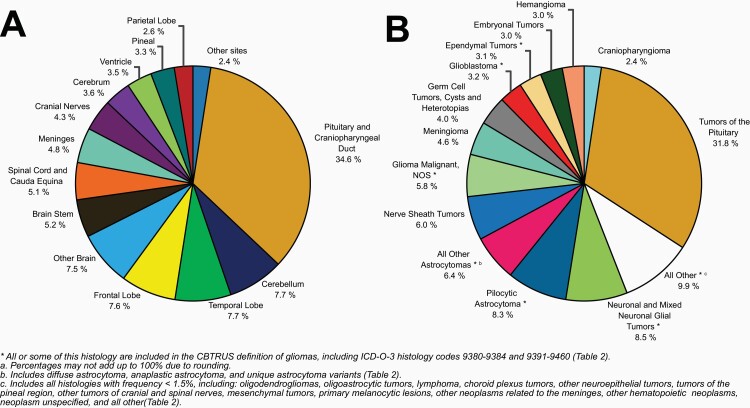
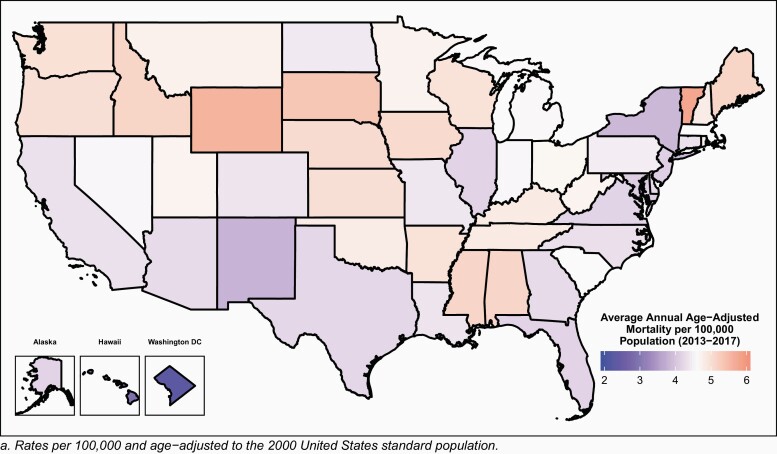
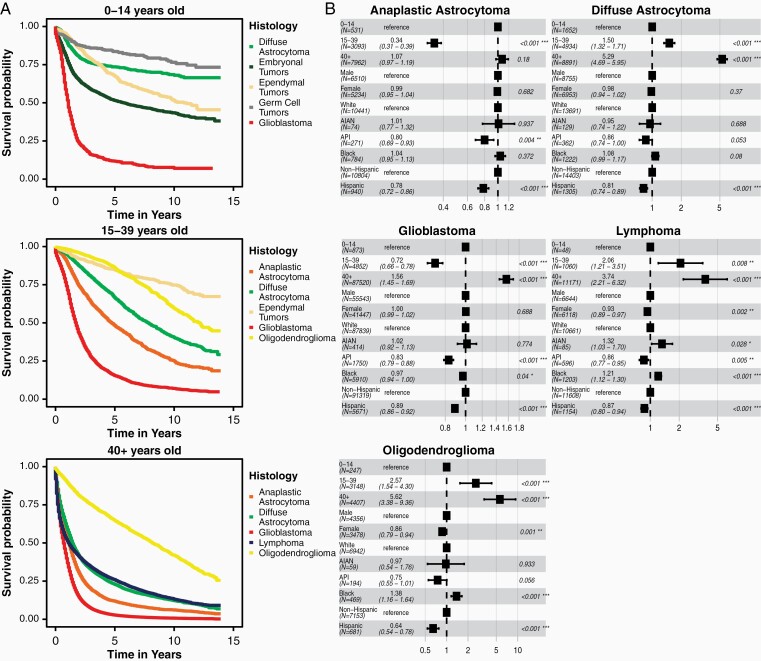
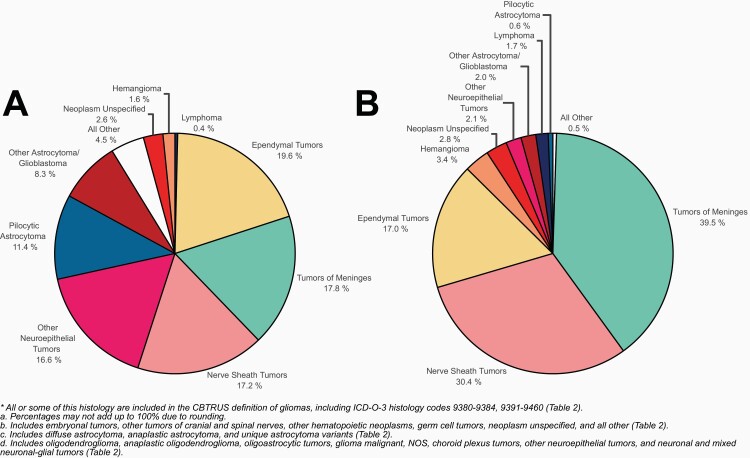
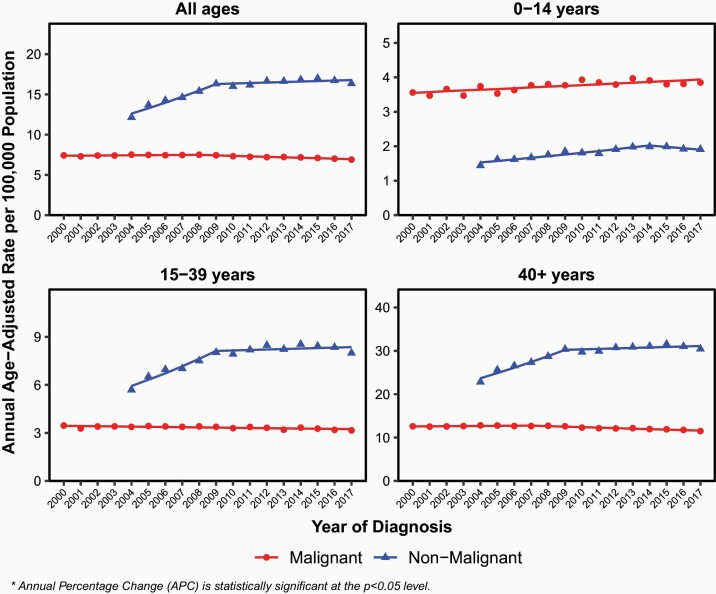
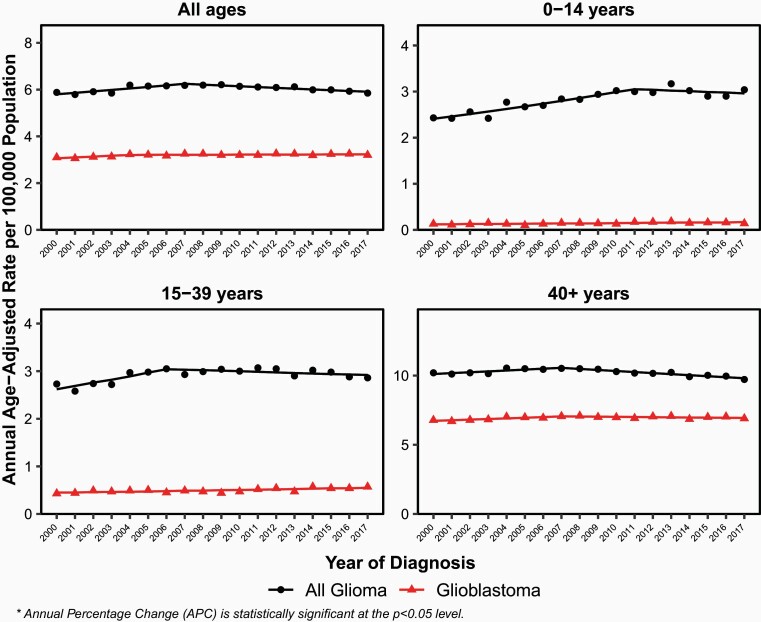
The Central Brain Tumor Registry of the United States (CBTRUS), in collaboration with the Centers for Disease Control (CDC) and National Cancer Institute (NCI), is the largest population-based registry focused exclusively on primary brain and other central nervous system (CNS) tumors in the United States (US) and represents the entire US population. This report contains the most up-to-date population-based data on primary brain tumors (malignant and non-malignant) and supersedes all previous CBTRUS reports in terms of completeness and accuracy. All rates (incidence and mortality) are age-adjusted using the 2000 US standard population and presented per 100,000 population. The average annual age-adjusted incidence rate (AAAIR) of all malignant and non-malignant brain and other CNS tumors was 23.79 (Malignant AAAIR=7.08, non-Malignant AAAIR=16.71). This rate was higher in females compared to males (26.31 versus 21.09), Blacks compared to Whites (23.88 versus 23.83), and non-Hispanics compared to Hispanics (24.23 versus 21.48). The most commonly occurring malignant brain and other CNS tumor was glioblastoma (14.5% of all tumors), and the most common non-malignant tumor was meningioma (38.3% of all tumors). Glioblastoma was more common in males, and meningioma was more common in females. In children and adolescents (age 0-19 years), the incidence rate of all primary brain and other CNS tumors was 6.14. An estimated 83,830 new cases of malignant and non-malignant brain and other CNS tumors are expected to be diagnosed in the US in 2020 (24,970 malignant and 58,860 non-malignant). There were 81,246 deaths attributed to malignant brain and other CNS tumors between 2013 and 2017. This represents an average annual mortality rate of 4.42. The 5-year relative survival rate following diagnosis of a malignant brain and other CNS tumor was 23.5% and for a non-malignant brain and other CNS tumor was 82.4%.


Figures

Fig. 1
Fig. 1
Availability by Central Cancer Registry for SEER and NPCR Incidence (2013-2017, varying) and Survival Data (2001-2016)
Fig. 2
Fig. 2
Overview of CBTRUS Data Cleaning Workflow, NPCR 2013-2017 and SEER 2013-2016
Fig. 3
Fig. 3
Average Annual Age-Adjusted Incidence Ratesa with 95% Confidence Intervals of All Primary Brain and Other CNS Tumors in Comparison To Top Eight Highest Incidence Cancers for Children Age 0-14 Years, Adolescents and Young Adults Age 15-39 Years, and Older Adults Age 40+ Years, CBTRUS Statistical Report: US Cancer Statistics - NPCR and SEER 2013-2017
Fig. 4
Fig. 4
Average Annual Age-Adjusted Mortality Ratesa with 95% Confidence Intervals of All Primary Brain and Other CNS Tumors in Comparison To Top Five Causes of Cancer Death and Top Three Non-Cancer Causes of Death (COD) for Children Age 0-14 Years, Adolescents and Young Adults Age 15-39 Years, and Older Adults Age 40+ Years, CBTRUS Statistical Report: NVSS 2013-2017
Fig. 5
Fig. 5
Distributiona of Primary Brain and Other CNS Tumors by Behavior (Five-Year Total=415,411; Annual Average Cases=83,082), CBTRUS Statistical Report: US Cancer Statistics - NPCR and SEER, 2013-2017
Fig. 6
Fig. 6
Distributiona of All Primary Brain and Other CNS Tumors (Malignant and Non-Malignant Combined; Five-Year Total=415,411; Annual Average Cases=83,082), by A) Site and B) Histology, CBTRUS Statistical Report: US Cancer Statistics - NPCR and SEER, 2013-2017
Fig. 7
Fig. 7
Distributiona of Malignant Primary Brain and Other CNS Tumors (Five-Year Total=123,484; Annual Average Cases=24,697), by A) Site and B) Histology, CBTRUS Statistical Report: US Cancer Statistics - NPCR and SEER, 2013-2017
Fig. 8
Fig. 8
Distributiona of All Non-Malignant Primary Brain and Other CNS Tumors (Five-Year Total=291,927; Annual Average Cases=58,385), by A) Site and B) Histology, CBTRUS Statistical Report: US Cancer Statistics - NPCR and SEER, 2013-2017
Fig. 9
Fig. 9
Distributiona of Primary Brain and Other CNS Gliomasb (Five-Year Total=104,103; Annual Average Cases=20,821) by A) Site and B) Histology Subtypes, CBTRUS Statistical Report: US Cancer Statistics - NPCR and SEER, 2013-2017
Fig. 10
Fig. 10
Average Annual Age-Adjusted Incidence Ratesa of Primary Brain and Other CNS Tumors by Age and Behavior, CBTRUS Statistical Report: US Cancer Statistics - NPCR and SEER, 2013-2017
Fig. 11
Fig. 11
Age-Adjusted Incidence Ratesa of Brain and Other CNS Tumors by Selected Histologies and Age Group a) Age 0-19 Yearsb, B) Age 20+ Yearsb and CBTRUS Statistical Report: US Cancer Statistics - NPCR and SEER, 2013-2017
Fig. 12
Fig. 12
Incidence Rate Ratios by Sex (Males:Females) for Selected Primary Brain and Other CNS Tumor Histologies, CBTRUS Statistical Report: US Cancer Statistics - NPCR and SEER, 2013–2017
Fig. 13
Fig. 13
Average Annual Age-Adjusted Incidence Ratesa of A) Malignant and B) Non-Malignant Primary Brain and Other CNS Tumors by Central Cancer Registry, CBTRUS Statistical Report: US Cancer Statistics - NPCR and SEER, 2013-2017
Fig. 14
Fig. 14
Average Annual Age-Adjusted Incidence Ratesa and Incidence Rate Ratios with 95% Confidence Intervals of Selected Primary Brain and Other CNS Tumor Histologies by Urban Or Rural Residence at Time of Diagnosisb, CBTRUS Statistical Report: US Cancer Statistics - NPCR and SEER, 2013-2017
Fig. 15
Fig. 15
Average Annual Age-Adjusted Incidence Ratesa with 95% Confidence Intervals of Selected Primary Brain and Other CNS Tumor Histologies by Race, CBTRUS Statistical Report: US Cancer Statistics - NPCR and SEER, 2013-2017
Fig. 16
Fig. 16
Incidence Rate Ratios by Race (Whites:Blacks and Whites:Asian Or Pacific Islanders [API]) for Selected Primary Brain and Other CNS Tumor Histologies, CBTRUS Statistical Report: US Cancer Statistics - NPCR and SEER, 2013-2017
Fig. 17
Fig. 17
Distributiona in Children and Adolescents (Age 0-19 Years) of Primary Brain and CNS Tumors (Malignant and Non-Malignant Combined; Five-Year Total=25,105; Annual Average Cases=5,021) by A) Site and B) Histology, CBTRUS Statistical Report: US Cancer Statistics - NPCR and SEER, 2013-2017
Fig. 18
Fig. 18
Distributiona in Children (Age 0-14 Years) of Primary Brain and Other CNS Tumors (Malignant and Non-Malignant Combined; Five-Year Total=17,673; Annual Average Cases=3,535) by A) Site and B) Histology, CBTRUS Statistical Report: US Cancer Statistics - NPCR and SEER, 2012-2016
Fig. 19
Fig. 19
Distributiona in Adolescents (Age 15-19 Years) of Primary Brain and Other CNS Tumors (Malignant and Non-Malignant Combined; Five-Year Total=7,432; Annual Average Cases=1,486) by A) Site and B) Histology, CBTRUS Statistical Report: US Cancer Statistics - NPCR and SEER, 2013-2017
Fig. 20
Fig. 20
Distributiona in Adolescents and Young Adultsb (Age 15-39 Years) of Primary Brain and Other CNS Tumors (Five-Year Total=60,358; Annual Average Cases=12,072) by A) Site and B) Histology, CBTRUS Statistical Report: US Cancer Statistics - NPCR and SEER, 2013-2017
Fig. 21
Fig. 21
Average Annual Age-Adjusted Mortality Ratesa for Malignant Primary Brain and Other CNS Tumors by Central Cancer Registry, CBTRUS Statistical Report: NVSS, 2013-2017
Fig. 22
Fig. 22
A) Kaplan-Meier Survival Curves for the Five Most Common Histologies within Age Groups (Age 0-14, 15-39 and 40+) And B) Hazard Ratios And 95% Confidence Intervals for Sex, Age, Race, and Ethnicity for the Five Most Common Histologies Overall
Fig. 23
Fig. 23
Distributiona of Primary Spinal Cord, Spinal Meninges, and Cauda Equina Tumors by Histology in A) Children and Adolescents (Age 0-19 Years, Five-Year Total=1,371; Annual Average Cases=274) and B) Adults (Age 20+ Years, Five-Year Total=18,502; Annual Average Cases=3,700), CBTRUS Statistical Report: US Cancer Statistics - NPCR and SEER, 2013-2017
Fig. 24
Fig. 24
Annual Age-Adjusted Incidence Rates of Primary Brain and Other CNS Tumors, and Incidence Trends by Behavior and Age Group, CBTRUS Statistical Report: US Cancer Statistics - NPCR and SEER, 2000-2017 (varying)
Fig. 25
Fig. 25
Annual Age-Adjusted Incidence Rates of Primary Brain and Other CNS Gliomas and Glioblastoma, and Incidence Trends by Age Group, CBTRUS Statistical Report: US Cancer Statistics - NPCR and SEER, 2000-2017
Fig. 26
Fig. 26
Annual Age-Adjusted Incidence Rates of Primary Brain and Other CNS Tumors, and Incidence Trends by Histology for Selected A) Non-Malignant and B) Malignant Histologies, CBTRUS Statistical Report: US Cancer Statistics - NPCR and SEER, 2000-2017 (varying)

References

    1. Kruchko C, Ostrom QT, Gittleman H, Barnholtz-Sloan JS. The CBTRUS story: providing accurate population-based statistics on brain and other central nervous system tumors for everyone. Neuro. Oncol. 2018; 20(3):295-298. - PMC - PubMed
    1. Louis D, Wiestler O, Cavanee W, eds. WHO Classification of Tumours of the Central Nervous System. Lyon, France: International Agency for Research on Cancer; 2007.
    1. Ostrom QT, Gittleman H, Liao P, et al. . CBTRUS Statistical Report: Primary Brain and Central Nervous System Tumors Diagnosed in the United States in 2007-2011. Neuro. Oncol. 2014; 16(s4):iv1-iv63. - PMC - PubMed
    1. Centers for Disease Control and Prevention (CDC). National Program of Cancer Registries Cancer Surveillance System Rationale and Approach.1999; http://www.cdc.gov/cancer/npcr/pdf/npcr_css.pdf. Accessed July 21, 2020.
    1. Wiśniewski JR, Zougman A, Nagaraj N, Mann M. Universal sample preparation method for proteome analysis. Nature methods. 2009; 6(5):359-362. - PubMed

MeSH terms