. 2021 Mar 2;60(3):1533-1542.
doi: 10.1093/rheumatology/keaa686.

Dendritic cell integrin expression patterns regulate inflammation in the rheumatoid arthritis joint

Affiliations

Dendritic cell integrin expression patterns regulate inflammation in the rheumatoid arthritis joint

Leonie Schittenhelm et al. Rheumatology (Oxford). .

Abstract

Objectives: Immune dysregulation contributes to the development of RA. Altered surface expression patterns of integrin adhesion receptors by immune cells is one mechanism by which this may occur. We investigated the role of β2 integrin subunits CD11a and CD11b in dendritic cell (DC) subsets of RA patients.

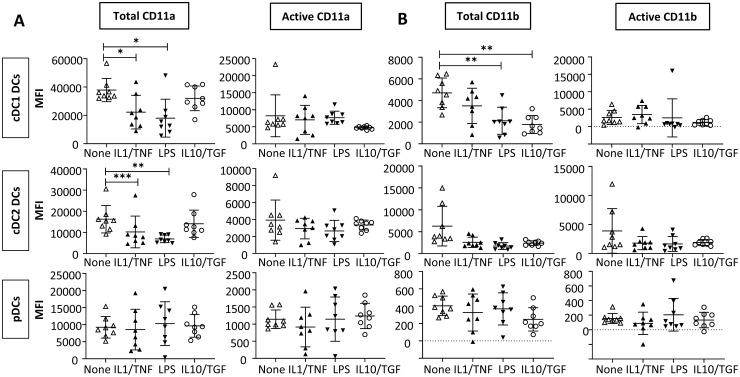
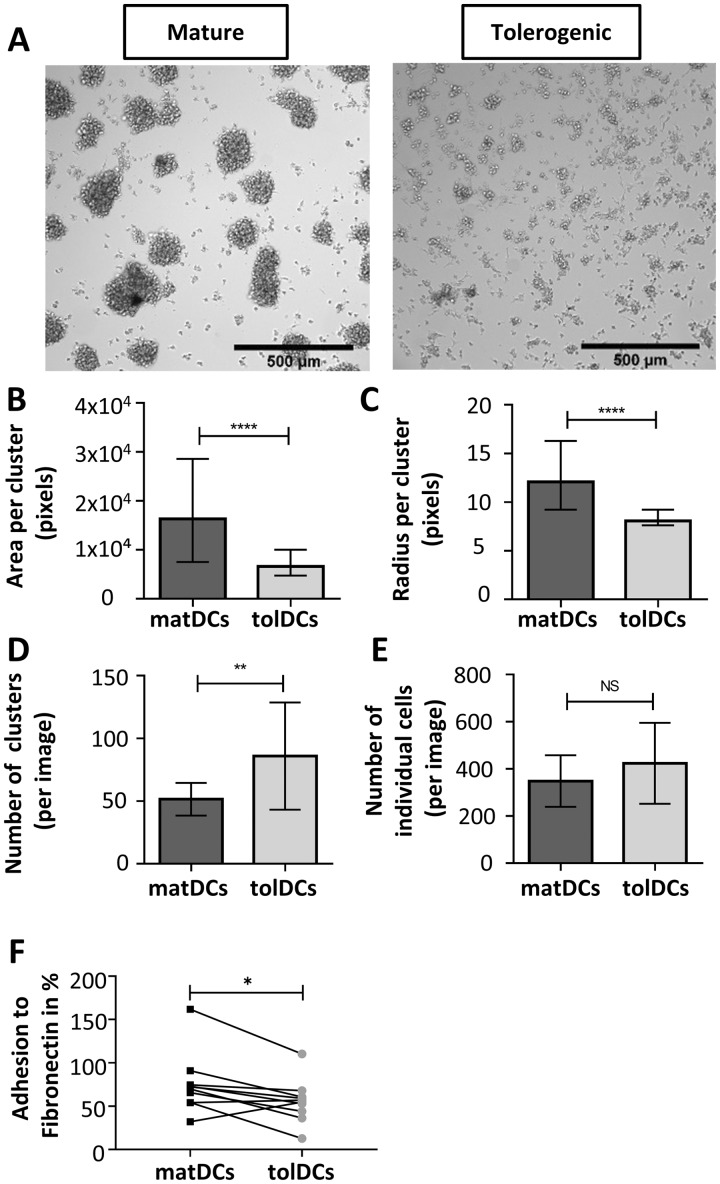
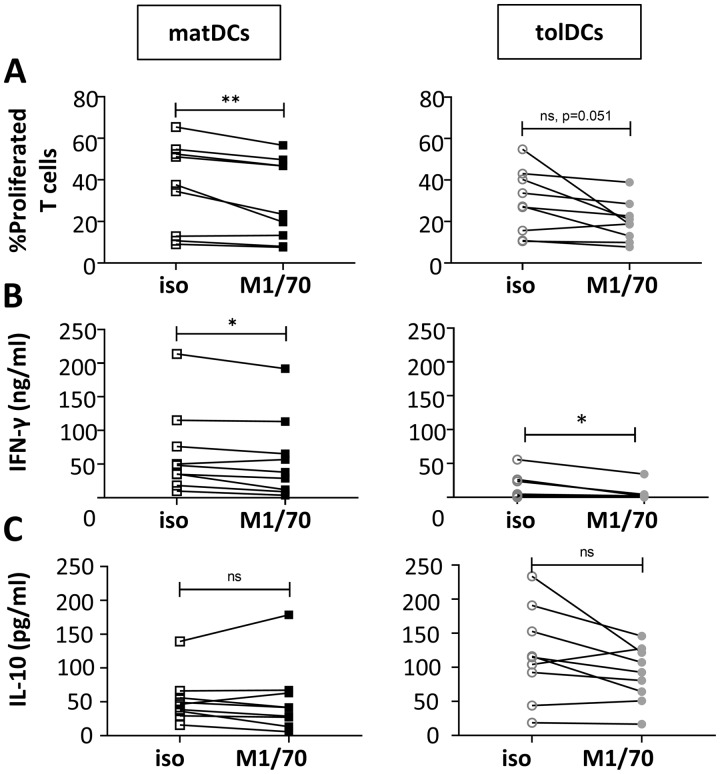
Methods: Total β2 integrin subunit expression and its conformation ('active' vs 'inactive' state) were quantified in DC subsets from peripheral blood (PB) and SF of RA patients as well as PB from healthy controls. Ex vivo stimulation of PB DC subsets and in vitro-generated mature and tolerogenic monocyte-derived DCs (moDCs) were utilized to model the clinical findings. Integrin subunit contribution to DC function was tested by analysing clustering and adhesion, and in co-cultures to assess T cell activation.

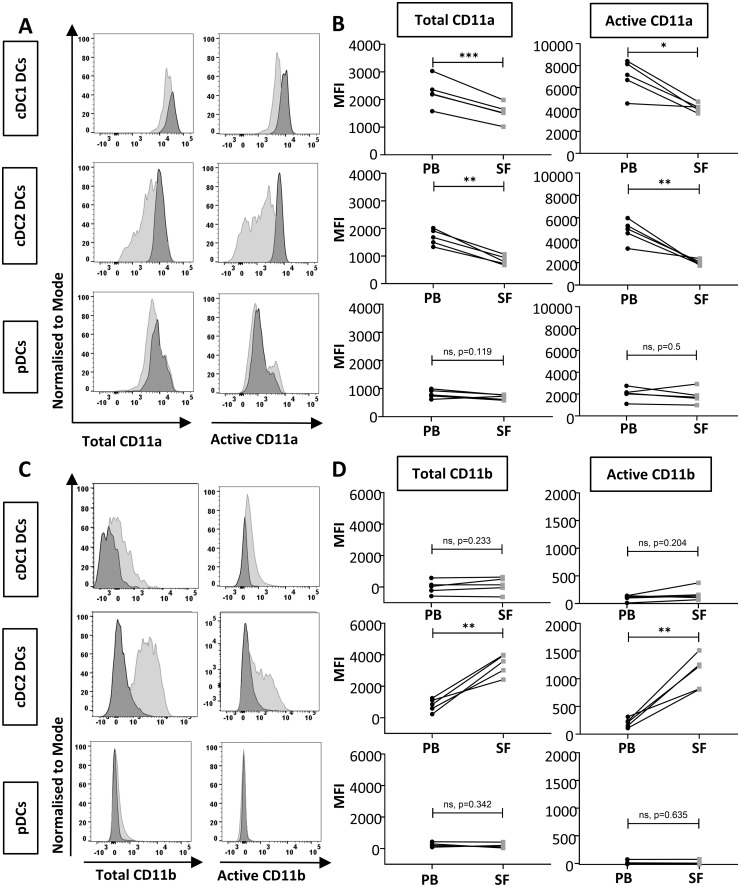
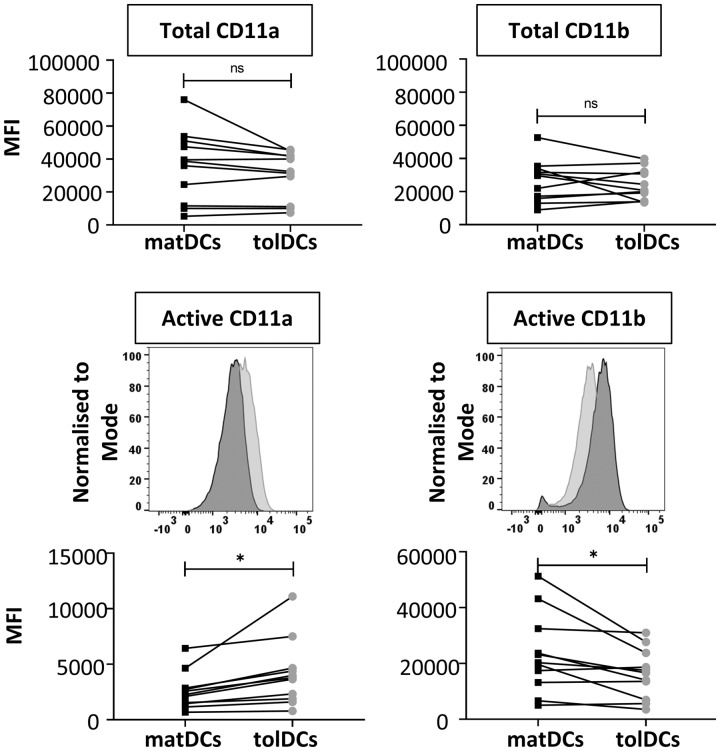
Results: A significant reduction in total and active CD11a expression in DCs in RA SF compared with PB and, conversely, a significant increase in CD11b expression was found. These findings were modelled in vitro using moDCs: tolerogenic moDCs showed higher expression of active CD11a and reduced levels of active CD11b compared with mature moDCs. Finally, blockade of CD11b impaired T cell activation in DC-T cell co-cultures.

Conclusion: For the first time in RA, we show opposing expression of CD11a and CD11b in DCs in environments of inflammation (CD11alow/CD11bhigh) and steady state/tolerance (CD11ahigh/CD11blow), as well as a T cell stimulatory role for CD11b. These findings highlight DC integrins as potential novel targets for intervention in RA.

Keywords: dendritic cells; immune regulation; integrins; rheumatoid arthritis; tolerogenic dendritic cells.


Figures

<sc>Fig</sc>. 1
Fig. 1
Reduced CD11a and increased CD11b expression in cDC2s in SF compared with PB in RA Expression of total and active CD11a (A, B) and CD11b (C, D) comparing PB (dark grey) versus matched SF (light grey) from the same RA patient in cDC1, cDC2 and pDCs. Representative histograms (A and C) and pooled data displaying MFI (B and D) are shown. n = 5 paired samples. As n was too small for normality testing, paired Student’s t-test was used to calculate statistical significance; *P < 0.05, **P < 0.01, ***P < 0.001. cDC: conventional dendritic cell; pDC: plasmacytoid dendritic cell; PB: peripheral blood; MFI: median fluorescence intensity.
<sc>Fig</sc>. 2
Fig. 2
CD11a expression is reduced in DCs in response to inflammatory stimuli PBMCs were isolated from healthy controls and either left untreated (none) or stimulated with IL-1/TNF-α (10 ng/ml each), LPS (100 ng/ml) or IL-10/TGF-β (10 ng/ml each) for 18 h. cDC1, cDC2 and pDCs were gated as per the gating strategy shown in supplementary Fig. S1 available at Rheumatology online. MFI of expression of integrins CD11a (A) and CD11b (B) is shown. n = 8, pooled from two independent experiments. All data are normally distributed. Repeated measures matched one-way ANOVA was used to calculate statistical significance; *P < 0.05, **P < 0.01, ***P < 0.001. DC: dendritic cell; PBMC: peripheral blood mononuclear cell; LPS: lipopolysaccharide; cDC: conventional DC; pDC: plasmacytoid DC; MFI: median fluorescence intensity.
<sc>Fig</sc>. 3
Fig. 3
tolDCs display increased CD11a and reduced CD11b expression compared with matDCs Monocyte-derived mature (matDCs) and tolerogenic (tolDCs) DC expression of β2 integrin subunits CD11a and CD11b is shown. Representative histograms are shown for active integrin subunit expression only, with matDCs in dark grey and tolDCs in light grey. n = 13. Total CD11a data are not normally distributed; Wilcoxon matched-pairs signed rank test was used to calculate statistical significance. All other data were normally distributed; paired Student’s t-test was used; *P < 0.05. DC: dendritic cell; MFI: median fluorescence intensity.
<sc>Fig</sc>. 4
Fig. 4
tolDCs show reduced clustering and adhesion compared with matDCs Clustering analysis (see supplementary Fig. S2 available at Rheumatology online) was performed on monocyte-derived mature (matDCs) and tolerogenic (tolDCs) dendritic cells plated on glass slides for 6 h. (A) Representative bright field microscopy images. (B) Area (number of pixels per cluster), where a cluster size cut-off was set as 40 μm (approx. 2× cell diameter). (C) Median radius, where a cluster size cut-off was set as 20 μm radius. (B and C) Mature = 1493, tolerogenic = 2405 individual clusters; not normally distributed; Mann–Whitney U test. (D, E) Number of clusters and unclustered cells. Mature n = 29, tolerogenic n = 28; data are normally distributed; Student’s t-test. (F) Adhesion of matDCs and tolDCs to fibronectin. n = 10; not normally distributed; Wilcoxon test. For (A–F), three independent experiments (different donors) were performed. Mean (s.d.) is shown except in (B) and (C), where median and interquartile range is shown. In all cases *P < 0.05, **P < 0.01, ***P < 0.001.
<sc>Fig</sc>. 5
Fig. 5
Blockade of CD11b on matDCs reduces their ability to induce T cell activation Anti-CD11b blocking antibody (M1/70) or isotype control (iso; rat IgG2bκ) was added to DC–T cell co-cultures. (A) T cell proliferation was quantified on day 6 of culture by analysis of Cell Trace Violet dilution. Concentrations of IFNγ (B) and IL-10 (C) in co-culture supernatants on day 6 were measured by ELISA. n = 9 moDCs, cultured with n = 3 naïve T cells. In (A) and (C), data are normally distributed; paired Student’s t-test was performed. In (B) data are not normally distributed; Wilcoxon test was performed. *P < 0.05, **P < 0.01. DC: dendritic cell; moDC: monocyte-derived DC; matDC: mature moDC; tolDC: tolerogenic moDC.

Similar articles

Cited by

References

    1. Smolen JS, Aletaha D, McInnes IB.. Rheumatoid arthritis. Lancet 2016;388:2023–38. - PubMed
    1. Kohler BM, Gunther J, Kaudewitz D, Lorenz HM.. Current therapeutic options in the treatment of rheumatoid arthritis. J Clin Med 2019;8:938. - PMC - PubMed
    1. Lutzky V, Hannawi S, Thomas R.. Cells of the synovium in rheumatoid arthritis. Dendritic cells. Arthritis Res Ther 2007;9:219. - PMC - PubMed
    1. Thomas R, Davis LS, Lipsky PE.. Rheumatoid synovium is enriched in mature antigen-presenting dendritic cells. J Immunol 1994;152:2613–23. - PubMed
    1. Leung BP, Conacher M, Hunter D. et al. A novel dendritic cell-induced model of erosive inflammatory arthritis: distinct roles for dendritic cells in T cell activation and induction of local inflammation. J Immunol 2002;169:7071–7. - PubMed

Publication types