. 2021 Jan;413(2):503-517.
doi: 10.1007/s00216-020-03019-3. Epub 2020 Oct 29.

Adduct annotation in liquid chromatography/high-resolution mass spectrometry to enhance compound identification

Affiliations

Adduct annotation in liquid chromatography/high-resolution mass spectrometry to enhance compound identification

Thomas Stricker et al. Anal Bioanal Chem. 2021 Jan.

Erratum in

Abstract

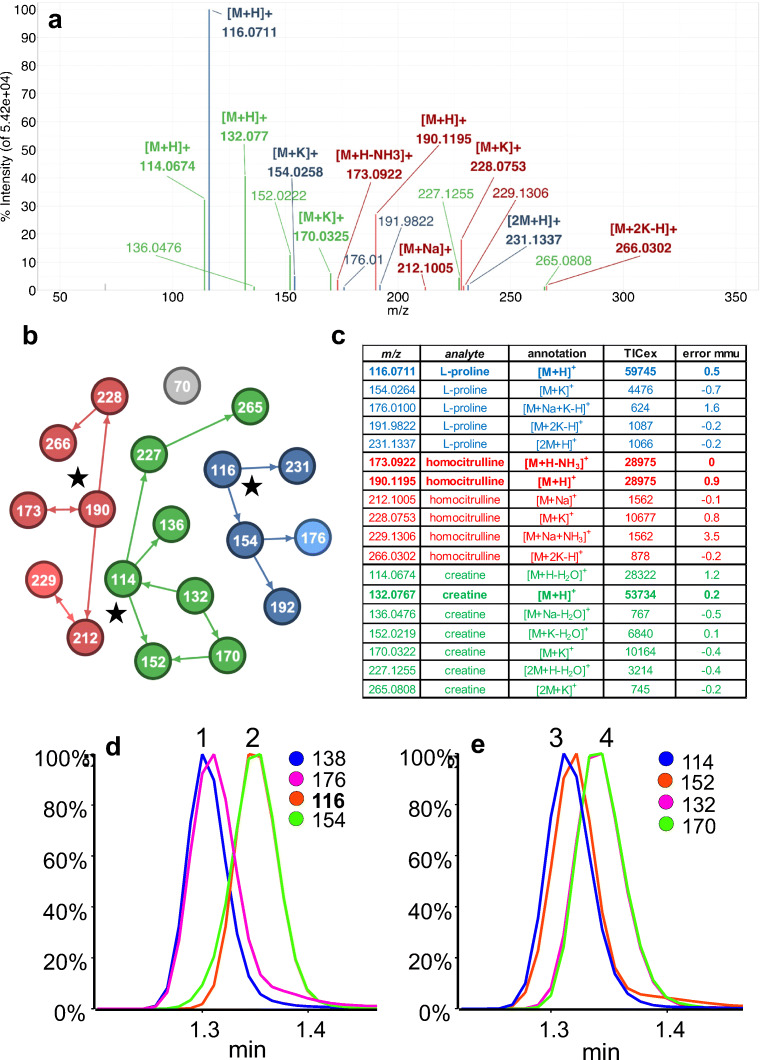
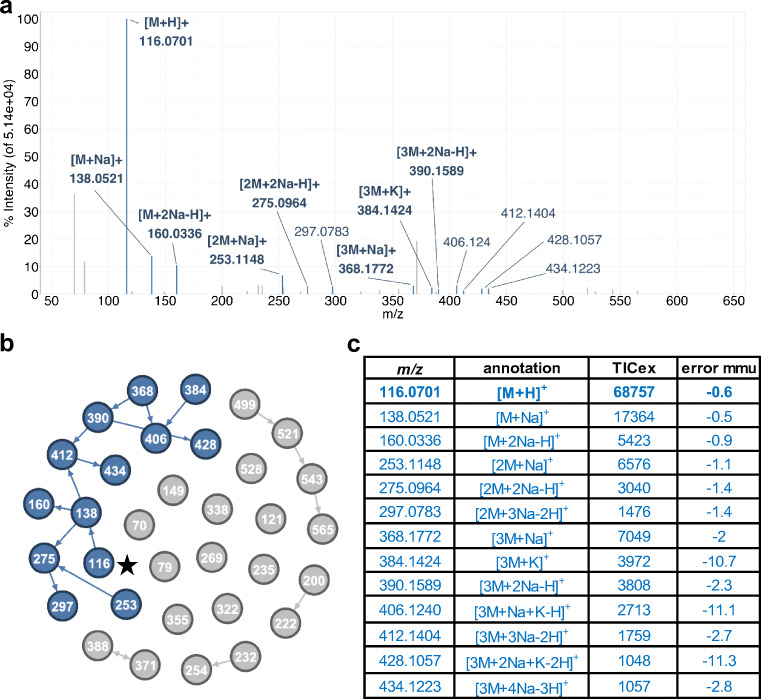
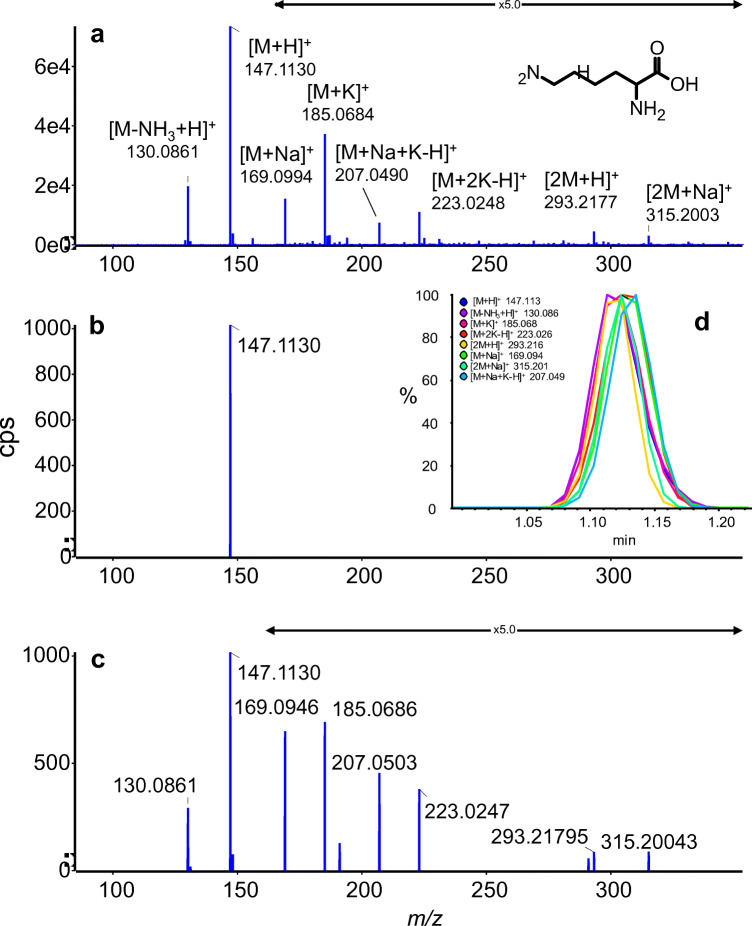
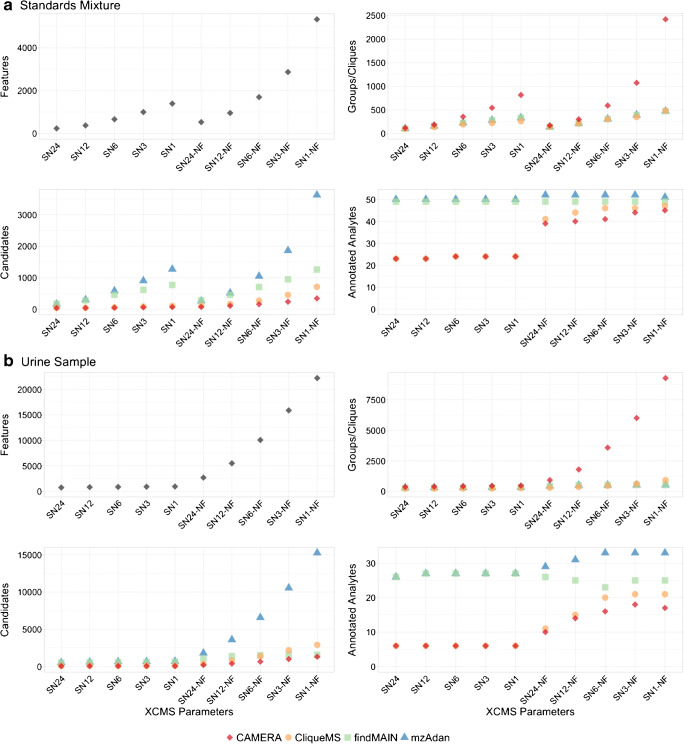
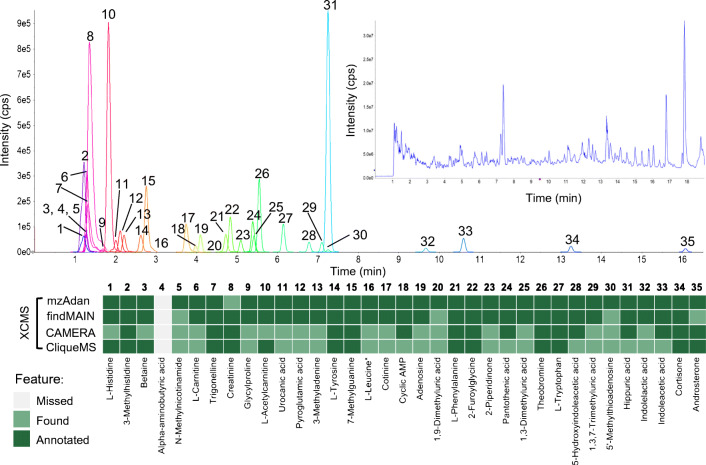
Annotation and interpretation of full scan electrospray mass spectra of metabolites is complicated by the presence of a wide variety of ions. Not only protonated, deprotonated, and neutral loss ions but also sodium, potassium, and ammonium adducts as well as oligomers are frequently observed. This diversity challenges automatic annotation and is often poorly addressed by current annotation tools. In many cases, annotation is integrated in metabolomics workflows and is based on specific chromatographic peak-picking tools. We introduce mzAdan, a nonchromatography-based multipurpose standalone application that was developed for the annotation and exploration of convolved high-resolution ESI-MS spectra. The tool annotates single or multiple accurate mass spectra using a customizable adduct annotation list and outputs a list of [M+H]+ candidates. MzAdan was first tested with a collection of 408 analytes acquired with flow injection analysis. This resulted in 402 correct [M+H]+ identifications and, with combinations of sodium, ammonium, and potassium adducts and water and ammonia losses within a tolerance of 10 mmu, explained close to 50% of the total ion current. False positives were monitored with mass accuracy and bias as well as chromatographic behavior which led to the identification of adducts with calcium instead of the expected potassium. MzAdan was then integrated in a workflow with XCMS for the untargeted LC-MS data analysis of a 52 metabolite standard mix and a human urine sample. The results were benchmarked against three other annotation tools, CAMERA, findMAIN, and CliqueMS: findMAIN and mzAdan consistently produced higher numbers of [M+H]+ candidates compared with CliqueMS and CAMERA, especially with co-eluting metabolites. Detection of low-intensity ions and correct grouping were found to be essential for annotation performance. Graphical abstract.

Keywords: Adducts; Electrospray; HRMS; Liquid chromatography; Metabolomics; Software.


Conflict of interest statement

The authors declare that they have no conflicts of interest.

Figures

None
Graphical abstract
Fig. 1
Fig. 1
Extracted ion profiles for the 52 standard compounds in the UNIGE-LC-MS dataset (see ESM Table S2 for details). The number of eluting compounds per minute is displayed below the chromatograms
Fig. 2
Fig. 2
a Annotated, background-subtracted, deisotoped, and thresholded full scan spectrum of the UNIGE-LC-MS peak at 1.35 min. b Graph generated by mzAdan. The nodes correspond to related masses (nominal values are used for legibility) and arrows indicate the relationship direction and the most likely [M+H]+ candidate is marked with a star (see text for details). c Major ion assignments, explained intensity (TICex), and mass errors for the network clusters. Errors are relative to the elemental formula derived from the annotation. d Extracted ion chromatograms of [M+H]+ and [M+K]+ for 1: trigonelline (m/z 138.0550, 176.0108, RT 1.30 min) and 2: l-proline (m/z 116.0706, 154.0265, RT 1.35 min). e Extracted ion chromatograms of [M+H]+ and [M+K]+ for 3: creatinine (m/z 114.0662, 152.0221, RT 1.31 min) and 4: creatine (m/z 132.0768, 170.0326, RT 1.34 min)
Fig. 3
Fig. 3
a Annotated, background-subtracted, deisotoped, and thresholded full scan spectrum of l-proline from the UNIGE-FIA data. b Network graph generated by mzAdan. Nodes correspond to related masses (nominal values used for legibility) and the arrows indicate relationship direction (see text for details). c Initial ion assignments, explained intensity (TICex), and mass errors for the main cluster. Errors are relative to the elemental formula derived from the annotation
Fig. 4
Fig. 4
Manually annotated mass spectra of l-lysine (C6H14N2O2) considering a set of 12 annotations: [M+H-H2O]+, [M+H-NH3]+, [M+H]+, [M+NH4]+, [M+Na]+, [M+K]+, [M+2Na-H]+, [M-H+2K]+, [2M+H]+, [2M+K]+, [2M+Na]+, and [3M+H]+. Spectra were either extracted using PeakView (Sciex) (a) or generated with XCMS–CAMERA. Only monoisotopic peaks with intensities above 1% and 500 cps were annotated in PeakView, while XCMS pseudo-spectra were annotated “as is.” Only the protonated form of l-lysine was detected using XCMS with the default prefilter settings (b), but disabling the prefilters option resulted in more features, including many adducts (c). A total of eight peaks were annotated with both PeakView and XCMS with prefilters off. The extracted ion chromatograms of the annotated features show that they are slightly displaced (d)
Fig. 5
Fig. 5
Summary of four XCMS-based annotation software packages for the standards mixture (a) and urine sample (b). These tools were tested using data generated by XCMS with different S/N thresholds (sn1–sn24), and the prefilters enabled and set to default values or entirely disabled (nf). The number of features detected by XCMS increased with lower signal-to-noise ratios and the prefilters disabled, and the number of pseudo-spectra generated, [M+H]+ candidates, and metabolite annotations increased. The number of pseudo-spectra generated with CAMERA using its peak shape-based feature grouping algorithm was consistently higher than CliqueMS, while CliqueMS and CAMERA performed worse than findMAIN and mzAdan for both samples and sets of parameters tested, though disabling the prefilters did improve performance. findMAIN and mzAdan consistently produced higher numbers of [M+H]+ candidates
Fig. 6
Fig. 6
Results obtained for the annotation of 35 reference metabolites identified in the urine sample using mzAdan, findMAIN, CAMERA, and CliqueMS, with XCMS for feature detection and grouping. The entire chromatogram is shown (inset), as well as the extracted ion currents of each analyte and a table indicating analyte detection with the different software packages. No peaks were detected for alpha-aminobutyric acid and mzAdan assigned creatinine as a loss of water from creatine

Similar articles

Cited by

References

    1. Mahieu NG, Patti GJ. Systems-level annotation of a metabolomics data set reduces 25000 features to fewer than 1000 unique metabolites. Anal Chem. 2017;89(19):10397–10406. doi: 10.1021/acs.analchem.7b02380. - DOI - PMC - PubMed
    1. Smith CA, Want EJ, O'Maille G, Abagyan R, Siuzdak G. XCMS: processing mass spectrometry data for metabolite profiling using nonlinear peak alignment, matching, and identification. Anal Chem. 2006;78(3):779–787. doi: 10.1021/ac051437y. - DOI - PubMed
    1. Pluskal T, Castillo S, Villar-Briones A, Oresic M. MZmine 2: modular framework for processing, visualizing, and analyzing mass spectrometry-based molecular profile data. BMC Bioinformatics. 2010;11:395. doi: 10.1186/1471-2105-11-395. - DOI - PMC - PubMed
    1. Tsugawa H, Cajka T, Kind T, Ma Y, Higgins B, Ikeda K, et al. MS-DIAL: data-independent MS/MS deconvolution for comprehensive metabolome analysis. Nat Methods. 2015;12(6):523–526. doi: 10.1038/nmeth.3393. - DOI - PMC - PubMed
    1. Li Z, Lu Y, Guo Y, Cao H, Wang Q, Shui W. Comprehensive evaluation of untargeted metabolomics data processing software in feature detection, quantification and discriminating marker selection. Anal Chim Acta. 2018;1029:50–57. doi: 10.1016/j.aca.2018.05.001. - DOI - PubMed

LinkOut - more resources