. 2020 Dec;24(24):14205-14216.
doi: 10.1111/jcmm.16035. Epub 2020 Oct 30.

Molecular structure and evolution mechanism of two populations of double minutes in human colorectal cancer cells

Affiliations

Molecular structure and evolution mechanism of two populations of double minutes in human colorectal cancer cells

Xueyuan Jia et al. J Cell Mol Med. 2020 Dec.

Abstract

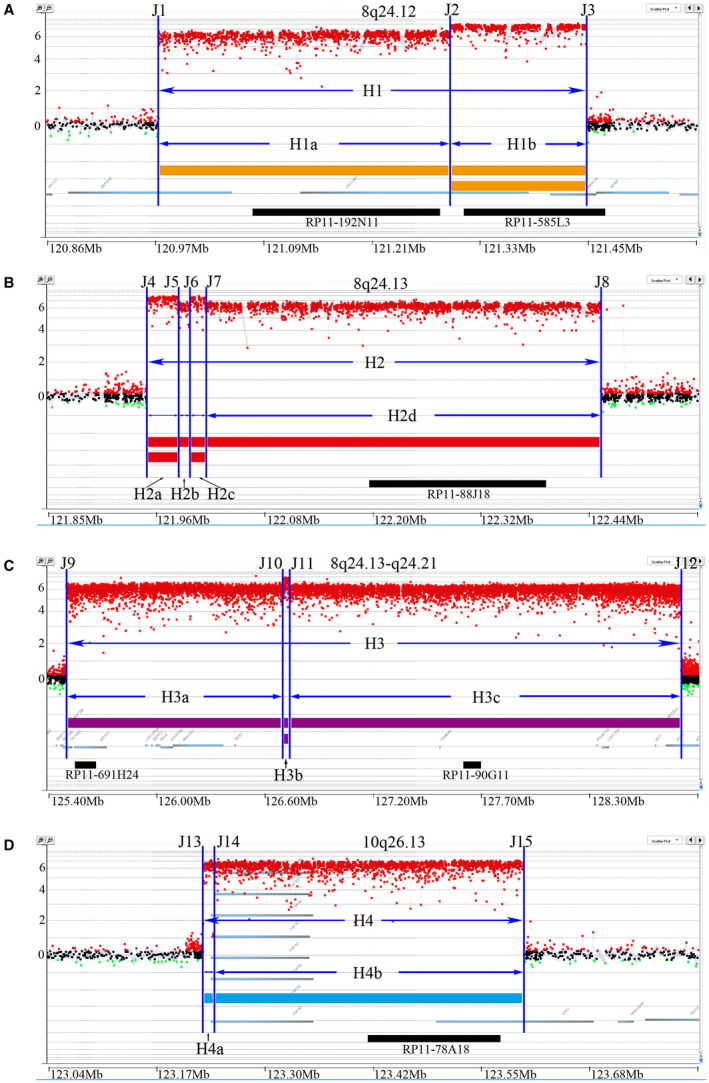
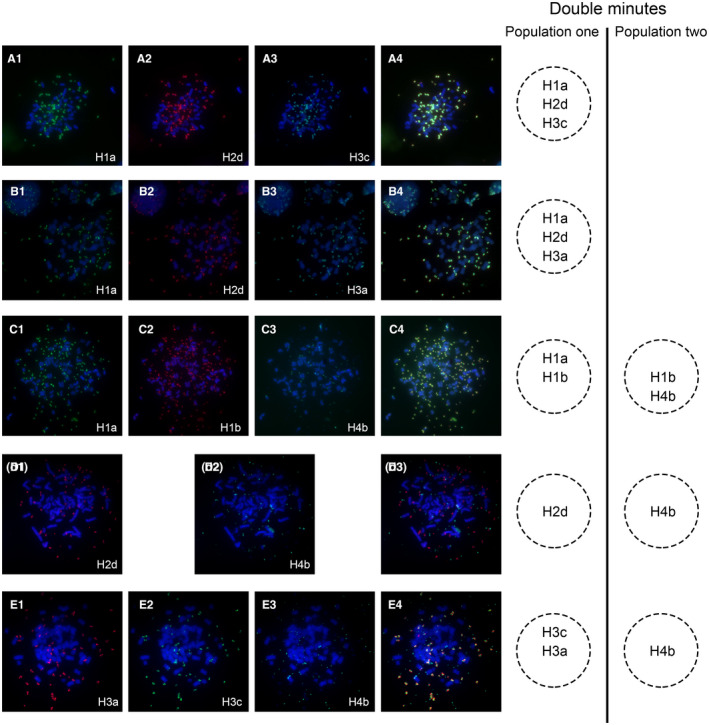
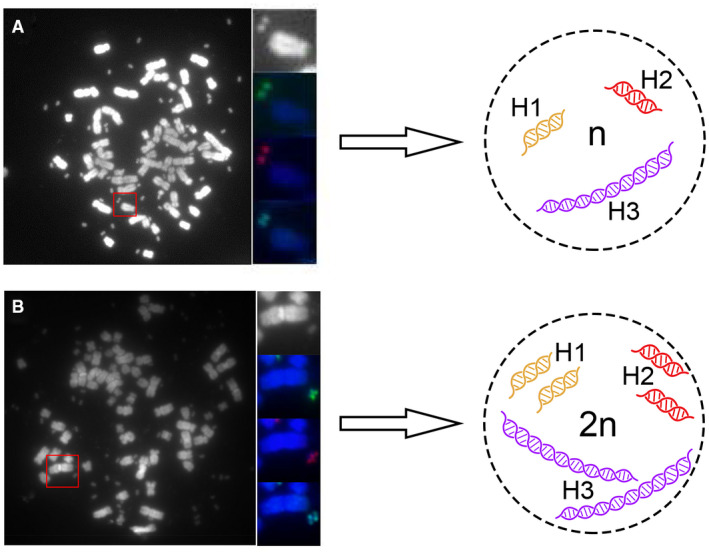
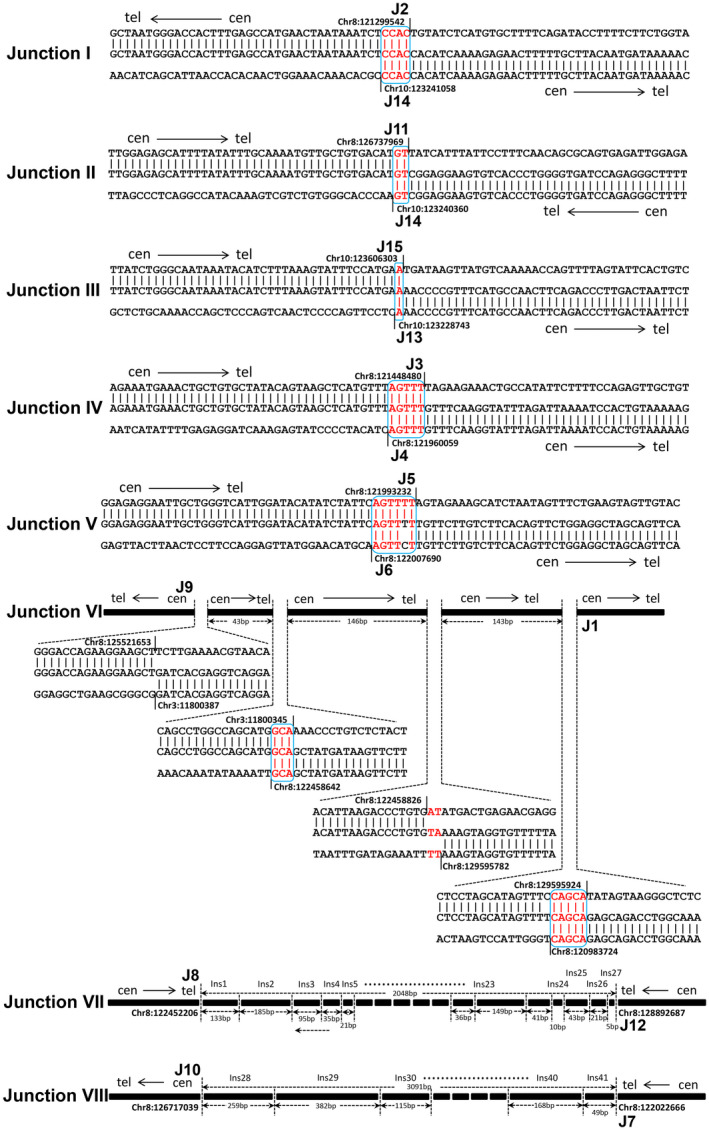
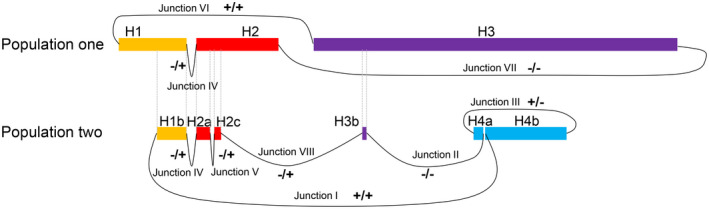
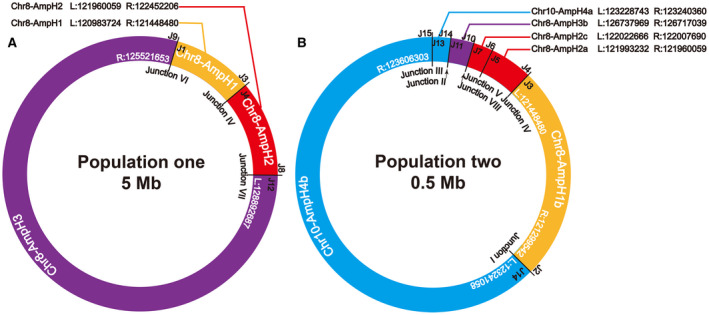
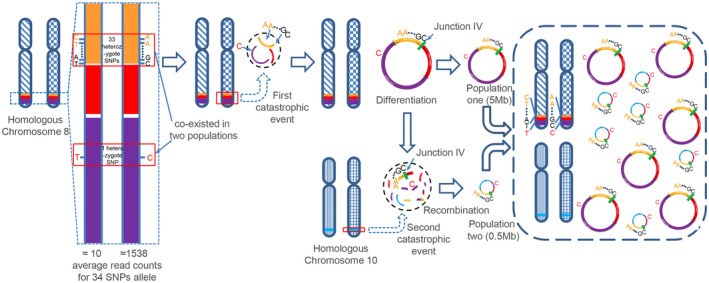
Gene amplification chiefly manifests as homogeneously stained regions (HSRs) or double minutes (DMs) in cytogenetically and extrachromosomal DNA (ecDNA) in molecular genetics. Evidence suggests that gene amplification is becoming a hotspot for cancer research, which may be a new treatment strategy for cancer. DMs usually carry oncogenes or chemoresistant genes that are associated with cancer progression, occurrence and prognosis. Defining the molecular structure of DMs will facilitate understanding of the molecular mechanism of tumorigenesis. In this study, we re-identified the origin and integral sequence of DMs in human colorectal adenocarcinoma cell line NCI-H716 by genetic mapping and sequencing strategy, employing high-resolution array-based comparative genomic hybridization, high-throughput sequencing, multiplex-fluorescence in situ hybridization and chromosome walking techniques. We identified two distinct populations of DMs in NCI-H716, confirming their heterogeneity in cancer cells, and managed to construct their molecular structure, which were not investigated before. Research evidence of amplicons distribution in two different populations of DMs suggested that a multi-step evolutionary model could fit the module of DM genesis better in NCI-H716 cell line. In conclusion, our data implicated that DMs play a very important role in cancer progression and further investigation is necessary to uncover the role of the DMs.

Keywords: colorectal adenocarcinoma; double minutes; evolution mechanism; extrachromosomal DNA; gene amplification; molecular structure.


Conflict of interest statement

The authors declare that they have no competing interests.

Figures

Figure 1
Figure 1
Four amplified regions were determined in NCI‐H716 cells with an Agilent array‐CGH chip with high‐density probes. The yellow strip in A, red strip in B, purple strip in C and blue strip in D represented each corresponding amplification region—H1, H2, H3 and H4. The majority of the copy numbers were around 26, shown with single line. The majority of the copy numbers were around 27, shown with double lines. X‐axis represented chromosome coordinates. Y‐axis represented log2 ratios of the copy number normalized by normal controls, showing distinct sub‐regions with different overall copy numbers. Blue vertical lines depict boundary positions for each amplicon. The position of the BACs was marked with black strip
Figure 2
Figure 2
The heterogeneous composition of two subpopulations of DMs determined by M‐FISH analysis. (A) Co‐hybridization of RP11‐192N11 (green) (A1)‐H1a, RP11‐88J18 (red) (A2)‐H2d and RP11‐90G11 (light blue) (A3)‐H3c showed overlapping signals (A4) on the same DMs. (B) RP11‐192N11 (green) (B1)‐H1a, RP11‐88J18 (red) (B2)‐H2d and RP11‐691H24 (light blue) (B3)‐H3a showed overlapping signals (B4) in the same DMs. (C) Co‐localization of RP11‐192N11 (green) (C1)‐H1a and RP11‐585L3 (red) (C2)‐H1b; overlapping hybridization of RP11‐585L3 (red) (C2)‐H1b and RP11‐78A18 (light blue) (C3)‐H4b was shown in the overlay image (C4). (D) Hybridization of RP11‐88J18 (red) (D1)‐H2d and RP11‐78A18 (green) (D2)‐H4b disclosed that two BACs located on different populations of DMs (D3). (E) Hybridization of RP11‐691H24 (red) (E1)‐H3a and RP11‐90G11 (green) (E2)‐H3c demonstrated their co‐localization on the same DMs, but no overlapping signals with RP11‐78A18 (light blue) (E3)‐H4b was shown in the overlay image (E4)
Figure 3
Figure 3
Two different molecular structures in Population one of DMs. Hybridization of RP11‐192N11 (green)‐H1a, RP11‐88J18 (red)‐H2d and RP11‐90G11 (light blue)‐H3c. (A) Uni‐fluorescence signal for each BAC probe was detected in one single DMs. (B) Two fluorescence signals were detected in one single DMs, which showed a structure similar to ‘diploid’
Figure 4
Figure 4
The sequence characterization of Junctions by alignment with human reference genome (GRCh37/hg19). Small insertions were shown in red. Microhomologies were shown in boxed red letters. Black vertical lines depicted the boundary of each amplicon. The size of each insertion in Junction VII and Junction VIII was indicated without scale. The complete sequences of eight junctions were listed in Table S3
Figure 5
Figure 5
The rejoining model of rearranged fragments in two subpopulations of DMs. All fragments of DMs were shown from left (‘+’‐head) to right (‘−’‐tail). All rejoining models were listed and marked as −/+ (tail‐to‐head), +/− (head‐to‐tail), +/+ (head‐to‐head) and −/− (tail‐to‐tail)
Figure 6
Figure 6
The molecular structure model of two subpopulations of DMs. (A) Circular model of DM Population one, which was around 5 Mb in length, was summarized by sequence alignment and M‐FISH. Corresponding positions of rearrangement breakpoints of amplicon H1, H2 and H3 in human genome were indicated as L and R. (B) Molecular structure model of DMs Population two showed the circularized compositions of amplicons H1b, H2a, H2c, H3b, H4a and H4b. The chromosome origins and the name of the Junctions were listed inside the circles
Figure 7
Figure 7
Process of multi‐step evolution drives DMs formation in NCI‐H716 cancer. The yellow strip, red strip, purple strip and blue strip represented each corresponding amplification region—H1, H2, H3 and H4. Green bar represented Junction IV, which does not exist on chromosomes, shared by both populations

References

    1. Gebhart E. Double minutes, cytogenetic equivalents of gene amplification, in human neoplasia ‐ a review. Clin Transl Oncol. 2005;7(11):477‐485. - PubMed
    1. Shimizu N. Extrachromosomal double minutes and chromosomal homogeneously staining regions as probes for chromosome research. Cytogenet Genome Res. 2009;124(3‐4):312‐326. - PubMed
    1. Turner KM, Deshpande V, Beyter D, et al. Extrachromosomal oncogene amplification drives tumour evolution and genetic heterogeneity. Nature. 2017;543(7643):122‐125. - PMC - PubMed
    1. Albertson DG. Gene amplification in cancer. Trends Genet. 2006;22(8):447‐455. - PubMed
    1. Myllykangas S, Bohling T, Knuutila S. Specificity, selection and significance of gene amplifications in cancer. Semin Cancer Biol. 2007;17(1):42‐55. - PubMed

Publication types