

SATB2 drives glioblastoma growth by recruiting CBP to promote FOXM1 expression in glioma stem cells
- PMID: 33124191
- PMCID: PMC7721366
- DOI: 10.15252/emmm.202012291
SATB2 drives glioblastoma growth by recruiting CBP to promote FOXM1 expression in glioma stem cells
Abstract
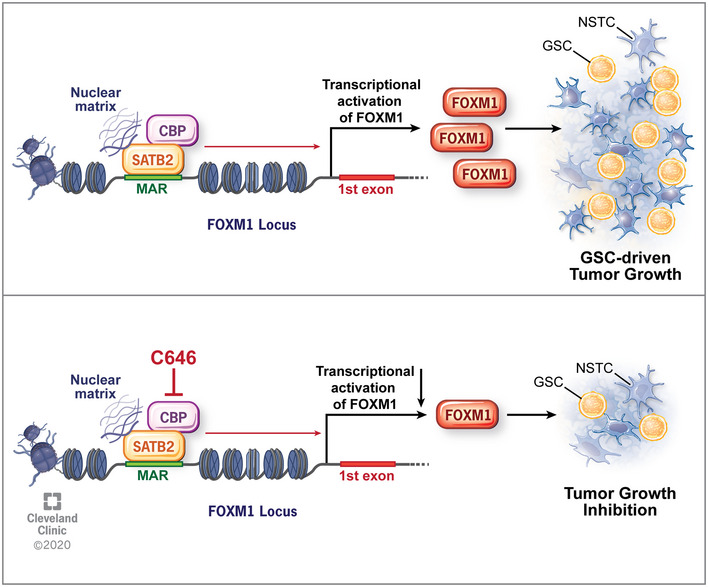
Nuclear matrix-associated proteins (NMPs) play critical roles in regulating chromatin organization and gene transcription by binding to the matrix attachment regions (MARs) of DNA. However, the functional significance of NMPs in glioblastoma (GBM) progression remains unclear. Here, we show that the Special AT-rich Binding Protein-2 (SATB2), one of crucial NMPs, recruits histone acetyltransferase CBP to promote the FOXM1-mediated cell proliferation and tumor growth of GBM. SATB2 is preferentially expressed by glioma stem cells (GSCs) in GBM. Disrupting SATB2 markedly inhibited GSC proliferation and GBM malignant growth by down-regulating expression of key genes involved in cell proliferation program. SATB2 activates FOXM1 expression to promote GSC proliferation through binding to the MAR sequence of FOXM1 gene locus and recruiting CBP to the MAR. Importantly, pharmacological inhibition of SATB2/CBP transcriptional activity by the CBP inhibitor C646 suppressed GSC proliferation in vitro and GBM growth in vivo. Our study uncovers a crucial role of the SATB2/CBP-mediated transcriptional regulation in GBM growth, indicating that targeting SATB2/CBP may effectively improve GBM treatment.
Keywords: CBP; FOXM1; SATB2; glioblastoma; glioma stem cell.
© 2020 The Authors. Published under the terms of the CC BY 4.0 license.
Conflict of interest statement
The authors declare that they have no conflict of interest.
Figures
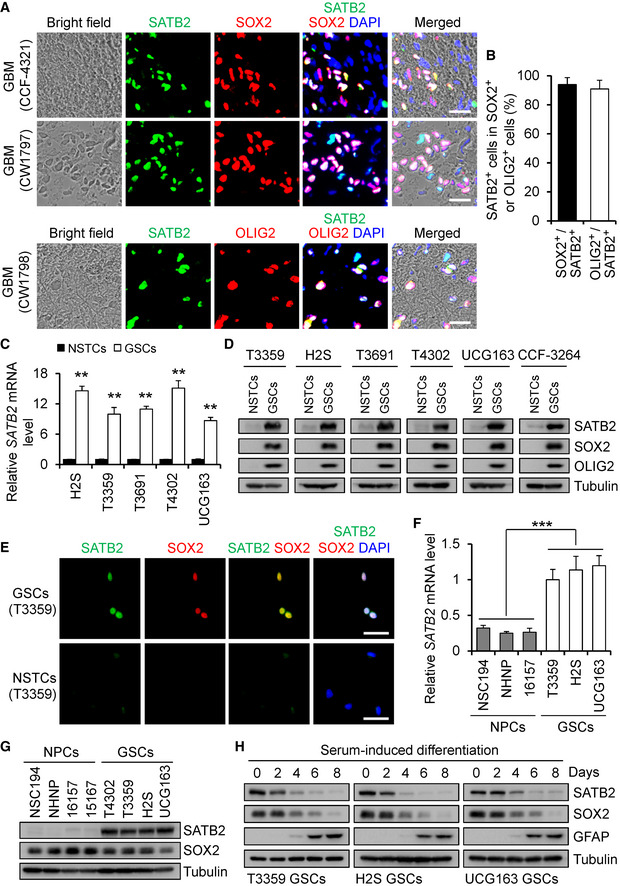
Immunofluorescence of SATB2 (green) and the GSC marker SOX2 or OLIG2 (red) on frozen tissue sections of human GBM surgical specimens. SATB2 is preferentially expressed by GSCs in human GBMs. Scale bar, 25 μm.
Quantification of the fraction of SATB2+ cells in SOX2+ or OLIG2+ cells in human GBMs. More than 90% SOX2+ or OLIG2+ cells showed SATB2 staining. n = 3 GBMs.
qPCR analysis of SATB2 mRNA expression in GSCs and matched non‐stem tumor cells (NSTCs) (n = 5).
Immunoblot analysis of SATB2, SOX2, and OLIG2 expression in cell lysates of GSCs and matched NSTCs.
Immunofluorescence of SATB2 (green) and SOX2 (red) in T3359 GSCs and matched NSTCs. Scale bar, 50 μm.
qPCR analysis of SATB2 mRNA expression in GSCs and neural progenitor cells (NPCs) (n = 3).
Immunoblot analysis of SATB2 and SOX2 expression in cell lysates of GSCs and NPCs.
Immunoblot analysis of SATB2, GSC marker SOX2, and differentiation marker GFAP expression during serum‐induced GSC differentiation.
- A
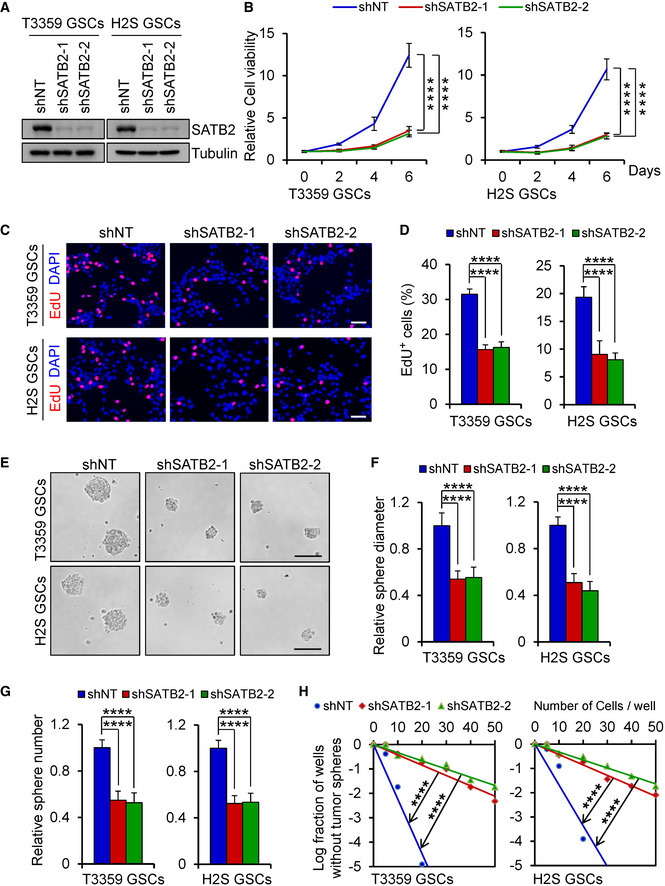
Immunoblot analysis of SATB2 expression in GSCs transduced with lentiviral‐mediated non‐targeting shRNA (shNT) or SATB2 shRNA (shSATB2).
- B
Cell viability of GSCs transduced with shNT or shSATB2 (n = 5).
- C
EdU incorporation assay of GSCs transduced with shNT or shSATB2. Scale bar: 50 μm.
- D
Quantification of (C) showing the percentage of EdU+ cells (n = 5).
- E
Tumorsphere images of GSCs transduced with shNT or shSATB2. Scale bar: 100 μm.
- F, G
Quantification of the diameter (F) or number (G) of tumorspheres formed by GSCs expressing shNT or shSATB2 (F: n = 9; G: n = 5).
- H
In vitro limiting dilution analysis of the tumorsphere formations of GSCs expressing shNT or shSATB2. Silencing SATB2 attenuated the self‐renewal capacity of GSCs.
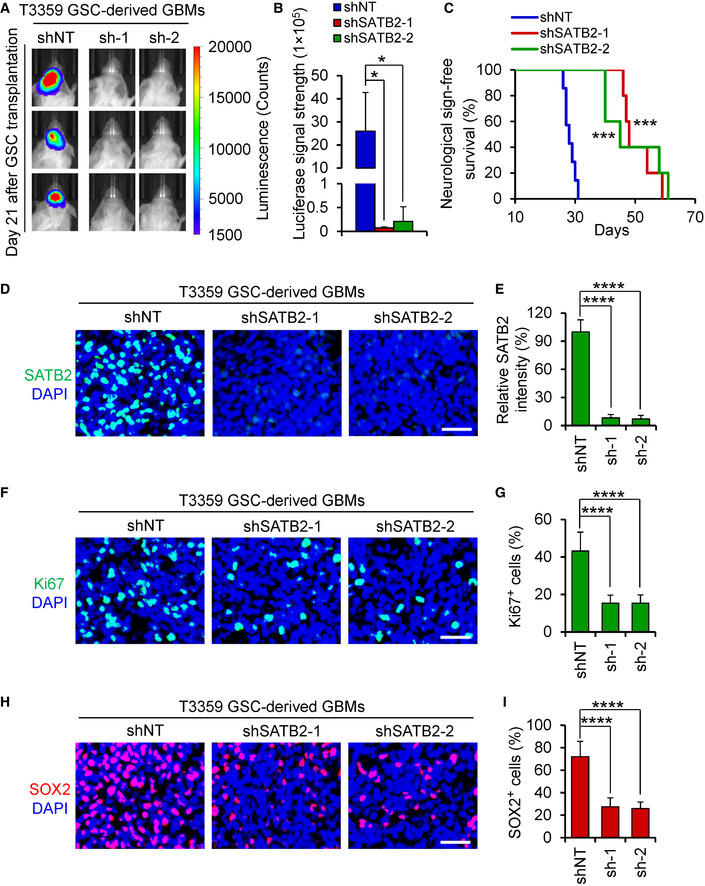
Bioluminescent images of the GBM xenografts derived from the luciferase‐labeled T3359 GSCs expressing NT or SATB2 shRNA. Representative images on day 21 posttransplantation are shown (n = 5 mice per group). Silencing SATB2 significantly delayed GBM growth.
Quantification of the bioluminescence of xenografts derived from the luciferase‐labeled T3359 GSCs expressing shNT or shSATB2 on day 21 posttransplantation (n = 5 mice per group).
Kaplan–Meier survival curves of mice intracranially implanted with T3359 GSCs expressing shNT or shSATB2 (shNT: n = 7 mice; shSATB2‐1 or shSATB2‐2: n = 5 mice). Median survival: shNT, 28 days; shSATB2‐1, 48 days; shSATB2‐2, 45 days. Animals bearing GSC‐derived xenografts expressing SATB2 shRNA survived longer than the control animals.
Immunofluorescence of SATB2 (Green) in xenografts derived from T3359 GSCs expressing shNT or shSATB2 (n = 5 tumors per group). Scale bar: 40 μm.
Quantification of SATB2 intensity in xenografts derived from T3359 GSCs expressing shNT or shSATB2 (n = 5 tumors per group).
Immunofluorescence of Ki67 (Green) in tumor xenografts derived from T3359 GSCs expressing shNT or shSATB2 (n = 5 tumors per group). Scale bar: 40 μm.
Quantification of Ki67 positive cells in xenografts derived from T3359 GSCs expressing shNT or shSATB2 (n = 5 tumors per group).
Immunofluorescence of SOX2 (Red) in xenografts derived from T3359 GSCs expressing shNT or shSATB2 (n = 4 tumors per group). Scale bar: 40 μm.
Quantification of SOX2 positive cells in xenografts derived from T3359 GSCs expressing shNT or shSATB2 (n = 4 tumors per group).
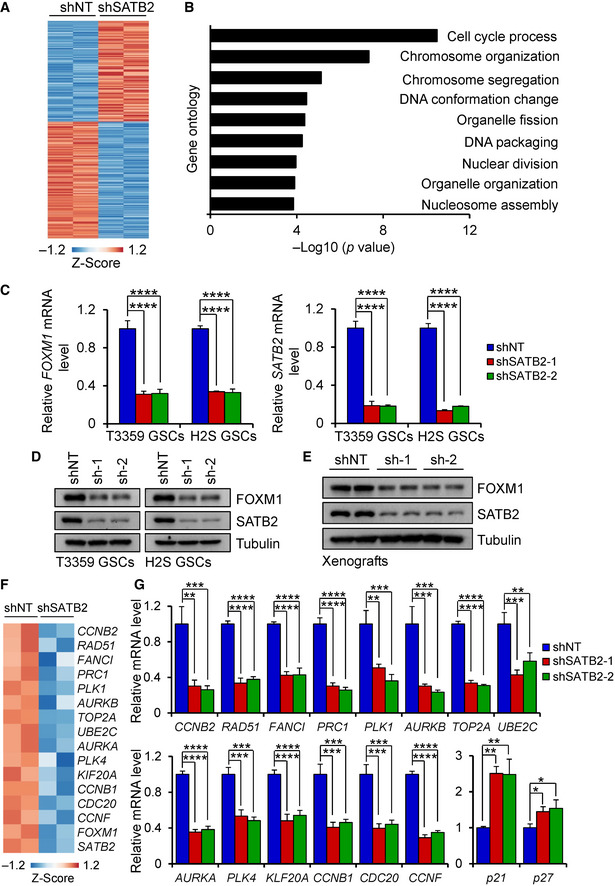
Heatmap analysis of differentially expressed genes between SATB2 silencing H2S GSCs (shSATB2) and control H2S GSCs (shNT). Differentially expressed genes had a 1.8‐fold or greater expression difference. Among differentially expressed genes, 160 are upregulated and 185 are downregulated.
Gene ontology analysis of genes downregulated in SATB2 silencing GSCs compared with control GSCs. The most significantly down‐regulated genes are associated with cell cycle progression and chromosome organization. P values were generated using the PANTHER tool (
http://pantherdb.org/ ).qPCR analysis of FOXM1 and SATB2 mRNA expression in GSCs transduced with shNT or shSATB2 (n = 3).
Immunoblot analysis of FOXM1 and SATB2 expression in GSCs transduced with shNT or shSATB2.
Immunoblot analysis of FOXM1 and SATB2 expression in tumor xenografts derived from T3359 GSCs expressing shNT or shSATB2.
Heatmap analysis of FOXM1 downstream targets between SATB2 silencing H2S GSCs (shSATB2) and control H2S GSCs (shNT) from microarray analysis. Differentially expressed genes had a 1.5‐fold or greater expression difference.
qPCR analysis of FOXM1 downstream targets in H2S GSCs transduced with shNT or shSATB2 (n = 3).
- A
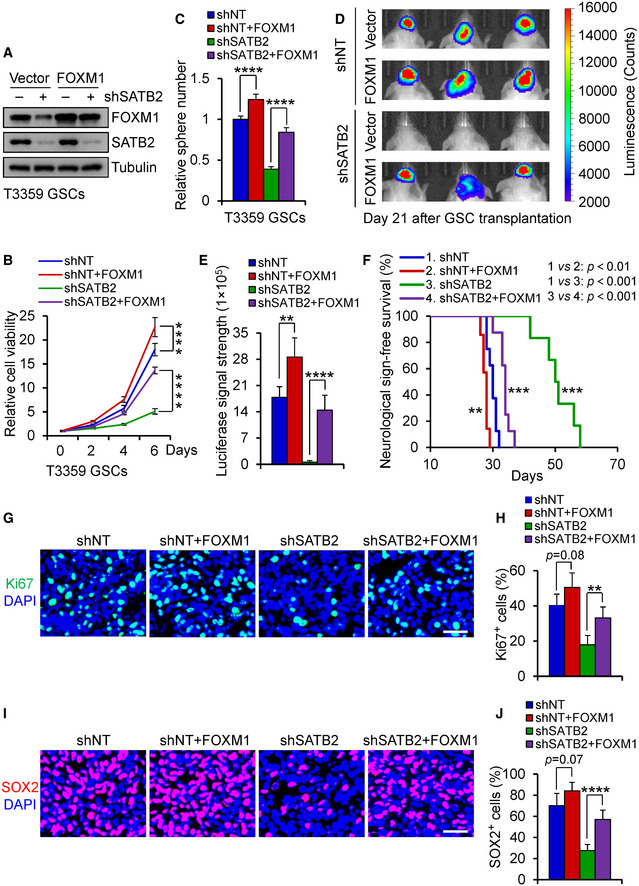
Immunoblot analysis of FOXM1 and SATB2 expression in T3359 GSCs transduced with FOXM1 or vector control in combination with shNT or shSATB2.
- B
Cell viability assay of T3359 GSCs transduced with FOXM1 or vector control in combination with shNT or shSATB2 (n = 5). Ectopic expression of FOXM1 restored the cell proliferation impaired by SATB2 silencing.
- C
Tumorsphere number of T3359 GSCs transduced with FOXM1 or vector control in combination with shNT or shSATB2 (n = 5). Ectopic expression of FOXM1 restored the tumorsphere formation of GSCs impaired by SATB2 silencing.
- D, E
In vivo bioluminescent images (D) or quantification (E) of the tumor xenografts derived from luciferase‐labeled T3359 GSCs transduced with FOXM1 or vector control in combination with shNT or shSATB2 (shNT: n = 5 mice; shNT + FOXM1: n = 4 mice; shSATB2: n = 5 mice; shSATB2 + FOXM1: n = 5 mice). Representative images on day 21 posttransplantation are shown. Ectopic expression of FOXM1 in GSCs expressing shSATB2 markedly restored GBM tumor growth.
- F
Kaplan–Meier survival curves of mice intracranially implanted with T3359 GSCs transduced with FOXM1 or vector control in combination with shNT or shSATB2 (shNT: n = 8 mice; shNT + FOXM1: n = 7 mice; shSATB2: n = 6 mice; shSATB2 + FOXM1: n = 8 mice). Median survival: shNT, 30 days; shNT + FOXM1, 28 days; shSATB2, 50.5 days; shSATB2 + FOXM1, 34 days. Ectopic expression of FOXM1 in GSCs expressing shSATB2 markedly attenuated the increased survival of mice bearing the GSC‐derived GBMs.
- G
Immunofluorescence of Ki67 (Green) in xenografts derived from T3359 GSCs transduced with FOXM1 or vector control in combination with shNT or shSATB2 (shNT: n = 6 tumors; shNT + FOXM1: n = 5 tumors; shSATB2: n = 6 tumors; shSATB2 + FOXM1: n = 6 tumors). Scale bar: 40 μm.
- H
Quantification of Ki67 positive cells in xenografts derived from T3359 GSCs transduced with FOXM1 or vector control in combination with shNT or shSATB2 (shNT: n = 6 tumors; shNT + FOXM1: n = 5 tumors; shSATB2: n = 6 tumors; shSATB2 + FOXM1: n = 6 tumors).
- I
Immunofluorescence of SOX2 (Red) in xenografts derived from T3359 GSCs transduced with FOXM1 or vector control in combination with shNT or shSATB2 (shNT: n = 6 tumors; shNT + FOXM1: n = 5 tumors; shSATB2: n = 6 tumors; shSATB2 + FOXM1: n = 6 tumors). Scale bar: 40 μm.
- J
Quantification of SOX2 positive cells in xenografts derived from T3359 GSCs transduced with FOXM1 or vector control in combination with shNT or shSATB2 (shNT: n = 6 tumors; shNT + FOXM1: n = 5 tumors; shSATB2: n = 6 tumors; shSATB2 + FOXM1: n = 6 tumors).
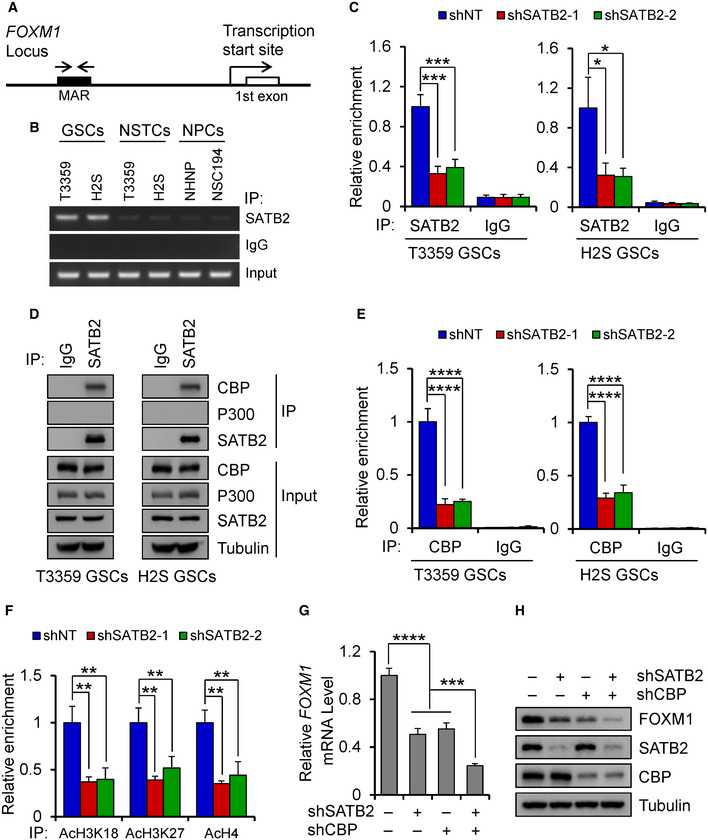
Schematic representation of MAR (Matrix Attachment Region) within FOXM1 locus. Arrows show the location of PCR primers for ChIP experiments.
ChIP assays with the SATB2 antibody or IgG using GSCs, NSTCs, and NPCs. PCR primers amplified a fragment flanking the MAR of FOXM1 gene locus. Note that abundant SATB2 binds to the MAR of FOXM1 gene locus in GSCs.
qPCR analysis of ChIP assays with the SATB2 antibody or IgG using GSCs transduced with shNT or shSATB2 (n = 3). PCR primers amplified a fragment flanking the MAR of FOXM1 gene locus. Silencing SATB2 decreased its binding amount to the MAR of FOXM1 gene locus.
CoIP assays of endogenous protein interaction in GSCs. Immunoblots of precipitated proteins or total lysates were performed using indicated antibodies. Note that SATB2 associates with endogenous CBP while not P300.
qPCR analysis of ChIP assays with the CBP antibody or IgG using GSCs transduced with shNT or shSATB2 (n = 3). PCR primers amplified a fragment flanking the MAR of FOXM1 gene locus. Silencing SATB2 reduced the binding of CBP to the MAR of FOXM1 gene locus.
qPCR analysis of ChIP assays with the indicated antibody (AcH3K18, AcH3K27, AcH4) using T3359 GSCs transduced with shNT or shSATB2 (n = 3). PCR primers amplified a fragment flanking the MAR of FOXM1 gene locus. Silencing SATB2 reduced acetylation of H3K18, H3K27, and H4 levels on the MAR of FOXM1 locus.
qPCR analysis of FOXM1 mRNA expression in T3359 GSCs transduced with shSATB2 or shCBP or both (n = 3).
Immunoblot analysis of FOXM1 expression in T3359 GSCs transduced with shSATB2 or shCBP or both.
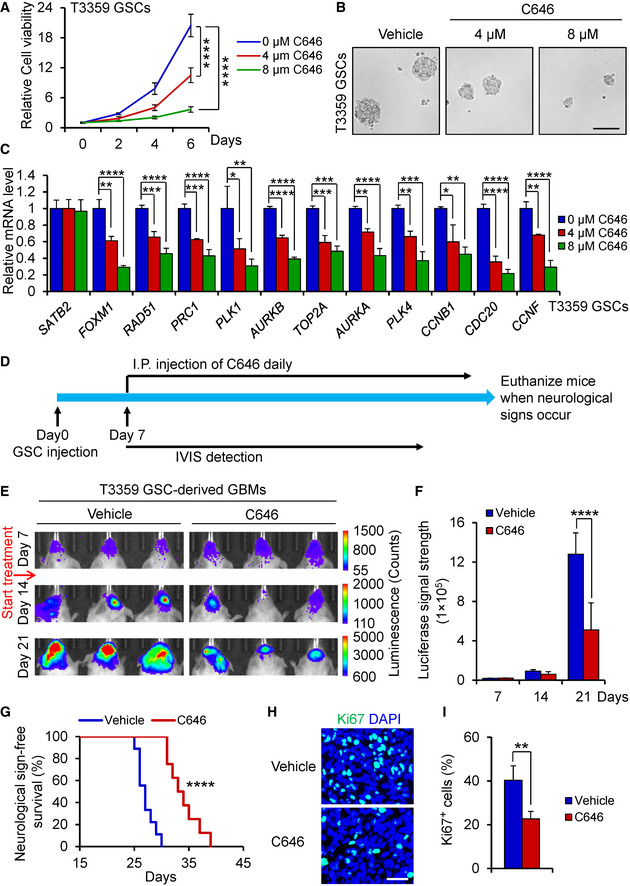
Cell viability of T3359 GSCs treated with indicated doses of C646 or the vehicle control (n = 5).
Tumorsphere images of T3359 GSCs treated with indicated doses of C646 or the vehicle control for 6 days. Scale bar: 100 μm.
qPCR analysis of SATB2, FOXM1, and FOXM1 downstream targets in T3359 GSCs treated with indicated doses of C646 or the vehicle control for 24 h (n = 3).
Schematic diagram showing the treatment of mice bearing the GSC‐derived xenografts with C646. After GSC transplantation for 7 days, mice were treated with C646 or the vehicle control daily. Mice were monitored by IVIS bioluminescent imaging and maintained until neurological signs occur.
Bioluminescent imaging of tumor growth in mice bearing xenografts derived from the luciferase‐labeled T3359 GSCs treated with C646 or the vehicle control at indicated days after GSC transplantation (n = 5 mice per group).
Quantification of tumor growth from (E) (n = 5 mice per group).
Kaplan–Meier survival curves of mice bearing T3359 GSC‐derived xenografts treated with C646 or the vehicle control (Vehicle control: n = 9 mice; C646: n = 8 mice). Median survival: Vehicle control, 27 days; C646, 33.5 days.
Immunofluorescence of Ki67 (Green) in T3359 GSC‐derived xenografts from mice treated with C646 or the vehicle control (n = 6 tumors per group). Scale bar: 40 μm.
Quantification of Ki67 positive cells in T3359 GSC‐derived xenografts from mice treated with C646 or the vehicle control (n = 6 tumors per group).
References
-
- Bao S, Wu Q, McLendon RE, Hao Y, Shi Q, Hjelmeland AB, Dewhirst MW, Bigner DD, Rich JN (2006) Glioma stem cells promote radioresistance by preferential activation of the DNA damage response. Nature 444: 756–760 - PubMed
Publication types
MeSH terms
Substances
Associated data
- Actions
Grants and funding
LinkOut - more resources
Full Text Sources
Molecular Biology Databases
Research Materials
Miscellaneous
