. 2021 Apr;230(2):629-640.
doi: 10.1111/nph.17048. Epub 2020 Dec 4.

Overcoming the trade-off between grain weight and number in wheat by the ectopic expression of expansin in developing seeds leads to increased yield potential

Affiliations

Overcoming the trade-off between grain weight and number in wheat by the ectopic expression of expansin in developing seeds leads to increased yield potential

Daniel F Calderini et al. New Phytol. 2021 Apr.

Abstract

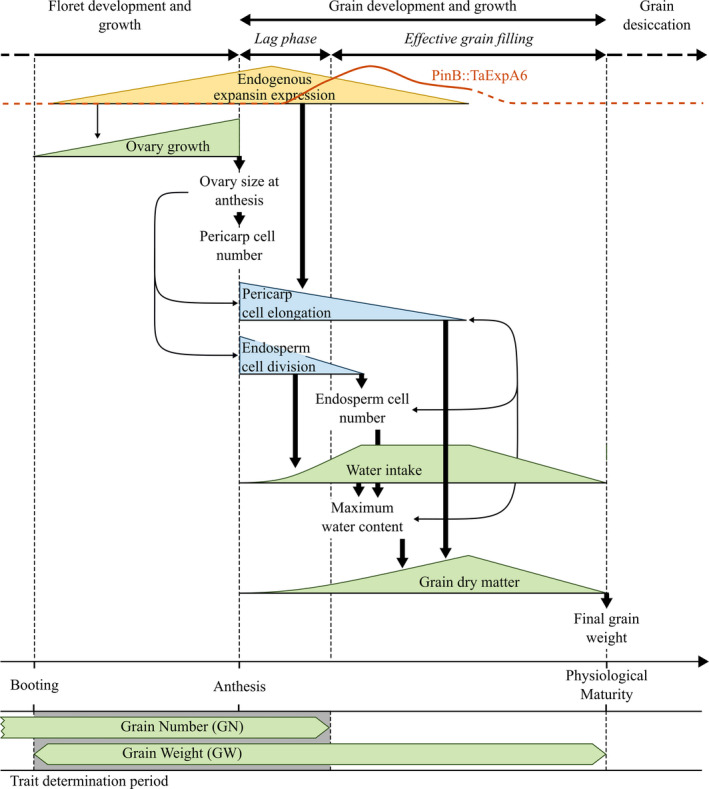
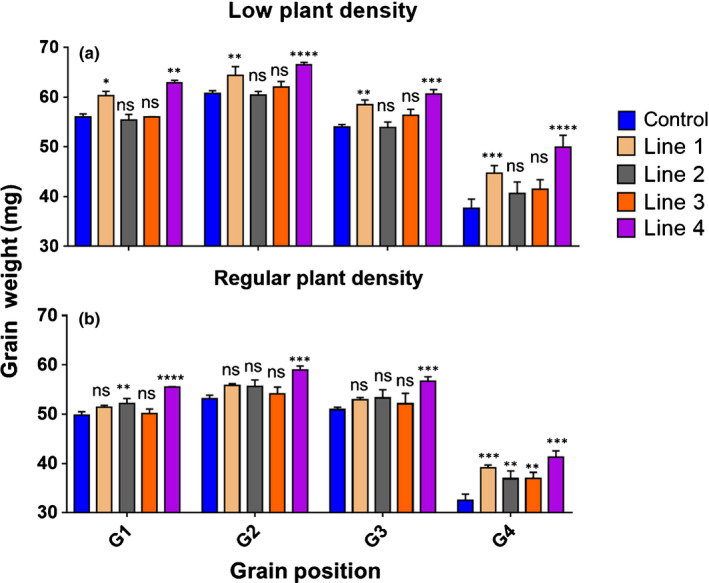
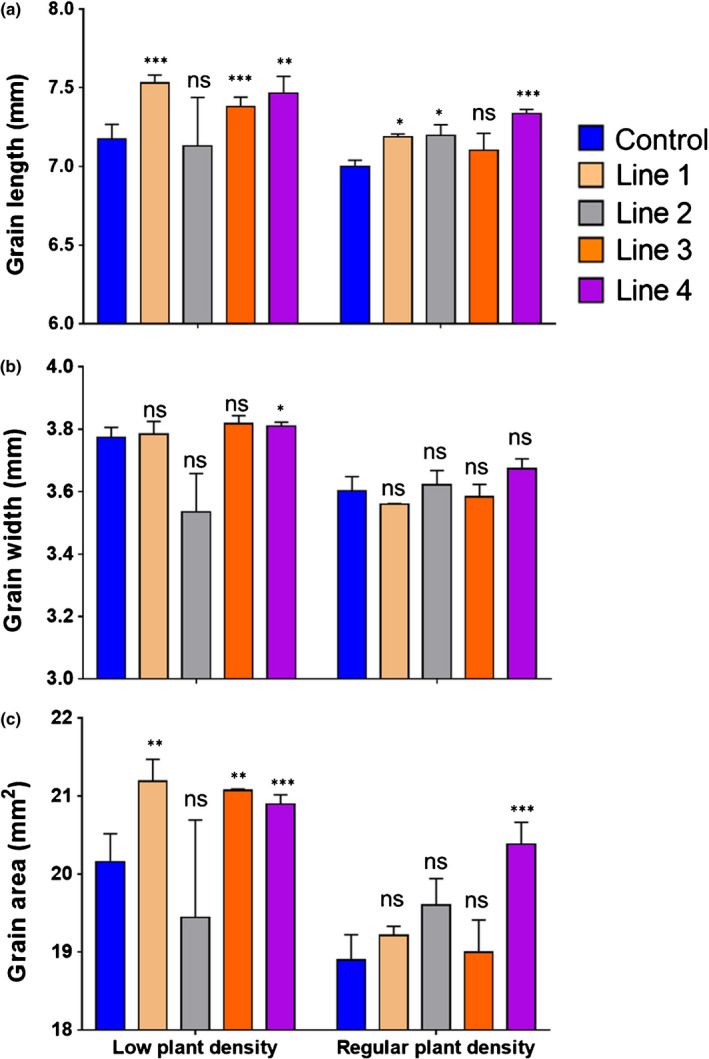
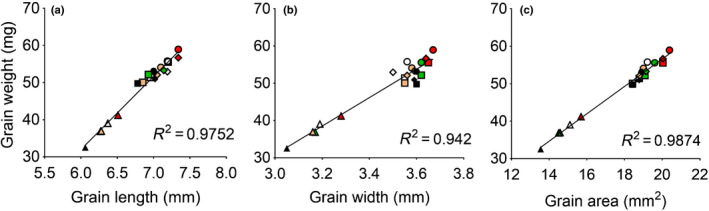
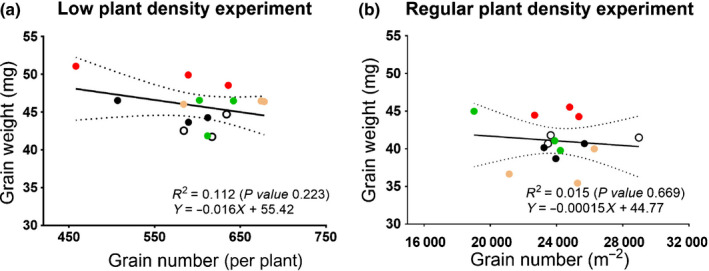
Wheat is the most widely grown crop globally, providing 20% of all human calories and protein. Achieving step changes in genetic yield potential is crucial to ensure food security, but efforts are thwarted by an apparent trade-off between grain size and number. Expansins are proteins that play important roles in plant growth by enhancing stress relaxation in the cell wall, which constrains cell expansion. Here, we describe how targeted overexpression of an α-expansin in early developing wheat seeds leads to a significant increase in grain size without a negative effect on grain number, resulting in a yield boost under field conditions. The best-performing transgenic line yielded 12.3% higher average grain weight than the control, and this translated to an increase in grain yield of 11.3% in field experiments using an agronomically appropriate plant density. This targeted transgenic approach provides an opportunity to overcome a common bottleneck to yield improvement across many crops.

Keywords: expansin protein; grain number; grain weight; grasses; pericarp; trade-off; transgenic.


Figures

Fig. 1
Fig. 1
Schematic description of processes and traits of grain weight determination in wheat from booting to maturity. The gene expression of the recombinant PinB::TaExpA6 and its apparent dynamic is shown. At the bottom of the scheme, the overlap between grain number and grain weight determination from booting to the end of the lag phase is shown. Wide arrows show the main links between processes/traits, and narrow arrows indicate indirect links between processes/traits.
Fig. 2
Fig. 2
Relative expression of TaExpA6 in grains at 5, 10, 15, 20 and 25 d after anthesis (DAA) in the field experiment at regular agronomical plant density of 300 m−2 assessed by quantitative reverse transcription PCR. Control line corresponds to spring wheat cv Fielder that has undergone the same tissue culture process as the transformed lines. Asterisks indicate significant differences by pairwise comparisons between each line and the control (Fisher’s least significant difference test post hoc): *, P < 0.10; **, P < 0.05; ***, P < 0.01; ****, P < 0.001; ns, not significant. All data are shown as mean and SE. mRNA, messenger RNA.
Fig. 3
Fig. 3
Expression and protein abundance of TaExpA6 in grains. Control line corresponds to spring wheat cv Fielder that has undergone the same tissue culture process as the transformed lines. (a) Relative messenger RNA (mRNA) levels of the TaExpA6 transgene assessed by quantitative reverse transcription PCR in grains at 15 d after anthesis (DAA) in the control and transformed lines 1, 2, 3 and 4 from experiment with low density (LD) and regular density (RD) planting. (b) Relative protein abundance as assessed by LC–MS/MS analysis at 15 DAA in the control and transgenic lines 1, 2, 3 and 4 at regular agronomical plant density. Asterisks indicate significant differences by pairwise comparisons between each line and the control (Fisher’s least significant difference test post hoc): *, P < 0.10; **, P < 0.05; ***, P < 0.01; ****, P < 0.001; ns, not significant. All data are shown as mean and SE.
Fig. 4
Fig. 4
Individual grain weight. Grain weight at grain position 1 (G1), 2 (G2), 3 (G3) and 4 (G4) in the control and TaExpA6 transgenic lines 1, 2, 3 and 4 at (a) low plant density and (b) regular plant density. The control line corresponds to spring wheat cv Fielder that has undergone the same tissue culture process as the transformed lines. Asterisks indicate significant differences evaluated by pairwise comparisons between each line and the Control (Fisher’s least significant difference test post hoc): *, P < 0.10; **, P < 0.05; ***, P < 0.01; ****, P < 0.001; ns, not significant. All data are shown as mean and SE.
Fig. 5
Fig. 5
Grain length, width, and area at grain position 2 (G2) in wild‐type and transformed wheat lines. Grain dimensions were evaluated in control and four TaExpA6 transgenic lines (lines 1–4) in field experiments at low plant density of 44 m−2 and regular agronomical plant density of 300 m−2. (a) Grain length, (b) grain width and (c) grain area. The control line corresponds to spring wheat cv Fielder that has undergone the same tissue culture process as the transformed lines. Asterisks indicate significant differences evaluated by pairwise comparisons between the control and each transgenic line (Fisher’s least significant difference test post hoc): *, P < 0.10; **, P < 0.05; ***, P < 0.01; ****, P < 0.001; ns, not significant. All data are shown as mean and SE.
Fig. 6
Fig. 6
Association between individual grain weight and dimensions. Grain weight and (a) grain length, (b) grain width, and (c) grain area of grain positions 1 (G1: circle), 2 (G2: square), 3 (G3: rhombus) and 4 (G4: triangle) from central spikelets of the spike in the control (black) and transgenic lines 1 (white), 2 (green), 3 (orange) and 4 (red) recorded from the field experiment at plant density of 300 m−2.
Fig. 7
Fig. 7
Trade‐off between grain weight and grain number. Relationship between grain weight and grain number of the control line (black circles) and transgenic lines 1 (open white circles), 2 (green circles), 3 (orange circles), and 4 (red circles) in the (a) low plant density and (b) regular agronomical plant density experiments. The regression line (continuous black line) and two confidence bands surrounding the best‐fit line that define the confidence interval (dotted lines) are shown.

Comment in

  • Expanding wheat yields with expansin.
    Cosgrove DJ. Cosgrove DJ. New Phytol. 2021 Apr;230(2):403-405. doi: 10.1111/nph.17245. Epub 2021 Mar 2. New Phytol. 2021. PMID: 33650686 No abstract available.

References

    1. Acreche MM, Slafer GA. 2006. Grain weight response to increases in number of grains in wheat in a Mediterranean area. Field Crops Research 98: 52–59.
    1. Appels R, Eversole K, Feuillet C, Keller B, Rogers J, Stein N, Pozniak CJ, Choulet F, Distelfeld A, Poland J et al. 2018. Shifting the limits in wheat research and breeding using a fully annotated reference genome. Science 361: eaar7191. - PubMed
    1. Bae JM, Kwak MS, Noh SA, Oh MJ, Kim YS, Shin JS. 2014. Overexpression of sweetpotato expansin cDNA (IbEXP1) increases seed yield in Arabidopsis. Transgenic Research 23: 657–667. - PubMed
    1. Borrás L, Slafer GA, Otegui ME. 2004. Seed dry weight response to source–sink manipulations in wheat, maize and soybean: a quantitative reappraisal. Field Crops Research 86: 131–146.
    1. Brinton J, Simmonds J, Minter F, Leverington‐Waite M, Snape J, Uauy C. 2017. Increased pericarp cell length underlies a major quantitative trait locus for grain weight in hexaploid wheat. New Phytologist 215: 1026–1038. - PubMed

Publication types

LinkOut - more resources