

FFAT motif phosphorylation controls formation and lipid transfer function of inter-organelle contacts
- PMID: 33124732
- PMCID: PMC7705450
- DOI: 10.15252/embj.2019104369
FFAT motif phosphorylation controls formation and lipid transfer function of inter-organelle contacts
Abstract
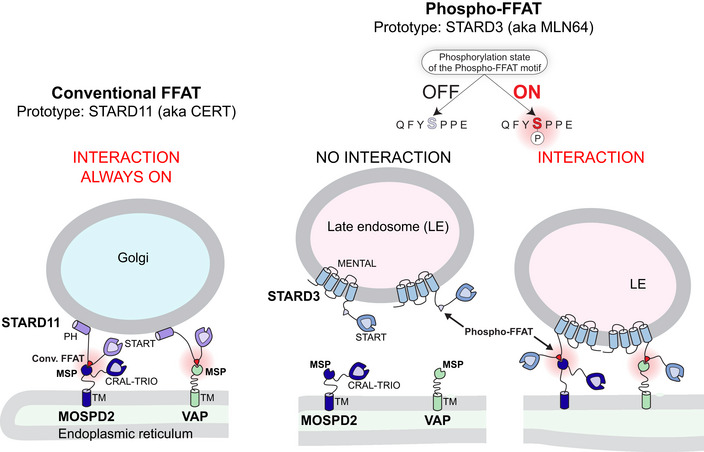
Organelles are physically connected in membrane contact sites. The endoplasmic reticulum possesses three major receptors, VAP-A, VAP-B, and MOSPD2, which interact with proteins at the surface of other organelles to build contacts. VAP-A, VAP-B, and MOSPD2 contain an MSP domain, which binds a motif named FFAT (two phenylalanines in an acidic tract). In this study, we identified a non-conventional FFAT motif where a conserved acidic residue is replaced by a serine/threonine. We show that phosphorylation of this serine/threonine is critical for non-conventional FFAT motifs (named Phospho-FFAT) to be recognized by the MSP domain. Moreover, structural analyses of the MSP domain alone or in complex with conventional and Phospho-FFAT peptides revealed new mechanisms of interaction. Based on these new insights, we produced a novel prediction algorithm, which expands the repertoire of candidate proteins with a Phospho-FFAT that are able to create membrane contact sites. Using a prototypical tethering complex made by STARD3 and VAP, we showed that phosphorylation is instrumental for the formation of ER-endosome contacts, and their sterol transfer function. This study reveals that phosphorylation acts as a general switch for inter-organelle contacts.
Keywords: cholesterol; inter-organelle contact; lipid transfer protein; regulation; small linear motif.
© 2020 The Authors. Published under the terms of the CC BY NC ND 4.0 license.
Conflict of interest statement
The authors declare that they have no conflict of interest.
Figures
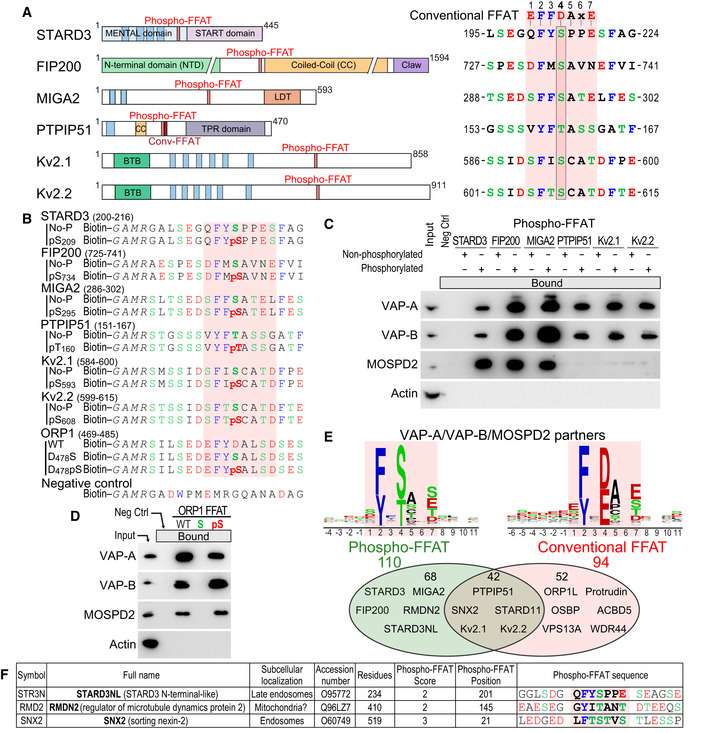
Schematic representation of STARD3, FIP200, MIGA2, PTPIP51, KCNB1 (Kv2.1), and KCNB2 (Kv2.2) proteins and sequence of their Phospho‐FFAT motif (7 core residues and 4 upstream and downstream residues). Note that the 4th position of the FFAT (boxed) of these proteins is occupied by a serine or a threonine residue while conventional FFATs have an aspartic acid. Blue rectangles represent transmembrane helices. TPR: tetratrico peptide repeat; LDT: lipid droplet targeting domain; BTB: potassium channel tetramerization‐type BTB domain.
Sequence of the peptides used for the pull‐down assays. The peptides are composed of an amino‐terminal biotin, a linker sequence and the FFAT sequence of STARD3 (residues 200–216), FIP200 (residues 725–741), MIGA2 (residues 286–302), PTPIP51 (residues 151–167), Kv2.1 (residues 584–600), Kv2.2 (residues 599–615), and ORP1 (residues 469–485) either without or with a phosphorylated residue (serine or threonine) at position 4 of the core FFAT motif. The negative control peptide is composed of a random sequence.
Western blot analysis of proteins pulled down using the peptides described in (B). The input fraction corresponds to HeLa cell total protein extract. Bound proteins were analyzed using anti‐VAP‐A, anti‐VAP‐B and anti‐MOSPD2 antibodies. Actin was used as a loading control.
Western blot analysis of proteins pulled down using peptides comprising WT and mutant (D478S and D478pS) ORP1 FFAT sequence peptides described in (B). Bound proteins were analyzed using anti‐VAP‐A, anti‐VAP‐B, and anti‐MOSPD2 antibodies. Actin was used as a loading control.
Venn diagram of VAPs and/or MOSPD2 partners with FFAT scores between 0 and 3. Proteins with a Phospho‐FFAT and a conventional FFAT are shown in green and red, respectively. A total of 42 proteins possesses both a Phospho and a conventional FFAT. Consensus sequences of the 110 Phospho‐FFAT (left) and 94 conventional FFAT motifs (right) identified are shown as sequence logos.
List of selected VAP‐A, VAP‐B, or MOSPD2 partners having a potential Phospho‐FFAT motif. For a full list, see Table EV2.
- A
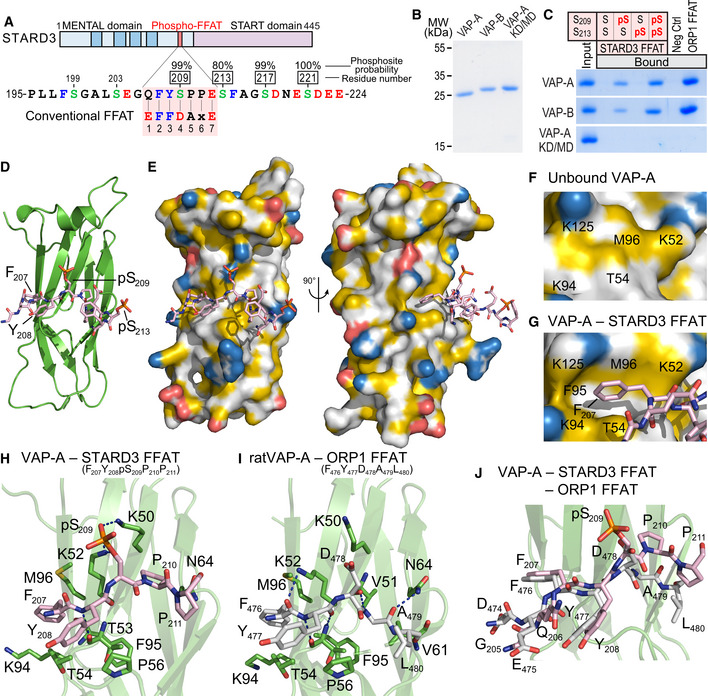
Schematic representation of STARD3. Transmembrane helices in the MENTAL domain are in dark blue. The Phospho‐FFAT motif of STARD3 and the conventional FFAT motif sequences are aligned and highlighted in pink. Upper numbers correspond to the position of residues in STARD3. Lower numbers correspond to the position of residues in the FFAT sequence as described in (Loewen et al, 2003). Acidic (D and E), alcoholic (S and T), and aromatic (F and Y) residues are in red, green, and blue, respectively; the other residues are in black. Phosphorylated serines identified by LC/MS/MS are boxed, and the phosphosite probability determined with PhosphoRS is indicated.
- B
Coomassie Blue staining of the recombinant wild‐type MSP domains of VAP‐A and VAP‐B, and of the KD/MD mutant of VAP‐A, after SDS–PAGE.
- C
Recombinant MSP domains pulled down with peptides corresponding to the Phospho‐FFAT motif of STARD3 (unphosphorylated; monophosphorylated on S209 or S213; bi‐phosphorylated on S209 and S213), and with the control peptides were revealed by Coomassie Blue staining. The recombinant proteins subjected to the assay are showed in the input fraction.
- D, E
Structure of the MSP domain of VAP‐A in complex with a Phospho‐FFAT motif. Ribbon diagram (D) and surface representation (E) of the MSP domain of VAP‐A in complex with the Phospho‐FFAT of STARD3 depicted in stick model. The protein surface is colored according to the YRB scheme, showing hydrophobic, negatively and positively charged atoms in yellow, red, and blue, respectively; the other atoms are in white (Hagemans et al, 2015).
- F, G
Close‐up view of the hydrophobic pocket region in the unbound (F) and the Phospho‐FFAT‐bound (G) VAP‐A; residues of VAP‐A constituting the pocket are indicated.
- H
Close‐up view of the structure near the Phospho‐FFAT motif highlighting critical residues (in stick model) of human VAP‐A present in the binding interface.
- I
Close‐up view of the structure near the conventional FFAT of ORP1 as described in (PDBID: 1Z9O; Kaiser et al, 2005), highlighting critical residues of rat VAP‐A involved in the interaction. The nomenclature for rat VAP‐A residues is based on the UniProt sequence (Q9Z270) and not on the PDB file 1Z9O.
- J
Superposition of the two structures shown in (H) and (I) showing the distinct conformations of the C‐terminal parts of each peptide.
- A–D
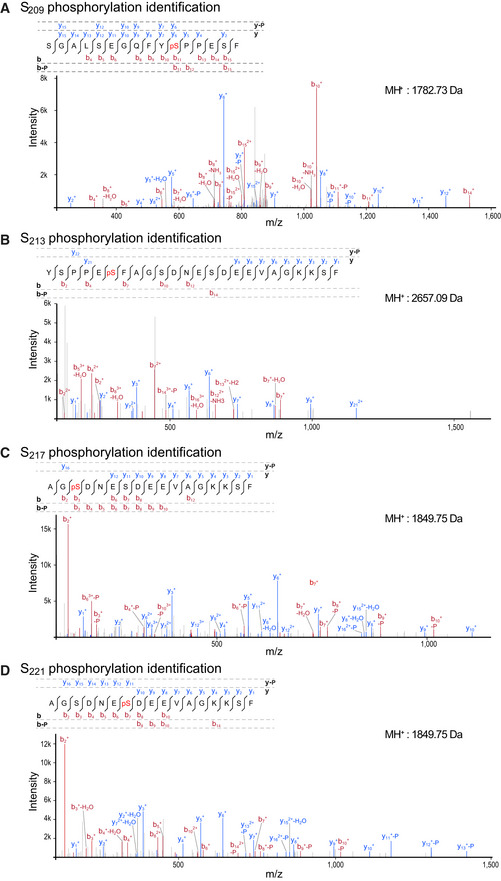
MS/MS spectrum of peptides phosphorylated on S209 (A), S213 (B), S217 (C), and S221 (D). The molecular weight of peptides is indicated on the right. Spectra are an assembly of ions produced by collision‐induced dissociation of the precursor peptides. Fragmentation occurs preferentially at peptide bonds to generate b and y ions, which extend from the amino and carboxy terminus, respectively. The precursor peptide sequence and the different b and y ions identified in the spectrum are shown above. b and y ion peaks are shown in red and blue, respectively. b and y ions with the highest intensity are labeled on the spectrum. Neutral mass losses of H2O, NH3, and H3PO4 (P) are indicated. Analysis of y and b ion fragmentation patterns showed that S209 (A), S213 (B), S217 (C), and S221 (D) were phosphorylated in vivo.
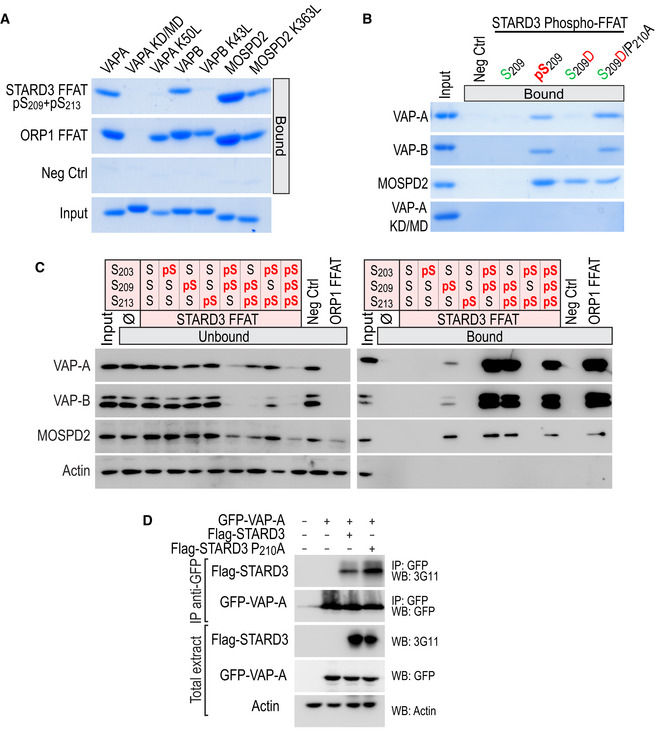
Interaction of VAP‐A K50L, VAP‐B K43L, and MOSPD2 K363L mutants with conventional and Phospho‐FFAT motif. Wild‐type and mutant MSP domains were pulled down with phosphorylated STARD3 (pS209 + pS213), ORP1 FFAT peptides, and with the negative control peptide. The input fraction corresponds to the recombinant proteins used in the assay. Input and bound proteins were revealed by Coomassie Blue staining. Note that lysine K50 in VAP‐A and K43 in VAP‐B are required for the interaction with a Phospho‐FFAT, and not with a conventional FFAT.
Interaction of VAP‐A, VAP‐B, MOSPD2 with phosphomimetic STARD3 Phospho‐FFAT motif. Wild‐type and mutant MSP domains were pulled down with unphosphorylated, phosphorylated (pS209), phosphomimetic (S209D and S209D/P210A), and with the negative control peptide. The input fraction corresponds to the recombinant proteins used in the assay. Input and bound proteins were revealed by Coomassie Blue staining. Acidic (D) or phosphorylated residues (pS), and alcoholic (S) residues are in red and green, respectively; the other residues are in black.
STARD3 and VAP‐A/VAP‐B or MOSPD2 complex formation requires a unique phosphorylation of the Phospho‐FFAT motif. Western blot analysis of proteins pulled down using the peptides described in Fig EV3A. The input fraction corresponds to the HeLa cell total protein extract. The streptavidin beads were first coupled to the indicated biotinylated peptides, or left without peptide (ø). The soluble fraction after the incubation of the protein extract with the beads (Unbound; left), and proteins attached to the beads (Bound; right) were analyzed by Western blot using anti‐VAP‐A, anti‐VAP‐B, and anti‐MOSPD2 antibodies. Actin was used as a loading control.
Immunoprecipitation (GFP‐Trap) experiments between GFP‐tagged VAP‐A and Flag‐tagged STARD3 (WT and P210A mutant). Approximatively 15 µg of total protein extracts was analyzed by Western blot using anti‐STARD3, anti‐GFP, and anti‐Actin antibodies. Immunoprecipitated material was analyzed using anti‐STARD3 and anti‐GFP antibodies.
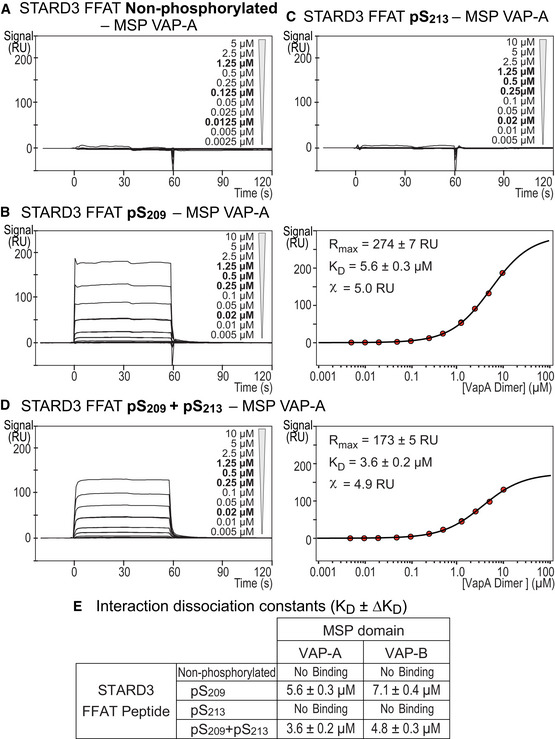
- A–D
Surface Plasmon resonance analysis of the MSP domain of VAP‐A binding onto immobilized unphosphorylated (A), monophosphorylated pS209 (B) and pS213 (C), and bi‐phosphorylated pS209 + pS213 (D) STARD3 FFAT peptides. Representative sensorgrams resulting from the interaction between the MSP domain of VAP‐A injected at different concentrations and the different FFAT peptides are shown in (A), (B left), (C), and (D left). Binding curves display the SPR signal (RU) as a function of time. Some samples were measured twice (concentrations printed in bold). Signal obtained for the negative control peptide immobilized on another flow cell is systematically subtracted, as well as the bulk effect recorded with buffer only. Steady‐state analysis of the interaction between pS209 (B right) and pS209 + pS213 (D right) STARD3 FFAT peptide, and the MSP domain of VAP‐A. Equilibrium responses (Req) extracted from the left panel in association phase were plotted as a function of the dimeric MSP domain of VAP‐A concentration, and fitted with a Langmuir binding model.
- E
Dissociation constants between peptides corresponding to different kind of FFAT motifs and the MSP domains of VAP‐A and VAP‐B. The kinetic experiments were performed at 25°C in Tris–HCl 50 mM, pH 7.5, NaCl 75 mM buffer supplemented with 0.005% (v/v) surfactant polysorbate 20 (P20, GE Healthcare). Mean of n independent experiments: n = 2 for pS209 and pS209 + pS213; 3 for pS213; and 4 for the non‐phosphorylated FFAT. Uncertainties are obtained from the standard deviation considering a t‐distribution coefficient for a risk factor of 32%.
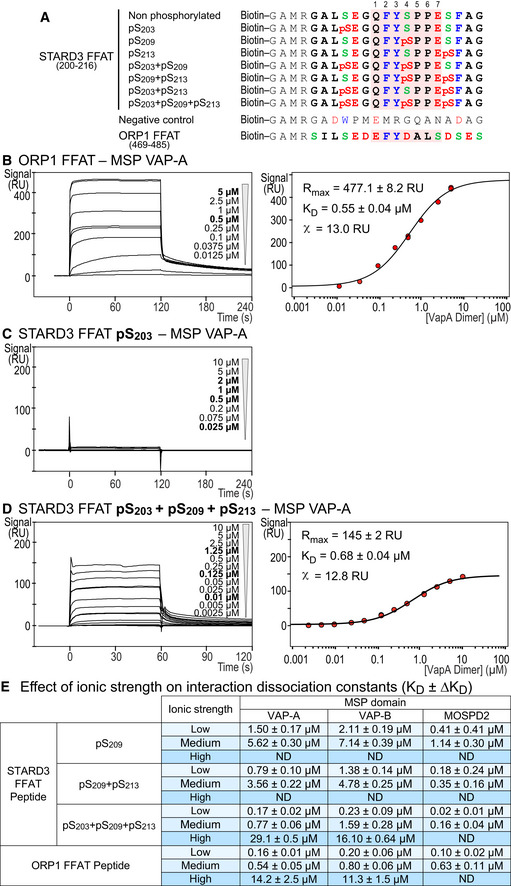
- A
Sequence of the peptides used for SPR and the pull‐down assays. The peptides are composed of an amino‐terminal biotin, a linker sequence (GAMR) and the FFAT sequence of STARD3 (residues 200–216) either without phosphorylated serine or with combinations of phosphorylated serines (positions 203, 209, and 213 in STARD3 protein). The core FFAT sequence (residues 1–7) is highlighted in red. ORP1 FFAT peptide corresponding to residues 469–485 (Accession Number Q9BXW6‐1), and a random sequence (control peptide) are used as positive and negative control, respectively. Acidic (D and E) or phosphorylated serine (pS), alcoholic (S and T), and aromatic (F, W, and Y) residues are in red, green and blue, respectively; the other residues are in black.
- B–D
SPR analysis of the MSP domain of VAP‐A binding onto immobilized ORP1 FFAT peptide (B), pS203 (C) or pS203 + pS209 + pS213 (D) STARD3 FFAT peptides. Representative sensorgrams resulting from the interaction between the MSP domain of VAP‐A injected at different concentrations and the different STARD3 FFAT peptides are shown in (B left), (C), and (D left). Binding curves display the SPR signal (RU) as a function of time. Concentrations printed in bold indicate samples measured twice. Steady‐state analysis of the interaction between ORP1 FFAT (B right) and pS203 + pS209 + pS213 (D right) STARD3 FFAT peptide and the MSP domain of VAP‐A. Equilibrium responses (R eq) extracted from the left panel were plotted as a function of the dimeric MSP domain of VAP‐A concentration, and fitted with a Langmuir binding model.
- E
Interaction dissociation constants between the different FFAT peptides and the MSP domains of VAP‐A, VAP‐B, and MOSPD2. MSP concentrations are expressed as dimer for VAP‐A and VAP‐B, and monomer for MOSPD2. The different ionic strength correspond to the following buffers (pH 7.5): low: Tris–HCl 20 mM, NaCl 75 mM; medium: Tris–HCl 50 mM, NaCl 75 mM; high: Tris–HCl 50 mM, NaCl 300 mM. Buffers were supplemented with P20 (0.005% v/v). ND: not determined. Mean values of n independent experiments: n = 2 for pS209, pS209 + pS213, and S203 + pS209 + pS213 (high); 4 for pS203 + pS209 + pS213 (low), ORP1 (low and high), and pS203 + pS209 + pS213 (medium) with MOSPD2; 6 for pS203 + pS209 + pS213 (medium) with VAP‐A and VAP‐B; 12, 11, and 7 for ORP1 (medium) with VAP‐A, VAP‐B, and MOSPD2, respectively. Uncertainties are obtained from the standard deviation considering a t‐distribution coefficient for a risk factor of 32%.
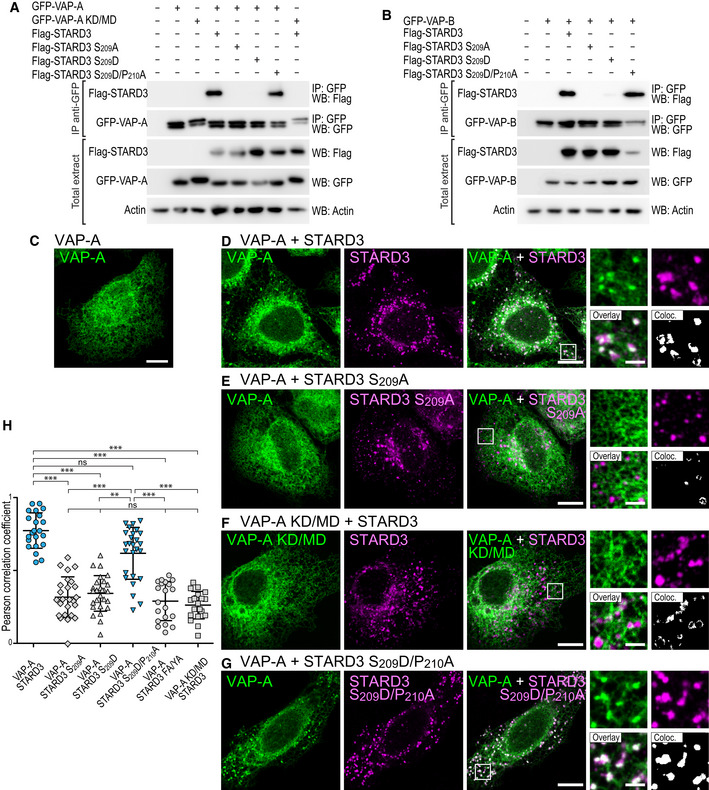
- A, B
Binding assays. Immunoprecipitation (GFP‐Trap) experiments between GFP‐tagged VAP‐A (WT and KD/MD mutant; A), VAP‐B (B) and Flag‐tagged STARD3 (WT and S209A, S209D, and S209D/P210A mutants). Please note that the mutations modify the FFAT and Phospho‐FFAT scores of this region of STARD3: compared to WT STARD3 (Phospho‐FFAT: 2.5; conventional FFAT: 6.5), the STARD3 S209A, mutant has both low Phospho‐FFAT and FFAT scores (6.5), the S209D mutant has a high conventional FFAT score (2.5) but a low Phospho‐FFAT score (6.5), and the double mutant has a conventional FFAT score of 1.5 and a Phospho‐FFAT score of 5.5. Approximatively 5 µg of total protein extracts was analyzed by Western blot using anti‐Flag, anti‐GFP, and anti‐Actin antibodies. Immunoprecipitated material was analyzed using anti‐Flag and anti‐GFP antibodies.
- C–G
Recruitment assays. GFP‐VAP‐A (C, D, E, G; green) and GFP‐VAP‐A KD/MD‐expressing cells (F; green) were left untransfected (C) or transfected with Flag‐STARD3 (D, F), Flag‐STARD3 S209A (E), and Flag‐STARD3 S209D/P210A (G), and labeled using anti‐Flag (magenta) antibodies. The subpanels on the right are higher magnification (3.5×) images of the area outlined in white. The Overlay panel shows merged green and magenta images. The Coloc panel displays a colocalization mask on which pixels where the green and the magenta channels co‐localize are shown in white. Scale bars: 10 µm. Inset scale bars: 2 µm.
- H
Pearson’s correlation coefficients between VAP‐A (WT or KD/MD mutant) and STARD3 (WT or S209A, S209D, S209D/P210A, FA/YA mutants) staining are shown. Each dot represents a single cell (number of cells: VAP‐A–STARD3: 22; VAP‐A–STARD3 S209A: 25; VAP‐A–STARD3 S209D: 27; VAP‐A–STARD3 S209D/P210A: 26; VAP‐A–STARD3 FA/YA: 20; VAP‐A KD/MD–STARD3: 20, from at least three independent experiments). Means and error bars (SD) are shown. Kruskal–Wallis with Dunn’s multiple comparison test (**P < 0.01; ***P < 0.001).
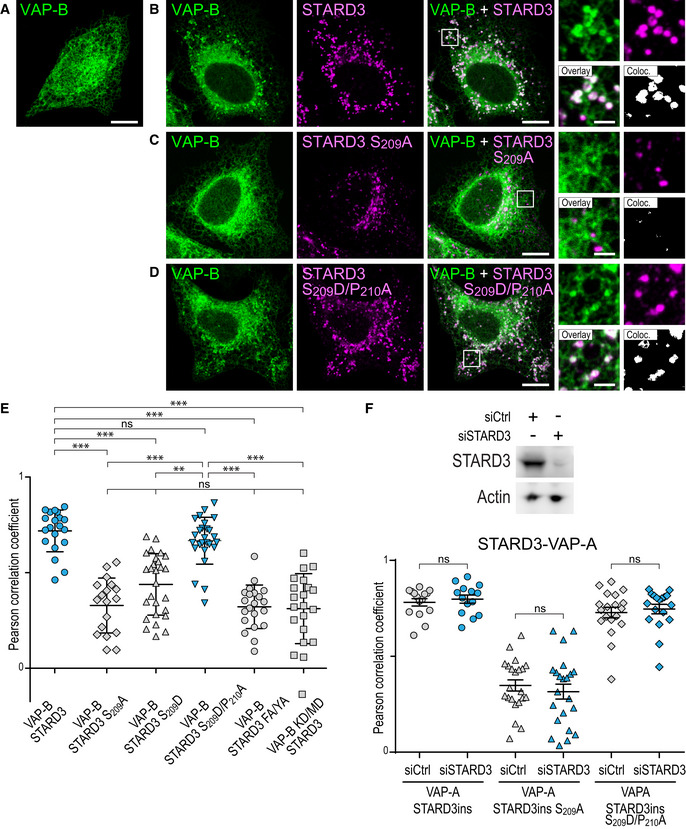
- A–D
GFP‐VAP‐B (A–D; green)‐expressing cells were left untransfected (A) or transfected with Flag‐STARD3 (B), Flag‐STARD3 S209A (C), and Flag‐STARD3 S209D/P210A (D), and labeled using anti‐Flag (magenta) antibodies. The subpanels on the right are higher magnification (3.5×) images of the area outlined in white. The Overlay panel shows merged green and magenta images. The Coloc panel displays a colocalization mask on which pixels where the green and the magenta channels co‐localize are shown in white. Scale bars: 10 µm. Inset scale bars: 2 µm.
- E
Pearson’s correlation coefficients between VAP‐B (WT and KD/MD) and STARD3 (WT, S209A, S209D, S209D/P210A or FA/YA mutants) staining are shown. Each dot represents a single cell (number of cells: VAP‐B–STARD3: 20; VAP‐B–STARD3 S209A: 18; VAP‐B–STARD3 S209D: 27; VAP‐B–STARD3 S209D/P210A: 26; VAP‐B–STARD3 FA/YA: 21; VAP‐B KD/MD–STARD3: 21, from at least three independent experiments). Means and error bars (SD) are shown. Kruskal–Wallis with Dunn’s multiple comparison test (**P < 0.01; ***P < 0.001).
- F
Top: Western blot analysis of protein extracts from HeLa cells transfected with control siRNAs (siCtrl) and siRNAs targeting STARD3 (siSTARD3) using anti‐STARD3 and anti‐Actin antibodies. Bottom: After siRNA transfection, the cells were transfected with GFP‐VAP‐A and STARD3 (WT, STARD3 S209A, and STARD3 S209D/P210A). STARD3 expression vectors contained a cDNA with silent mutations rendering it insensitive to siRNAs. The cells were labeled using anti‐STARD3 antibodies. Pearson’s correlation coefficients between STARD3 (WT, STARD3 S209A, and STARD3 S209D/P210A) and VAP‐A staining are shown. Note that the colocalization between VAP‐A and STARD3 is similar in the presence and absence of endogenous STARD3. Means and error bars (SD) are shown. Kruskal–Wallis with Dunn’s multiple comparison test (ns: P ≥ 0.05).
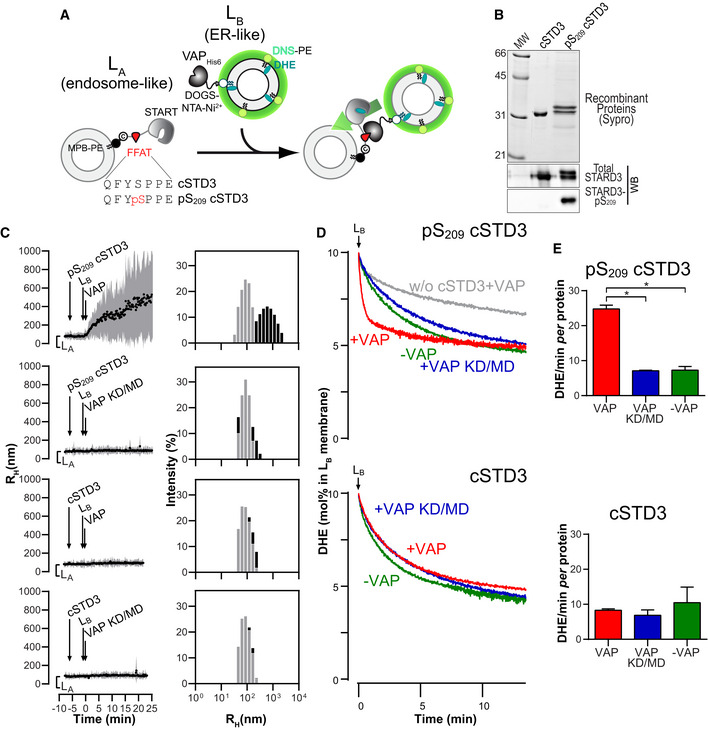
Description of the experimental strategy. LA liposomes (endosome‐like) are decorated with cSTD3 or pS209 cSTD3 owing to covalent links with MPB‐PE (1.2‐dioleoyl‐sn‐glycero‐3‐phosphoethanolamine‐N‐[4‐(p‐maleimidophenyl) butyramide]), and mixed with LB liposomes (ER‐like) covered by VAPHIS6 attached to DOGS‐NTA‐Ni2+ (1.2‐dioleoyl‐sn‐glycero‐3‐[(N‐(5‐amino‐1‐carboxypentyl) iminodiacetic acid) succinyl], nickel salt). For dehydroergosterol (DHE) transport experiment, LB liposomes also contain DHE and a dansyl‐phosphatidylethanolamine (DNS‐PE). The transport of DHE from LB to LA liposomes is followed by measuring the change in FRET from DHE to DNS‐PE.
SDS–PAGE gel and Western blot analysis of purified cSTD3 and pS209 cSTD3 proteins. Top: The gel was stained with SYPRO Orange to visualize proteins and molecular weight markers. Bottom: Two similar gels were blotted onto nitrocellulose and analyzed for the presence of total and STARD3‐pS209 using specific antibodies.
Aggregation assays. LA liposomes (50 µM total lipids) were incubated for 5 min with cSTD3 or pS209 cSTD3 (380 nM). Then, LB liposomes (50 µM total lipids) and VAP‐AHIS6 or VAP‐A KD/MDHIS6 (700 nM) were successively added. Left panels: mean radius (black dots) and polydispersity (shaded area) over time. Right panels: size distribution before (gray bars) and after the reaction (black bars).
DHE transport assay. DOPC (1.2‐dioleoyl‐sn‐glycero‐3‐phosphocholine) liposomes (62.5 µM total lipids, LA) containing 3 mol% MPB‐PE were mixed with cSTD3 or pS209 cSTD3 (475 nM). After 5 min, liposomes (DOPC/DOGS‐NTA‐Ni2+/DNS‐PE/DHE liposomes 77.5/10/2.5/10 mol/mol, 62.5 µM total lipids, LB), covered or not with 1 µM of VAPHIS6 or VAP‐A KD/MDHIS6, were added. FRET between DHE and DNS‐PE in the LB liposomes diminishes as DHE is transported toward LA liposomes. The signal was converted into amount of DHE present in LB liposomes (in mol%).
Initial DHE transport rate measured with cSTD3 or pS209 cSTD3 in the presence or absence of VAP‐A HIS6 or VAP‐A KD/MDHIS6. Data are represented as mean ± SEM (n = 3 for cSTD3‐VAP and n = 4 for all other data). Mann–Whitney test (*P < 0.05).
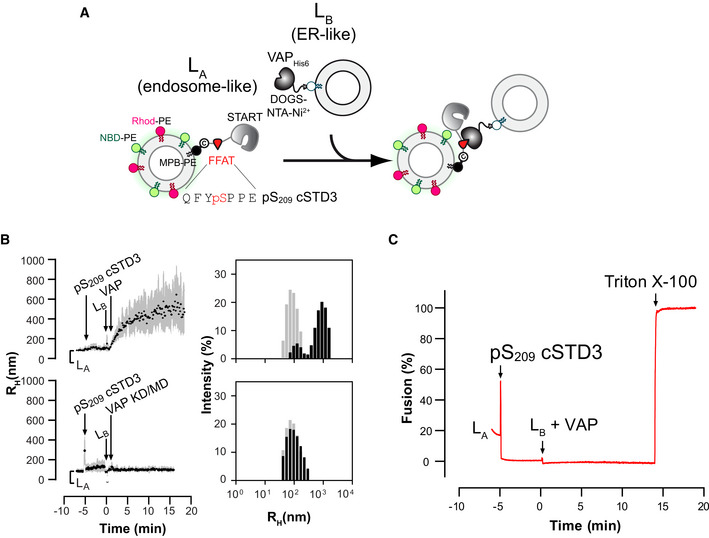
Description of the experimental strategy. LA liposomes (endosome‐like) are decorated with pS209 cSTD3 owing to covalent links with MPB‐PE (1.2‐dioleoyl‐sn‐glycero‐3‐phosphoethanolamine‐N‐[4‐(p‐maleimidophenyl) butyramide]), and mixed with LB liposomes (ER‐like) covered by VAPHIS6 attached to DOGS‐NTA‐Ni2+ (1.2‐dioleoyl‐sn‐glycero‐3‐[(N‐(5‐amino‐1‐carboxypentyl) iminodiacetic acid) succinyl]; nickel salt). LA liposomes contain the FRET pair NBD‐PE (1,2‐dioleoyl‐sn‐glycero‐3‐phosphoethanolamine‐N‐(7‐nitro‐2‐1,3‐benzoxadiazol‐4‐yl)) and Rhod‐PE (1,2‐dioleoyl‐sn‐glycero‐3‐phosphoethanolamine‐N‐(lissamine rhodamine B sulfonyl)). The fusion of LA and LB liposomes is followed by measuring an increase in NBD‐PE fluorescence, which is initially quenched due to FRET with Rhod‐PE. The percentage of fusion is equal to 100 × ((F − F 0)/(F max − F 0)) where F 0 is the signal measured before the addition of LB liposomes decorated with VAP‐AHis6, and F max is the signal measured after adding Triton X‐100 (1% v/v final concentration).
Aggregation assays. LA liposomes (50 µM total lipids) were incubated for 5 min with pS209 cSTD3 (380 nM). Then, LB liposomes (50 µM total lipids) and VAP‐AHIS6 or VAP‐A (KD/MD)HIS6 (700 nM) were successively added. Left panels: mean radius (black dots) and polydispersity (shaded area) over time. Right panels: size distribution before (gray bars) and after the reaction (black bars).
Fusion assay. DOPC (1.2‐dioleoyl‐sn‐glycero‐3‐phosphocholine) liposomes (62.5 µM total lipids, LA) containing 3 mol% MPB‐PE, 1% NBD‐PE, and 1% Rhod‐PE were mixed with pS209 cSTD3 (475 nM). After 5 min, liposomes (DOPC/DOGS‐NTA‐Ni2+ liposomes 90/10 mol/mol, 62.5 µM total lipids, LB), covered or not with 1 µM of VAPHIS6, were added. At the end of the experiment, Triton X‐100 was added (1% v/v final concentration) to disrupt liposomes and eliminate energy transfer, allowing the determination of the maximal fluorescence of NBD‐PE that would be measured for a complete membrane fusion.
- A–E
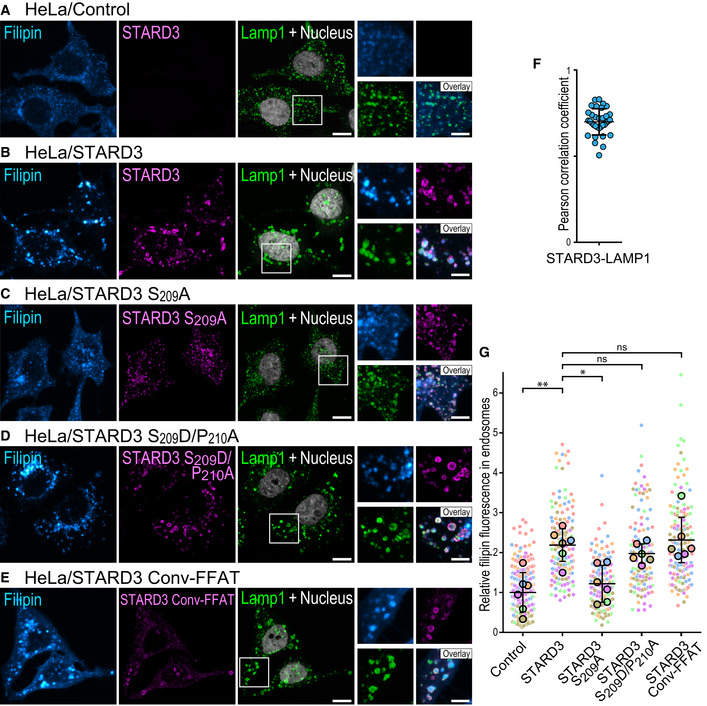
HeLa/Ctrl (A), HeLa/STARD3 (B), HeLa/STARD3 S209A (C), HeLa/STARD3 S209D/P210A (D), and HeLa/STARD3 Conv‐FFAT (E) cells were labeled with anti‐STARD3 antibodies (magenta), anti‐Lamp1 antibodies (green) and with the fluorescent cholesterol probe filipin (Cyan Hot). Nuclei are shown in gray (TO‐PRO‐3). Higher magnifications images (2×) of the area outlined in white are shown on the right. The filipin, STARD3, and Lamp1 merged image is labeled Overlay. Scale bars: 10 µm. Inset scale bars: 5 µm.
- F
Pearson’s correlation coefficients between STARD3 and Lamp1 staining in HeLa/STARD3 cells. Each dot represents a single cell (34 cells from 4 independent experiments). Mean and error bars (SD) are shown. Note that STARD3 and Lamp1 signals are highly correlated.
- G
Relative fluorescence intensity of intracellular filipin signals in endosomes of HeLa/Ctrl, HeLa/STARD3, HeLa/STARD3 S209A, HeLa/STARD3 S209D/P210A, and HeLa/STARD3 Conv‐FFAT cells. Data are displayed as a Superplot (Lord et al, 2020) showing the relative filipin fluorescence intensity in endosomes of individual cells (small circles) from 6 independent experiments (mean of each experiment shown as a large circle). Independent experiments are color‐coded. Means and error bars (SD) are shown as black bars. Kruskal–Wallis with Dunn’s multiple comparison test (*P < 0.05; **P < 0.01; n = 6 independent experiments).
- A
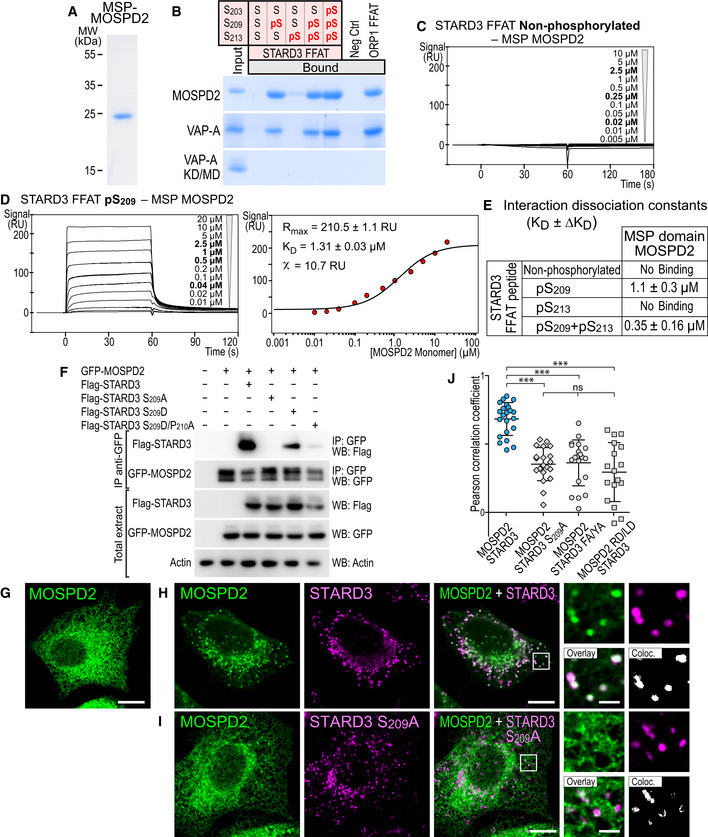
Coomassie Blue staining of the recombinant MSP domain of MOSPD2 after SDS–PAGE.
- B
Recombinant MSP domains pulled down with STARD3 FFAT peptides (unphosphorylated, monophosphorylated on S209 or S213, bi‐phosphorylated on S209 and S213, or tri‐phosphorylated on S203, S209 and S213 and control peptides were revealed by Coomassie Blue staining. The recombinant proteins subjected to the assay are shown in the input fraction.
- C, D
SPR analysis of the MSP domain of MOSPD2 binding onto immobilized unphosphorylated (C) and pS209 (D) STARD3 FFAT. Representative sensorgrams resulting from the interaction between the MSP domain of MOSPD2 injected at different concentrations and the different FFAT peptides are shown in (C) and (D left). Binding curves display the SPR signal (RU) as a function of time. Concentrations printed in bold indicate samples measured twice. Signal obtained for the negative control peptide immobilized on another flow cell is systematically subtracted, as well as the bulk effect recorded with buffer only. (D right) Steady‐state analysis of the interaction between pS209 STARD3 FFAT peptide and the MSP domain of MOSPD2. Equilibrium responses (Req) extracted from the left panel were plotted as a function of the monomeric concentration of the MSP domain of MOSPD2, and fitted with a 1:1 binding model. The experiments were performed at 25°C in Tris–HCl 50 mM, pH 7.5, NaCl 75 mM buffer supplemented with 0.005% (v/v) surfactant polysorbate 20 (P20, GE Healthcare). Mean of 2 independent experiments. Uncertainties are obtained from the standard deviation considering a t‐distribution coefficient for a risk factor of 32%.
- E
Interaction dissociation constants between the different STARD3 FFAT peptides and the MSP domains of MOSPD2.
- F
Immunoprecipitation (GFP‐Trap) experiments between GFP‐tagged MOSPD2 and Flag‐tagged STARD3 (WT and S209A, S209D, and S209D/P210A mutants). Approximatively 5 µg of total protein extracts was analyzed by Western blot using anti‐Flag, anti‐GFP and anti‐Actin antibodies. Immunoprecipitated material was analyzed using anti‐Flag and anti‐GFP antibodies.
- G–I
GFP‐MOSPD2‐expressing cells (green) were left untransfected (G) or transfected with Flag‐STARD3 (H) and Flag‐STARD3 S209A (I), and labeled using anti‐Flag (magenta) antibodies. The subpanels on the right are higher magnification (3.5×) images of the area outlined in white. The Overlay panel shows merged green and magenta images. The Coloc panel displays a colocalization mask on which pixels where the green and the magenta channels co‐localize are shown in white. Scale bars: 10 µm.
- J
Pearson’s correlation coefficients between MOSPD2 (WT or RD/LD) and STARD3 (WT, S209A, or FA/YA) staining are shown. Each dot represents a single cell (number of cells: MOSPD2–STARD3: 22; MOSPD2– STARD3 S209A: 21; MOSPD2–STARD3 FA/YA: 20; MOSPD2 RD/LD–STARD3: 17, from at least three independent experiments). Means and error bars (SD) are shown. Kruskal–Wallis with Dunn’s multiple comparison test (***P < 0.001).
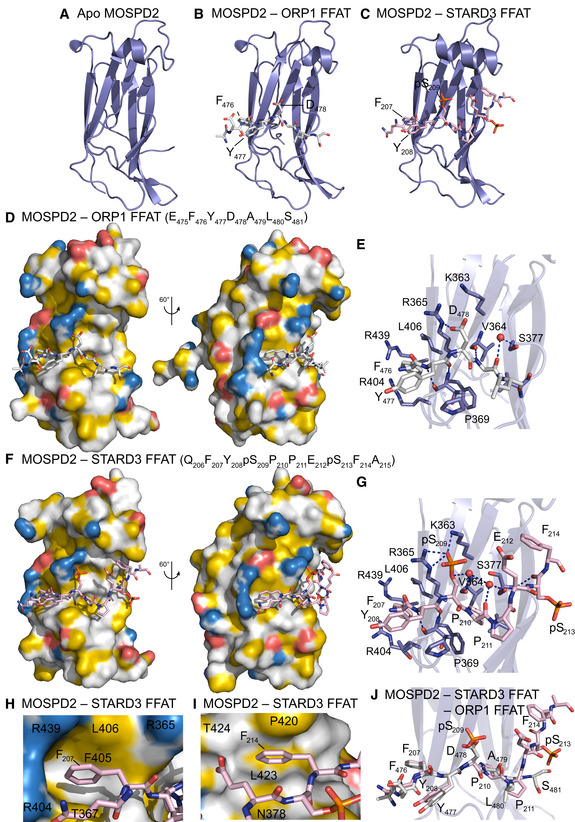
- A–C
Ribbon diagram of the MSP domain of MOSPD2 in its unbound form (A), in complex with the conventional FFAT of ORP1 (B), and in complex with the Phospho‐FFAT of STARD3 (C).
- D
Surface representation of the MSP domain of MOSPD2 in complex with the conventional FFAT of ORP1.
- E
Close‐up view of the structure near the conventional FFAT motif highlighting critical residues (in stick model) of human MOSPD2 present in the binding interface.
- F
Surface representation of the MSP domain of MOSPD2 in complex with the phosphorylated FFAT of STARD3.
- G
Close‐up view of the structure near the Phospho‐FFAT motif highlighting critical residues (in stick model) of human MOSPD2 present in the binding interface.
- H, I
Close‐up view of the hydrophobic pockets interacting with the 2nd residue (F207) (H) and the 9th residue (F214) (I) of the Phospho‐FFAT of STARD3; residues of MOSPD2 constituting the pockets are indicated.
- J
Superposition of the structures shown in (E) and (G) showing the similar trajectories of the peptides.
References
-
- Alli‐Balogun GO, Levine TP (2019) Regulation of targeting determinants in interorganelle communication. Curr Opin Cell Biol 57: 106–114 - PubMed
-
- Alpy F, Wendling C, Rio M‐C, Tomasetto C (2002) MENTHO, a MLN64 homologue devoid of the START domain. J Biol Chem 277: 50780–50787 - PubMed
-
- Alpy F, Latchumanan VK, Kedinger V, Janoshazi A, Thiele C, Wendling C, Rio M‐C, Tomasetto C (2005) Functional characterization of the MENTAL domain. J Biol Chem 280: 17945–17952 - PubMed
-
- Alpy F, Tomasetto C (2005) Give lipids a START: the StAR‐related lipid transfer (START) domain in mammals. J Cell Sci 118: 2791–2801 - PubMed
-
- Alpy F, Rousseau A, Schwab Y, Legueux F, Stoll I, Wendling C, Spiegelhalter C, Kessler P, Mathelin C, Rio M‐C et al (2013) STARD3 or STARD3NL and VAP form a novel molecular tether between late endosomes and the ER. J Cell Sci 126: 5500–5512 - PubMed
Publication types
MeSH terms
Substances
Associated data
- Actions
- Actions
- Actions
- Actions
Grants and funding
- BB/M011801/1/BB_/Biotechnology and Biological Sciences Research Council/United Kingdom
- ANR-19-CE44-0003/Agence Nationale de la Recherche (ANR)
- INCA_9269/Institut National Du Cancer (INCa)
- BB/P003818/1/BB_/Biotechnology and Biological Sciences Research Council/United Kingdom
- ANR-10-INSB-05-01/French Infrastructure for Integrated Structural Biology (FRISBI)
LinkOut - more resources
Full Text Sources
Other Literature Sources
Molecular Biology Databases
Research Materials
