

Dynamin-related Irgm proteins modulate LPS-induced caspase-11 activation and septic shock
- PMID: 33124745
- PMCID: PMC7645254
- DOI: 10.15252/embr.202050830
Dynamin-related Irgm proteins modulate LPS-induced caspase-11 activation and septic shock
Abstract
Inflammation associated with gram-negative bacterial infections is often instigated by the bacterial cell wall component lipopolysaccharide (LPS). LPS-induced inflammation and resulting life-threatening sepsis are mediated by the two distinct LPS receptors TLR4 and caspase-11 (caspase-4/-5 in humans). Whereas the regulation of TLR4 activation by extracellular and phago-endosomal LPS has been studied in great detail, auxiliary host factors that specifically modulate recognition of cytosolic LPS by caspase-11 are largely unknown. This study identifies autophagy-related and dynamin-related membrane remodeling proteins belonging to the family of Immunity-related GTPases M clade (IRGM) as negative regulators of caspase-11 activation in macrophages. Phagocytes lacking expression of mouse isoform Irgm2 aberrantly activate caspase-11-dependent inflammatory responses when exposed to extracellular LPS, bacterial outer membrane vesicles, or gram-negative bacteria. Consequently, Irgm2-deficient mice display increased susceptibility to caspase-11-mediated septic shock in vivo. This Irgm2 phenotype is partly reversed by the simultaneous genetic deletion of the two additional Irgm paralogs Irgm1 and Irgm3, indicating that dysregulated Irgm isoform expression disrupts intracellular LPS processing pathways that limit LPS availability for caspase-11 activation.
Keywords: IRGM; autophagy; caspase-4; lipopolysaccharide; noncanonical inflammasome.
© 2020 The Authors.
Conflict of interest statement
The authors declare that they have no conflict of interest.
Figures
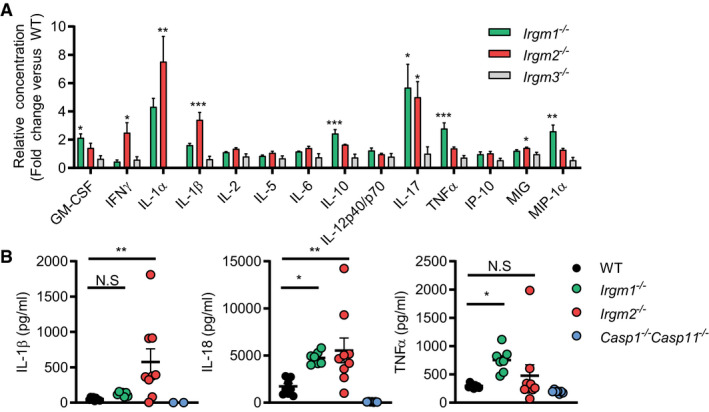
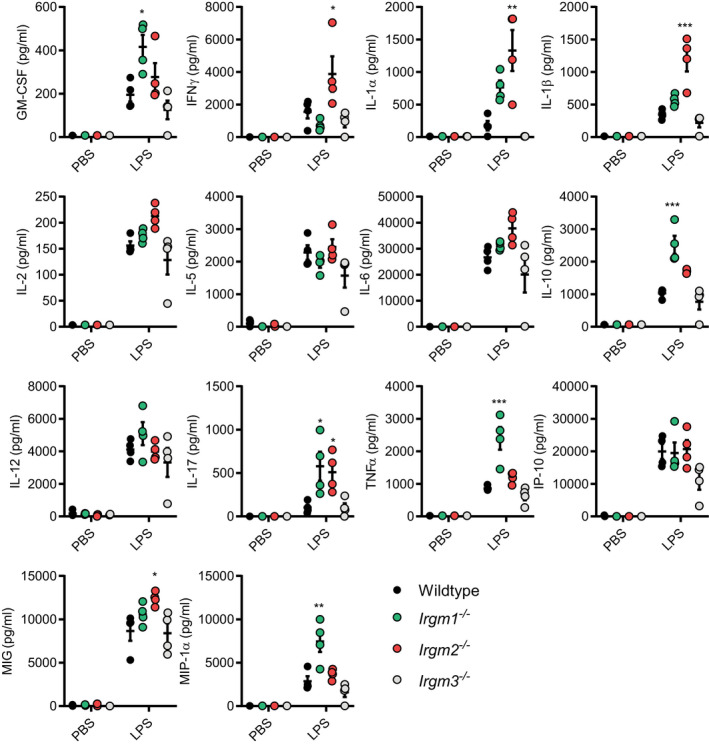
WT, Irgm1 −/−, Irgm2 −/−, and Irgm3 −/− mice (n = 4 mice/genotype) were injected i.p. with LPS (8 mg/kg). Serum was collected 4 h post‐injection (hpi) and concentration of various cytokines determined via a preconfigured Luminex multiplex panel. Relative concentration (fold change relative mean of WT) is shown for the indicated cytokines (absolute cytokine concentrations of same experiment are shown in Fig EV1).
WT (n = 9), Irgm1 −/− (n = 7), Irgm2 −/− (n = 9), and Casp1 −/− Casp11 −/− (n = 7) mice were injected i.p. with LPS (8 mg/kg). Serum was collected 4 hpi and concentration of IL‐1β, IL‐18, and TNFα was measured via ELISA.
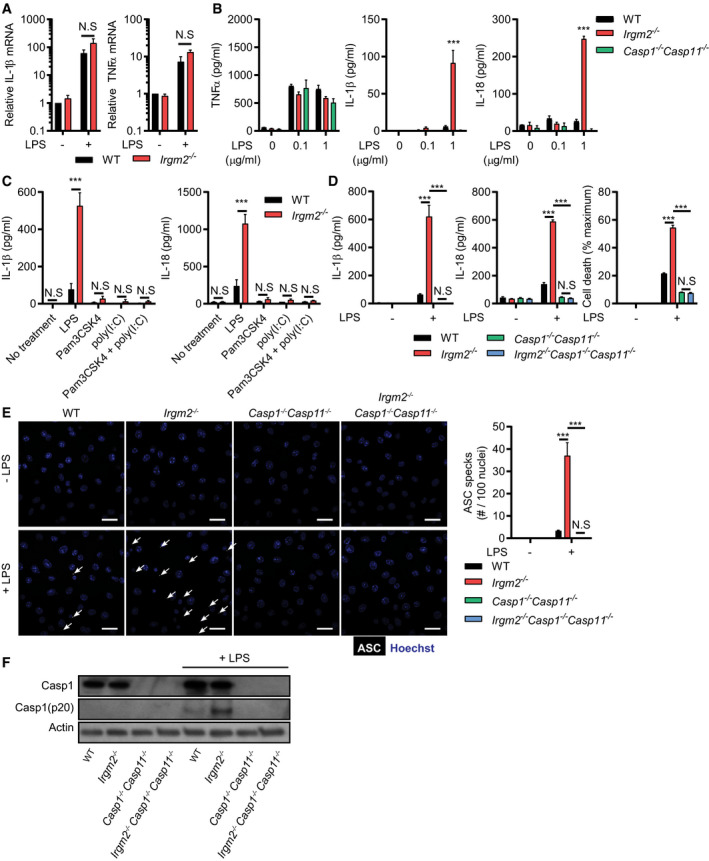
qPCR measurement of IL‐1β and TNF‐α mRNA levels in WT and Irgm2 −/− BMMs following 8‐h stimulation with LPS (1 μg/ml).
WT, Irgm2 −/−, and Casp1 −/− Casp11 −/− BMMs were treated for 24 h with LPS at indicated doses and supernatant TNFα, IL‐1β, and IL‐18 was measured by ELISA.
IFNγ‐primed WT and Irgm2 −/− BMMs were treated with LPS, Pam3CSK4, poly(I:C), or a combination of Pam3CSK4 and poly(I:C) (1 μg/ml for all treatments) for 24 h and cell supernatant IL‐1β and IL‐18 concentrations were assessed by ELISA.
WT, Irgm2 −/−, Casp1 −/− Casp11 −/−, and Irgm2 −/− Casp1 −/− Casp11 −/− BMMs were treated with LPS (1 μg/ml) and IL‐1β, IL‐18, and LDH release were assessed at 24 h post‐treatment (hpt).
IFNγ‐primed WT, Irgm2 −/−, Casp1 −/− Casp11 −/− and Irgm2 −/− Casp1 −/− Casp11 −/− BMMs were treated with LPS (5 μg/ml) for 4 h and subsequently stained with anti‐ASC antibody and Hoechst stain (DNA/nuclei). Representative images are shown with white arrows pointing at ASC specks. Number of ASC specks per nuclei was quantified. Scale bars: 20 μm.
IFNγ‐primed WT, Irgm2 −/−, Casp1 −/− Casp11 −/− and Irgm2 −/− Casp1 −/− Casp11 −/− BMMs were treated with LPS (1 μg/ml) for 24 h and cell lysates and supernatants collected. Protein levels in cell lysates (caspase‐1, and actin) and supernatants (caspase‐1 p20) were visualized via immunoblotting.
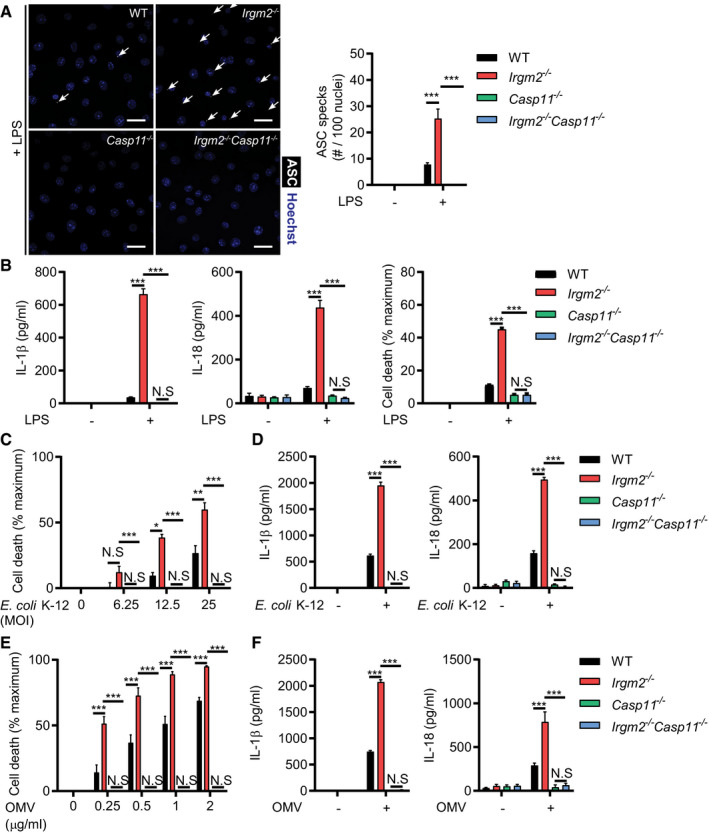
IFNγ primed WT, Irgm2 −/−, Casp11 −/− and Irgm2 −/− Casp11 −/− BMMs were treated with LPS (5 μg/ml) for 4 h. Following treatment, cells were stained with anti‐ASC antibody and Hoechst (DNA/nuclei). Representative images of ASC specks (white arrows point at specks) are shown and number of ASC specks per nuclei quantified. Scale bars: 20 μm.
WT, Irgm2 −/−, Casp11 −/− and Irgm2 −/− Casp11 −/− BMMs were treated with LPS (1 μg/ml). IL‐1β, IL‐18, and LDH release were assessed at 24 h post‐treatment (hpt).
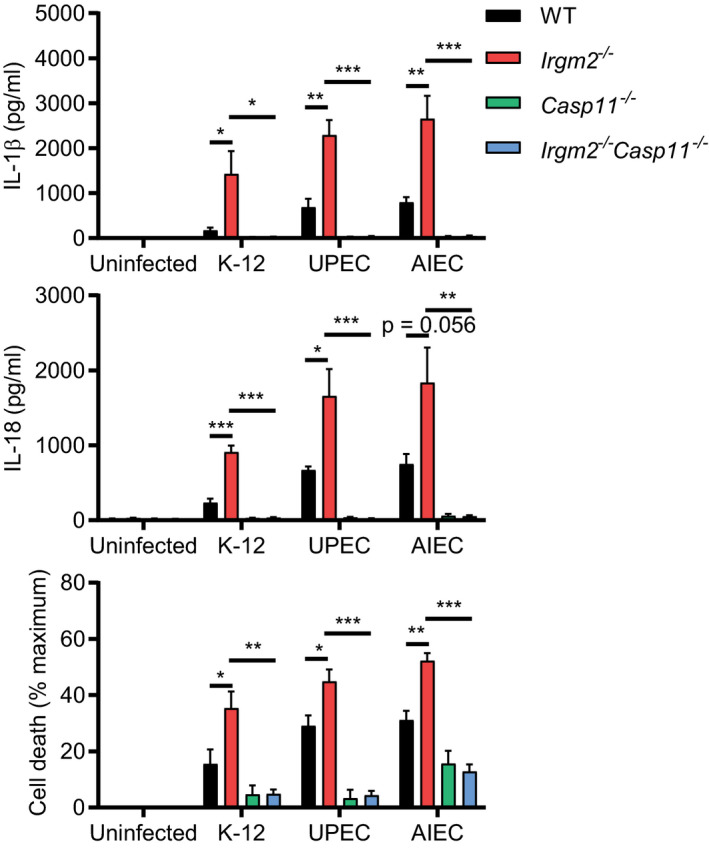
WT, Irgm2 −/−, Casp11 −/− and Irgm2 −/− Casp11 −/− BMMs were infected with E. coli K‐12 at indicated MOIs and cell viability assessed via CellTiter‐Glo. Cell death was calculated as a function of relative viability to uninfected cells.
WT, Irgm2 −/−, Casp11 −/− and Irgm2 −/− Casp11 −/− BMMs were infected with E. coli K‐12 (MOI 25) and 24 hpi supernatant IL‐1β and IL‐18 levels were measured by ELISA.
WT, Irgm2 −/−, Casp11 −/− and Irgm2 −/− Casp11 −/− BMMs were treated with OMVs at indicated concentrations for 24 h. Cell viability was assessed via CellTiter‐Glo, and cell death was calculated as a function of relative viability to untreated cells.
WT, Irgm2 −/−, Casp11 −/− and Irgm2 −/− Casp11 −/− BMMs were treated with OMVs (1 μg/ml) and 24 hpt cell supernatant IL‐1β and IL‐18 levels were measured via ELISA.
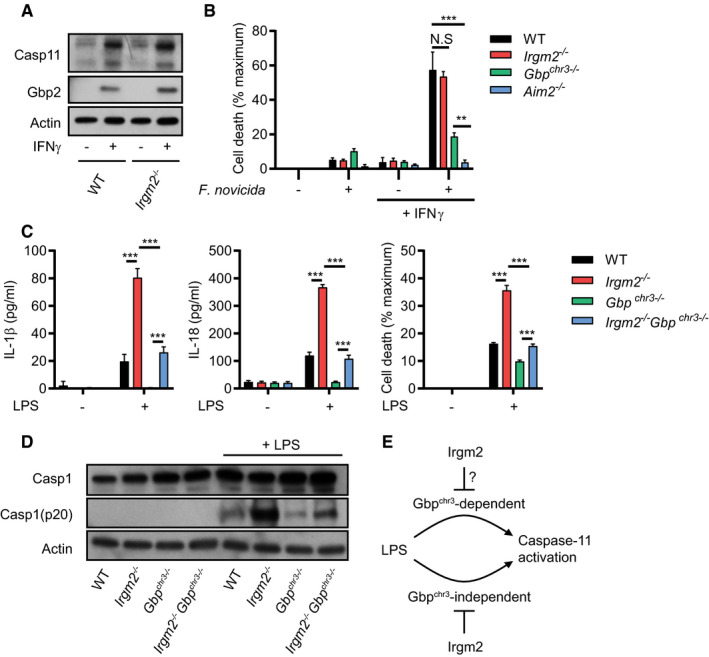
WT and Irgm2 −/− BMMs were stimulated overnight with IFNγ or left untreated and cell lysates were collected. Lysates were assessed for Casp11, Gbp2, and actin protein levels via immunoblotting.
IFNγ‐primed and unprimed WT, Irgm2 −/−, Gbp chr3−/− and Aim2 −/− BMMs were infected with Francisella novicida (MOI 10) and LDH release measured at 4 hpi.
WT, Irgm2 −/−, Gbp chr3−/− and Irgm2 −/− Gbp chr3−/− BMMs were treated with LPS (1 μg/ml). IL‐1β, IL‐18, and LDH release were assessed at 24 hpt.
IFNγ‐primed WT, Irgm2 −/−, Gbp chr3−/− and Irgm2 −/− Gbp chr3−/− BMMs were treated with LPS (1 μg/ml) for 24 h and cell lysates and supernatants collected. Protein levels in cell lysates (Caspase‐1 and actin) and supernatants (Caspase‐1 p20) were visualized via immunoblotting.
Model depicting regulation of caspase‐11 activation by Irgm2 and Gbps.
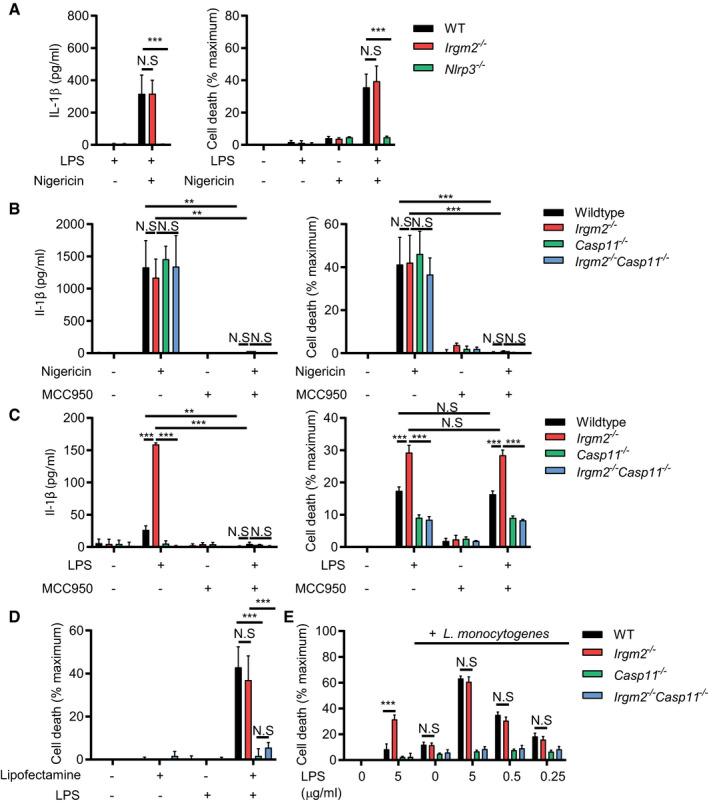
WT, Irgm2 −/−, and Nlrp3 −/− BMMs were treated with LPS (0.1 μg/ml) for 3 h followed by nigericin for 1 h and IL‐1β/LDH release was measured.
WT, Irgm2 −/−, Casp11 −/− and Irgm2 −/− Casp11 −/− BMMs were treated with LPS (0.1 μg/ml) for 3 h followed by nigericin and/or MCC950 for 1 h and IL‐1β/LDH release was measured.
WT, Irgm2 −/−, Casp11 −/− and Irgm2 −/− Casp11 −/− BMMs were treated with LPS (1 μg/ml) and/or MCC950 for 24 h and IL‐1β/LDH release was measured.
IFNγ‐primed WT, Irgm2 −/−, Casp11 −/− and Irgm2 −/− Casp11 −/− BMMs were transfected with LPS using lipofectamine LTX and LDH release was measured at 2 hpt.
IFNγ‐primed WT, Irgm2 −/−, Casp11 −/− and Irgm2 −/− Casp11 −/− BMMs were co‐treated with LPS (indicated doses) and Listeria monocytogenes (MOI 5) and LDH release measured at 4 hpt.
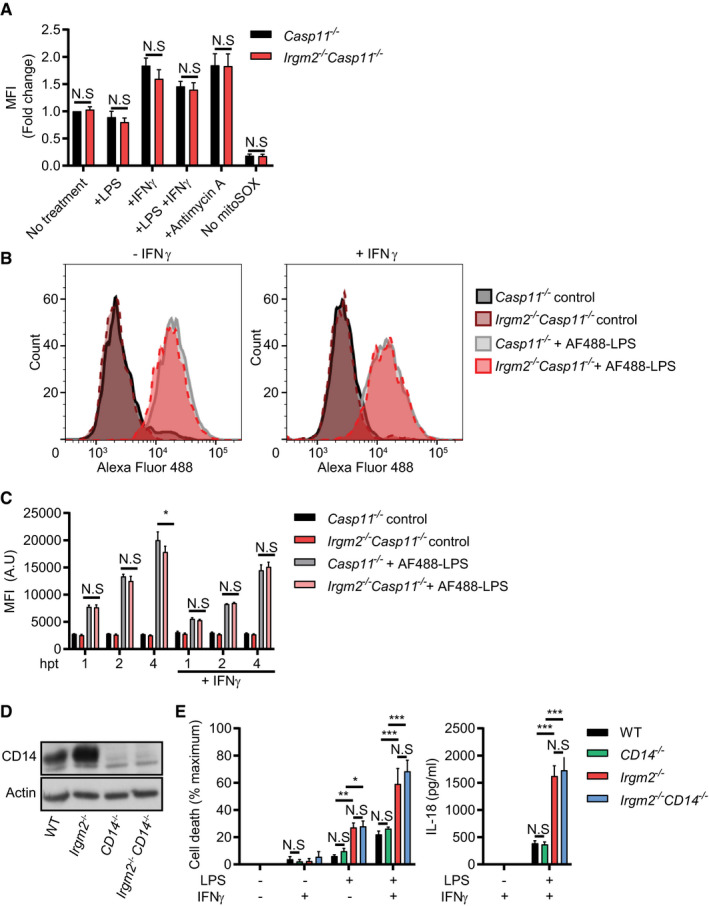
IFNγ‐primed and unprimed Casp11 −/− and Irgm2 −/− Casp11 −/− BMMs were treated with LPS (1 μg/ml) for 3 h, antimycin A for 30 min or were left untreated. Cells were then stained with mitoSOX red and fluorescence measured via flow cytometry. For each experiment, mean fluorescence intensity (MFI) was normalized to untreated Casp11 −/− BMMs.
IFNγ‐primed and unprimed Casp11 −/− and Irgm2 −/− Casp11 −/− BMMs were treated with Alexa Fluor 488‐conjugated LPS or unconjugated LPS (control) for 4 h and Alexa Fluor 488 cell fluorescence measured via flow cytometry. Representative flow cytometry data are depicted.
IFNγ‐primed and unprimed Casp11 −/− and Irgm2 −/− Casp11 −/− BMMs were treated with Alexa Fluor 488 conjugated LPS or unconjugated LPS (control) for 1, 2, or 4 h and fluorescence measured via flow cytometry. MFI (A.U) = Mean fluorescent intensity (arbitrary units).
Lysates from WT, CD14 −/−, Irgm2 −/−, and Irgm2 −/− CD14 −/− BMMs were assessed for CD14 and actin protein levels via immunoblotting.
IFNγ‐primed and unprimed WT, CD14 −/−, Irgm2 −/−, and Irgm2 −/− CD14 −/− BMMs were treated with LPS (1 μg/ml) for 24 h and LDH and IL‐18 release measured.
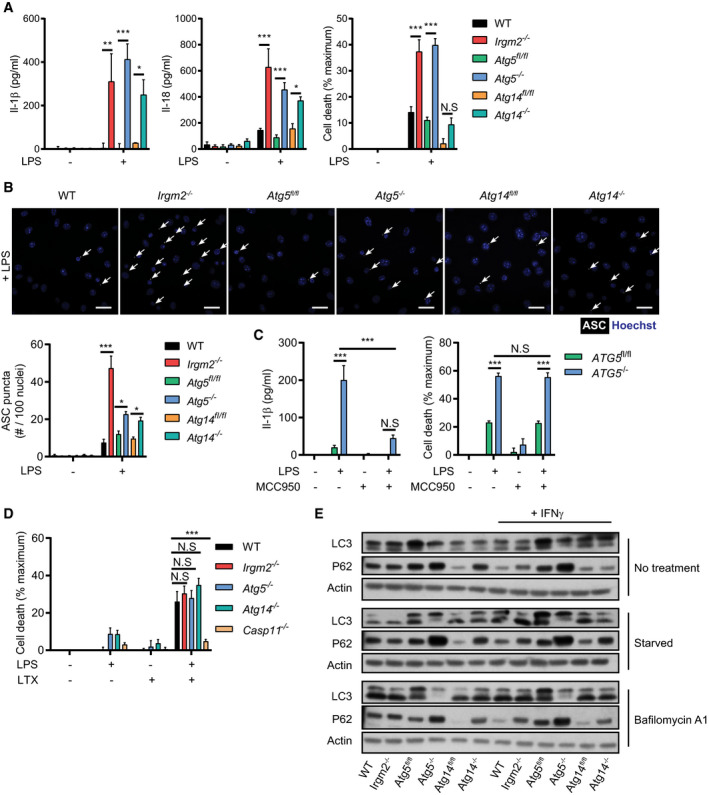
WT, Irgm2 −/−, Atg5 fl/fl, LysMCre‐Atg5 f/f (Atg5 −/−), Atg14 fl/fl and LysMCre‐Atg14 f/f (Atg14 −/−) BMMs were treated with LPS (1 μg/ml) and IL‐1β, IL‐18, and LDH release were assessed at 24 hpt (n = 4 independent experiments for IL‐1β, IL‐18 and n = 7 independent experiments for LDH release).
IFNγ‐primed BMMs of the indicated genotypes were treated with LPS (5 μg/ml) for 4 h and subsequently stained with anti‐ASC antibody and Hoechst stain (DNA/nuclei). Representative images are shown with white arrows pointing at ASC specks. Number of ASC specks per nuclei was quantified. Scale bars: 20 μm. (n = 3 independent experiments, >200 nuclei counted for each condition/replicate)
Atg5 fl/f and LysMCre‐Atg5 f/f (Atg5 −/−) BMMs were treated with LPS (1 μg/ml) and/or MCC950 for 24 h and IL‐1β/LDH release was measured (n = 3 independent experiments).
IFNγ‐primed BMMs of the indicated genotypes were transfected with LPS using lipofectamine LTX and LDH release measured 2 hpt (n = 5 independent experiments).
IFNγ‐primed BMMs of the indicated genotypes were stimulated overnight with IFNγ or left untreated. Cells were then starved for 2 h in HBSS or were treated with Bafilomycin A1 (100 nM), and cell lysates were collected. Lysates were assessed for LC3, p62, and actin protein levels via immunoblotting. Image is representative of n = 3 independent experiments.
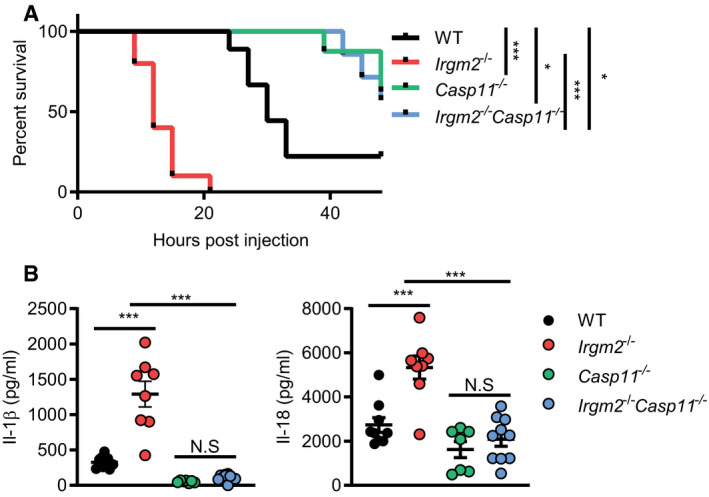
WT (n = 9), Irgm2 −/− (n = 10), Casp11 −/− (n = 7), and Irgm2 −/− Casp11 −/− (n = 8) mice were injected i.p. with LPS (8 mg/kg). Morbidity and mortality were observed for 48 h at 3‐h intervals.
WT (n = 9), Irgm2 −/− (n = 8), Casp11 −/− (n = 7), and Irgm2 −/− Casp11 −/− (n = 10) mice were injected i.p. with LPS (8 mg/kg). Serum was collected 4 hpi and concentration of IL‐1β, and IL‐18 was measured by ELISA. Data shown are from 2 pooled experiments.
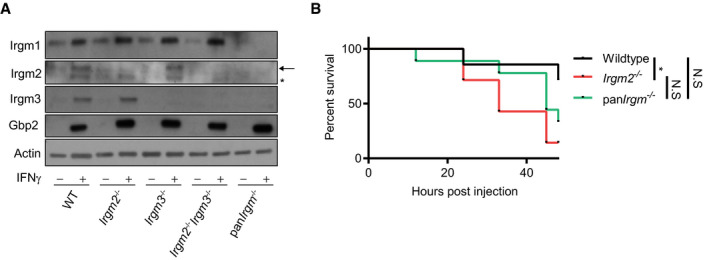
WT, Irgm2 −/−, Irgm3 −/−, Irgm2 −/− Irgm3 −/−, and panIrgm −/− BMMs were stimulated overnight with IFNγ or left untreated and cell lysates were collected. Lysates were assessed for Irgm1, Irgm2, Irgm3, Gbp2, and actin protein levels via immunoblotting (arrow = band of interest, * = nonspecific band).
WT (n = 7), Irgm2 −/− (n = 7), and panIrgm −/− (n = 9) mice were injected i.p. with LPS (2 mg/kg bodyweight). Morbidity and mortality were observed for 48 h at 3 h intervals. *P < 0.05, for indicated comparisons by log‐rank Mantel‐Cox test. N.S, non‐significant.
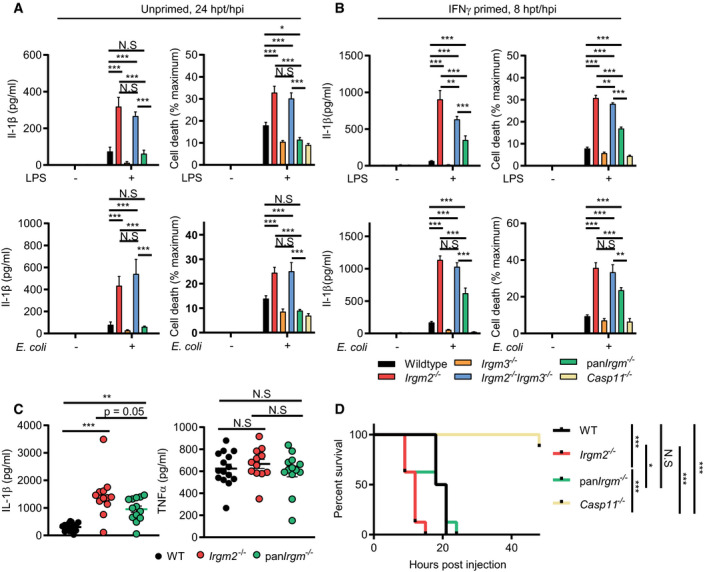
WT, Irgm2 −/−, Irgm3 −/−, Irgm2 −/− Irgm3 −/−, panIrgm −/−, and Casp11 −/− BMMs were treated with LPS (1 μg/ml) or infected with E. coli K‐12 (MOI 25) and IL‐1β, and LDH release were assessed at 24 hpt (n = 3 independent experiments).
IFNγ‐primed WT, Irgm2 −/−, Irgm3 −/−, Irgm2 −/− Irgm3 −/−, panIrgm −/−, and Casp11 −/− BMMs were treated with LPS (1 μg/ml) or infected with E. coli K‐12 (MOI 25) and IL‐1β, and LDH release were assessed at 8 hpt/hpi (n = 3 independent experiments).
WT (n = 15), Irgm2 −/− (n = 12), and panIrgm −/− (n = 13) mice were injected i.p. with LPS (8 mg/kg). Serum was collected 4 hpi and concentration of IL‐1β and TNFα was measured via ELISA. Data shown are from 3 pooled experiments.
WT, Irgm2 −/−, panIrgm −/−, and Casp11 −/− mice (n = 8 mice/genotype) were injected i.p. with LPS (8 mg/kg body weight). Morbidity and mortality were observed for 48 h at 3‐h intervals.
Comment in
-
Irgm2 and Gate-16 put a break on caspase-11 activation.EMBO Rep. 2020 Nov 5;21(11):e51787. doi: 10.15252/embr.202051787. Epub 2020 Nov 1. EMBO Rep. 2020. PMID: 33135287 Free PMC article.
References
-
- Bafica A, Feng CG, Santiago HC, Aliberti J, Cheever A, Thomas KE, Taylor GA, Vogel SN, Sher A (2007) The IFN‐inducible GTPase LRG47 (Irgm1) negatively regulates TLR4‐triggered proinflammatory cytokine production and prevents endotoxemia. J Immunol 179: 5514–5522 - PubMed
-
- Brewer SM, Brubaker SW, Monack DM (2019) Host inflammasome defense mechanisms and bacterial pathogen evasion strategies. Curr Opin Immunol 60: 63–70 - PubMed
-
- Broz P, Dixit VM (2016) Inflammasomes: mechanism of assembly, regulation and signalling. Nat Rev Immunol 16: 407–420 - PubMed
Publication types
MeSH terms
Substances
Grants and funding
LinkOut - more resources
Full Text Sources
Molecular Biology Databases
