Irgm2 and Gate-16 cooperatively dampen Gram-negative bacteria-induced caspase-11 response
- PMID: 33124769
- PMCID: PMC7645206
- DOI: 10.15252/embr.202050829
Irgm2 and Gate-16 cooperatively dampen Gram-negative bacteria-induced caspase-11 response
Abstract
Inflammatory caspase-11 (rodent) and caspases-4/5 (humans) detect the Gram-negative bacterial component LPS within the host cell cytosol, promoting activation of the non-canonical inflammasome. Although non-canonical inflammasome-induced pyroptosis and IL-1-related cytokine release are crucial to mount an efficient immune response against various bacteria, their unrestrained activation drives sepsis. This suggests that cellular components tightly control the threshold level of the non-canonical inflammasome in order to ensure efficient but non-deleterious inflammatory responses. Here, we show that the IFN-inducible protein Irgm2 and the ATG8 family member Gate-16 cooperatively counteract Gram-negative bacteria-induced non-canonical inflammasome activation, both in cultured macrophages and in vivo. Specifically, the Irgm2/Gate-16 axis dampens caspase-11 targeting to intracellular bacteria, which lowers caspase-11-mediated pyroptosis and cytokine release. Deficiency in Irgm2 or Gate16 induces both guanylate binding protein (GBP)-dependent and GBP-independent routes for caspase-11 targeting to intracellular bacteria. Our findings identify molecular effectors that fine-tune bacteria-activated non-canonical inflammasome responses and shed light on the understanding of the immune pathways they control.
Keywords: Caspase-11; Gate-16; Irgm2; infections/Interferons; non-canonical inflammasome.
© 2020 The Authors.
Conflict of interest statement
The authors declare that they have no conflict of interest.
Figures
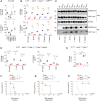
- A
siRNA‐treated BMDMs were infected for 16 h with S. Typhimurium (orgA −), and LDH and IL‐1β release were measured.
- B
Cell death (LDH) and IL‐1β release evaluation in WT, Irgm2 −/−, GBP Chr3−/− and Casp11 −/− BMDMs infected for 16 h with different Gram‐negative bacteria (MOI 25).
- C
Western blot examination of processed caspase‐1 (p20) and gasdermin‐D (p30) in supernatants and pro‐caspase‐1 (p45), pro‐gasdermin‐D (p55) and GAPDH in cell lysates of WT and Irgm2 −/− BMDMs infected for 16 h with different Gram‐negative bacterial strains.
- D
IL‐1β and cell death (% LDH) evaluation in immortalized WT, Irgm2 −/−, Casp11 −/− and Casp11 −/− Irgm2 −/− (referred as sgIrgm2) BMDMs after 16 h of Escherichia coli, S. Typhimurium orgA − and OMV treatment.
- E
Cell death (% LDH) evaluation in IFNγ‐primed WT, Irgm2 −/− and Casp11 −/− BMDMs 4 h after electroporation or not with 1 μg of E. coli LPS.
- F–H
Survival of WT, Casp11 −/− and Irgm2 −/− mice primed with 100 μg poly(I:C) for 6 h and injected (i.p.) with 5 mg/kg LPS or 5 and 25 μg of OMVs (n = 6 animals per condition).

qRT–PCR measurement of silencing efficacy on the mRNA levels of Irgm1‐3, Gbp2 and Caspase‐11 in BMDMs, prestimulated with 100 UI/ml of IFNγ for 16 h. N = 3 independent experiments normalized to β‐actin mRNA levels. Data are expressed as mean ± SEM. ***P ≤ 0.001 for the indicated comparisons using t‐test with Bonferroni correction.
Immunoblotting of Irgm2, caspase‐1, caspase‐11 and GAPDH expression in IFNγ‐primed WT or Irgm2 −/− BMDMs. Image represents one experiment performed two times.
Immunoblotting of GBP2, GBP5 and GAPDH expression in Salmonella (S. Tm)‐ or IFNγ‐treated WT or Irgm2 −/− BMDMs. Image represents one experiment performed two times.
LDH and IL‐1β release from WT, Irgm2 −/−, Casp11 −/− and Nlrp3 −/− BMDMs treated for 16 h with 2.5 μg/2.105 cells of OMVs in the presence or not of 10 μM of MCC950 (NLRP3 inhibitor). Data are expressed as mean ± SEM from n = 4 independent pooled experiments. ***P ≤ 0.001 for the indicated comparisons using t‐test with Bonferroni correction.
Immunoblots of Casp11 or Irgm2 deletion efficacy in immortalized BMDMs. Image represents one experiment performed two times.
Release of LDH and IL‐1β from IFNγ‐ and PAM3CSK4‐primed WT, Irgm2 −/−, Casp11 −/− or Casp1 −/− Casp11 −/− BMDMs transfected (using FuGeneHD) with flagellin or poly(dA:dT) or stimulated with either Nigericin or TcdB toxin for 6 h. Data are expressed as mean ± SEM from n = 4 independent pooled experiments.
Western blot examination of processed caspase‐1 (p20) and gasdermin‐D (p30) in supernatants and pro‐caspase‐1 (p45), pro‐gasdermin‐D (p55) and GAPDH in cell lysates of WT and Irgm2 −/− BMDMs infected for 4 h with S. Typhimurium and Pseudomonas aeruginosa (NLRC4 inflammasome). Image represents one experiment performed two times.
Cytokine levels in plasma from WT, Casp11 −/− and Irgm2 −/− (n = 6 mice per condition) primed with 100 μg poly(I:C) for 6 h and injected i.p with 25 μg of OMVs for 5 h. Graphs represent one experiment out of three independent experiments; *P ≤ 0.05; **P ≤ 0.01, ***P ≤ 0.001, Mann–Whitney analysis test.
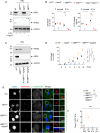
Immunoblots of Irgm2 silencing efficacy in primary BMDMs. Image represents one experiment performed two times. *Non‐specific.
Cell death (LDH) and IL‐1β release evaluation in WT, Irgm2 −/− , GBP Chr3−/−, Casp11 −/− and Casp1 −/− Casp11 −/− BMDMs infected for 16 h with either S. Tm orgA − or F. novicida (MOI 25). Data are expressed as mean ± SEM from n = 3 independent pooled experiments.
Immunoblots of Irgm2 deletion efficacy in immortalized GBP Chr3−/− BMDMs. Image represents one experiment performed two times.
Kinetic of S. Tm (orgA −)‐induced cell death (% LDH release) in IFNγ‐primed iWT, iIrgm2 −/−, iGBP Chr3−/− and iGBP Chr3−/−sgIrgm2 BMDMs. Data are expressed as mean ± SEM from n = 4 independent pooled experiments.
Confocal fluorescence microscopy images and associated quantifications of caspase‐11-C254G‐GFP (green) recruitment to S. Tm‐mCherry (orgA −, red) in IFNγ‐primed iWT, iIrgm2 −/−, iGBP Chr3−/− and iGBP Chr3−/−sgIrgm2 BMDMs after 4 h of infection. Nucleus (blue) was stained with Hoescht, scale bar 5 μm. For quantifications, the percentage of bacteria positive for caspase‐11-C254G‐GFP was determined by combining the bacterial counts from n = 3 independent experiments and expressed as mean ± SEM. “n” refers to the number of bacteria counted.
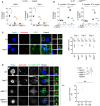
Measure of LDH and IL‐1β release in WT, GBP Chr3−/− and Casp11 −/− BMDMs were Irgm2 was knocked down 16 h after exposure to 2.5 μg/2 × 105 cells of OMVs. Si Scramble (siScr.) refers to RNAi pools with non‐targeting sequences.
Cell death (LDH) and IL‐1β release evaluation in Irgm2‐silenced WT and GBP Chr3−/− BMDMs infected for 16 h with either S. Tm orgA − or F. novicida (MOI 25). Si Scramble (siScr.) refers to RNAi pools with non‐targeting sequences.
Florescence microscopy and associated quantifications of GBP‐2 (green) recruitments to intracellular S. Tm orgA −‐mCherry (MOI 10, red) in IFNγ‐primed WT and Irgm2 −/− BMDMs. Nucleus was stained with Hoechst (blue). Confocal images shown are from one experiment and are representative of n = 3 independent experiments; scale bars 5 μm. For quantifications, the percentage of GBP‐associated bacteria was quantified and “n=” refers to the number of intracellular bacteria counted in each experiment; quantifications from n = 3 independent experiments were then plotted and expressed as mean ± SEM.
Confocal fluorescence microscopy images and associated quantifications of caspase‐11-C254G‐GFP (green) recruitment to S. Tm‐mCherry (orgA −, red) in IFNγ‐primed iWT, iIrgm2 −/−, iGBP Chr3−/− and iGBP Chr3−/−/sgIrgm2 BMDMs after 8 h of infection. Nucleus (blue) was stained with Hoescht, scale bar 5 μm. For quantifications, the percentage of bacteria positive for caspase‐11-C254G‐GFP was determined by combining the bacterial counts from n = 3 independent experiments and expressed as mean ± SEM. ***P ≤ 0.001 for the indicated comparisons using t‐test with Bonferroni correction.

GFP‐Trap coupled to mass spectrometry strategy used. The volcano plot represents three independent combined experiments. Threshold selection of enriched proteins (red dots) in Irgm2‐GFP fraction was set at 2‐fold enrichment (x‐axis) and P‐value < 0.05 (y‐axis). Blacks and grey dots indicate proteins that did not reach a P‐value < 0.05 using t‐test with Bonferroni correction. Labelled proteins represent the top 6 enriched proteins in the Irgm2 fraction.
Green florescent protein (GFP)‐Trap assay of the presence of Gate16 in Irgm2‐GFP-enriched fraction from the lysates of IFNγ‐primed iIrgm2 −/− BMDMs complemented with lentiviral constructs coding for a fusion of Irgm2 with GFP (Irgm2‐GFP) or GFP alone. Arrows show the presence or not of Gate16, Irgm2‐GFP and GAPDH in the Irgm2‐GFP-enriched fractions, flow‐through and total cell lysates. * means non‐specific band.
LDH and IL‐1β release from siRNA‐treated WT BMDMs, and then exposed to 2.5 μg/2 × 105 cells of OMVs for 16 h.
LDH and IL‐1β release from WT, Irgm2 −/− and Casp11 −/− BMDMs silenced for Gate16 and treated for 16 h with 2.5 μg/2 × 105 cells of OMVs. Si Scramble (siScr.) refers to RNAi pools with non‐targeting sequences.
Western blot examination of caspase‐11 and processed caspase‐1 (p20) and gasdermin‐D (p30) in supernatants and pro‐caspase‐1 (p45), pro‐gasdermin‐D (p55), pro‐caspase‐11, Gate16 and GAPDH in cell lysates of Gate16‐silenced WT, Irgm2 −/− and GBP Chr3−/− BMDMs exposed to 2.5 μg/2 × 105 cells of OMVs for 16 h. Si Scramble (siScr.) refers to RNAi pools with non‐targeting sequences.
Representative confocal fluorescence microscopy images and associated quantifications of caspase‐11-C254G‐GFP (green) recruitment to S. Tm‐mCherry (orgA −, red, MOI 10) in IFNγ‐primed iWT BMDMs silenced for Gate16 after 4 and 8 h of infection. Nucleus (blue) was stained with Hoechst, scale bar 5 μm. For quantifications, the percentage of bacteria positive for caspase‐11-C254G‐GFP was determined by combining the bacterial counts from n = 3 independent experiments and expressed as mean ± SEM. **P ≤ 0.01, ***P ≤ 0.001 for the indicated comparisons using t‐test with Bonferroni correction. Si Scramble (siScr.) refers to RNAi pools with non‐targeting sequences.

Representation of top 11 enriched proteins isolated in Irgm2‐GFP fraction. N = 3 independent experiments (Set1‐3). P‐values were obtained using t‐test with Bonferroni correction.
qRT–PCR measurement of silencing efficacy on the mRNA levels of Gabarap, GabarapL1 and L2 (GATE16) in BMDMs, prestimulated with 100 UI/ml of IFNγ for 16 h. N = 3 independent experiments normalized to β‐actin mRNA levels. Data are expressed as mean ± SEM. ***P ≤ 0.001 for the indicated comparisons using t‐test with Bonferroni correction.
Immunoblots of GATE16 silencing efficacy in BMDMs. Image represents one experiment performed three times.
Release of IL‐1β from IFNγ (100 UI/ml) and PAM3CSK4 (100 ng/ml)-primed WT and Nlrp3 −/− BMDMs treated with 20 μM of Nigericin or 5 mM ATP for 4 h. Data are expressed as mean ± SEM from n = 4 independent pooled experiments. Si Scramble (siScr.) refers to RNAi pools with non‐targeting sequences and siGate16 refers to RNAi pools targeting Gate16 mRNA.
Representative confocal fluorescence microscopy images and associated quantifications of caspase‐11-C254G‐GFP (green) recruitment to S. Tm‐mCherry (orgA −, red, MOI 10) in IFNγ‐primed iIrgm2 −/− BMDMs silenced for Gate16 after 4 h of infection. Nucleus (blue) was stained with Hoescht, scale bar 5 μm. For quantifications, the percentage of bacteria positive for caspase‐11-C254G‐GFP was determined by combining the bacterial counts from n = 3 independent experiments and expressed as mean ± SEM. NS, differences are not significant for the indicated comparisons using t‐test with Bonferroni correction. “n” refers to the number of bacteria counted. Si Scramble (siScr.) refers to RNAi pools with non‐targeting sequences, and siGate16 refers to RNAi pools targeting Gate16 mRNA.
Intracellular bacterial loads (CFUs) from siRNA‐treated Casp11 −/− BMDMs infected with S. Tm orgA − (MOI 10) for 24 h. Data are expressed as mean ± SEM and represent n = 3 pooled independent experiments. ***P ≤ 0.001 for the indicated comparisons using t‐test with Bonferroni correction.
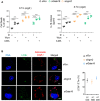
Cell death (LDH) and IL‐1β release evaluation in siRNA‐treated WT BMDMs, infected for 16 h with S. Tm orgA − (MOI 25). Wortmannin (Wort, 10 μM) and 3‐methyladenine (3‐MA, 1 mM) were added 2 h after infection. Data are expressed as mean ± SEM from n = 4 independent pooled experiments. ***P ≤ 0.001 for the indicated comparisons using t‐test with Bonferroni correction. Φ indicates that no pharmacological inhibitor was used.
Confocal fluorescence microscopy images and associated quantifications of LC3b (green) recruitment to S. Tm (orgA −, red) after 6 h of infection in IFNγ‐primed BMDMs silenced for Irgm2 or Gate16. Nucleus (blue) was stained with Hoescht, scale bar 5 μm. For quantifications, the percentage of bacteria positive for LC3b was determined by combining the bacterial counts from n = 3 independent experiments and expressed as mean ± SEM. Si Scramble (siScr.) refers to RNAi pools with non‐targeting sequences, and siGate16 or siIrgm2 refers to RNAi pools targeting Gate16 or Irgm2 mRNAs, respectively.

- A
LDH and IL‐1B release from siRNA‐treated primary human monocyte‐derived macrophages (hMDMs) infected with S. Typhimurium orgA − (MOI25) for 16 h. When specified, the caspase‐4/5 inhibitor Z‐LEVD (25 μM) or the NLRP3 inhibitor MCC950 (10 μM) was added to the experiments.
- B
LDH and IL‐1B release from siRNA‐treated primary human monocyte‐derived macrophages (hMDMs), primed with IFNγ (10 UI/ml) and PAM3CSK4 (100 ng/ml) and then stimulated with Nigericin (20 μM) for 4 h. When specified, the caspase‐4/5 inhibitor Z‐LEVD (25 μM) or the NLRP3 inhibitor MCC950 (10 μM) was added to the experiments.
- C, D
LDH and IL‐1B release from siRNA‐treated WT or GBP1/2/5 −/− U937 monocytic cell line, primed with IFNγ (10 UI/ml) and PAM3CSK4 (100 ng/ml) and then infected with (C) with S. Typhimurium orgA − (MOI25) for 10 h or (D) electroporated with 1 μg of Escherichia coli LPS for 4 h. Φ indicates that no LPS electroporation was performed. Data shown as means ± SEM from n = 4 independent pooled experiments; ***P ≤ 0.001 for the indicated comparisons using t‐test with Bonferroni correction.
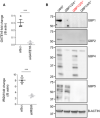
qRT–PCR measurement of silencing efficacy on the mRNA levels of GATE16 and IRGM in hMDMs, prestimulated with 10 UI/ml of IFNγ for 8 h. N = 3 independent experiments normalized to β‐actin mRNA levels. Data are expressed as mean ± SEM. ***P ≤ 0.001 for the indicated comparisons using t‐test with Bonferroni correction.
Immunoblots of various human GBPs (1, 2, 4 and 5) deletion efficacy in U937 monocytic cell line. β‐Actin was used as loading control. In red, the selected U937 cell line deficient for GBP1/2/5 expression.
Comment in
-
Irgm2 and Gate-16 put a break on caspase-11 activation.EMBO Rep. 2020 Nov 5;21(11):e51787. doi: 10.15252/embr.202051787. Epub 2020 Nov 1. EMBO Rep. 2020. PMID: 33135287 Free PMC article.
References
Publication types
MeSH terms
Substances
Grants and funding
- European Society of Clinical Microbiology and Infectious Diseases (ESCMID)
- INFLAME 804249/EC | H2020 | H2020 Priority Excellent Science | H2020 European Research Council (ERC)
- AJE20151034460/Fondation pour la Recherche Médicale (FRM)
- ATIP-Avenir
- JP19fk0108047/Research ProGram on Emerging and Re-emerging Infectious Diseases
- JP19fm0208018/Japanese Initiative for Progress of Research on Infectious Diseases for Global Epidemic
- 19jm0210067h/MEXT | JST | Strategic International Collaborative Research Program (SICORP)
- 19H04809/Grant-in-Aid for Scientific Research on Innovative Areas
- 18KK0226/Grant-in-Aid for Scientific Research
- 18H02642/Grant-in-Aid for Scientific Research
- 19H00970/Ministry of Education, Culture, Sports, Science and Technology of Japan
LinkOut - more resources
Full Text Sources
Molecular Biology Databases
Research Materials

