. 2020 Dec 7;219(12):e202002020.
doi: 10.1083/jcb.202002020.

Kinetochore phosphatases suppress autonomous Polo-like kinase 1 activity to control the mitotic checkpoint

Affiliations

Kinetochore phosphatases suppress autonomous Polo-like kinase 1 activity to control the mitotic checkpoint

Marilia H Cordeiro et al. J Cell Biol. .

Abstract

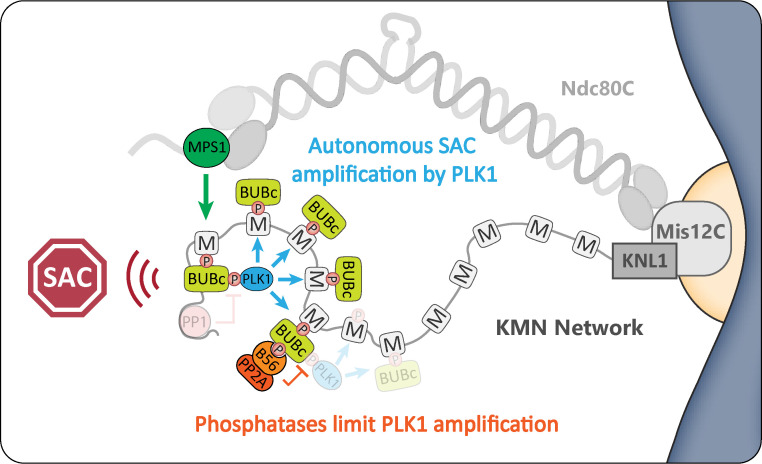
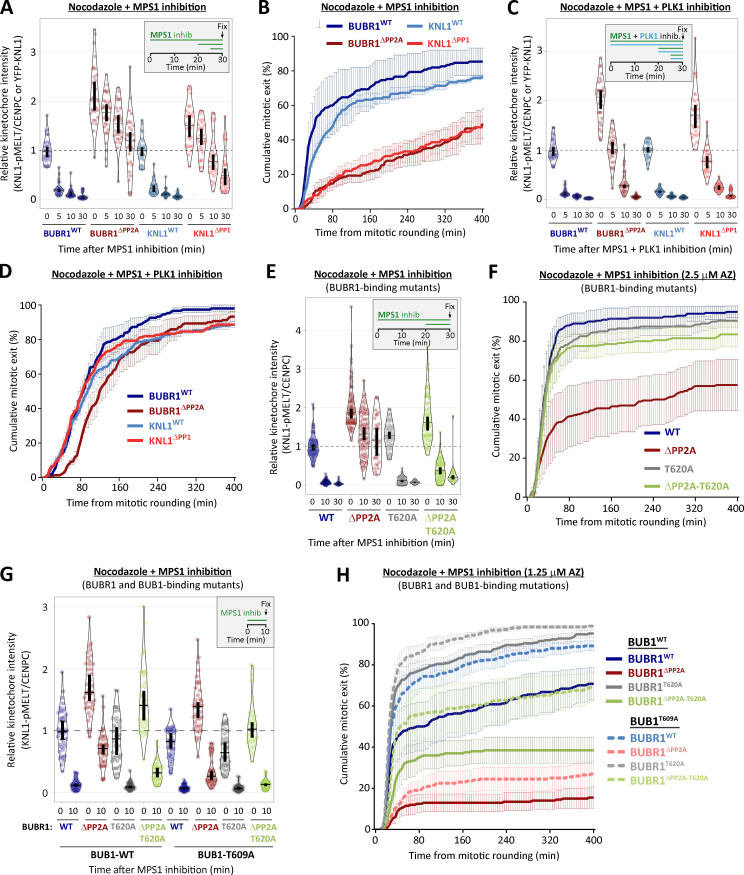
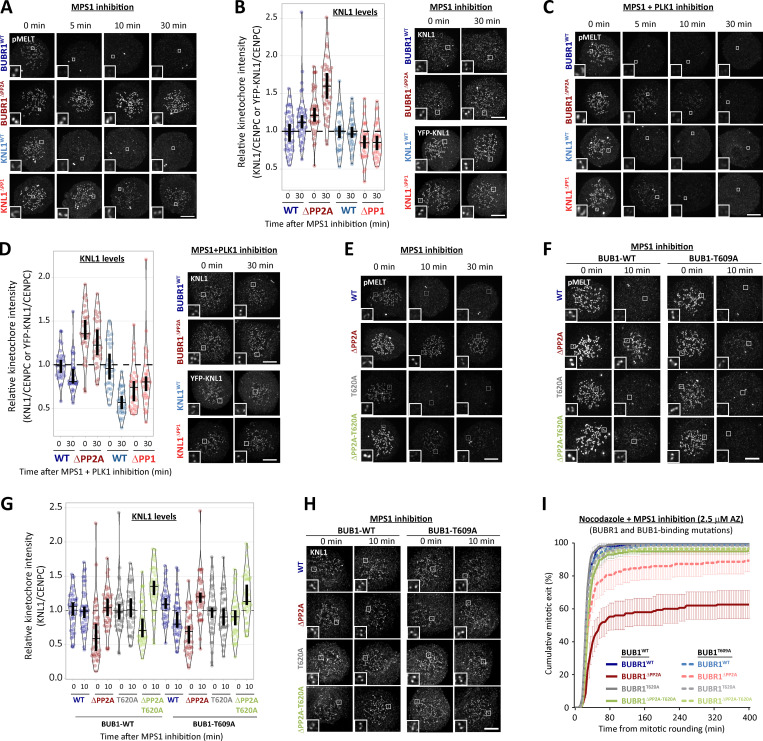
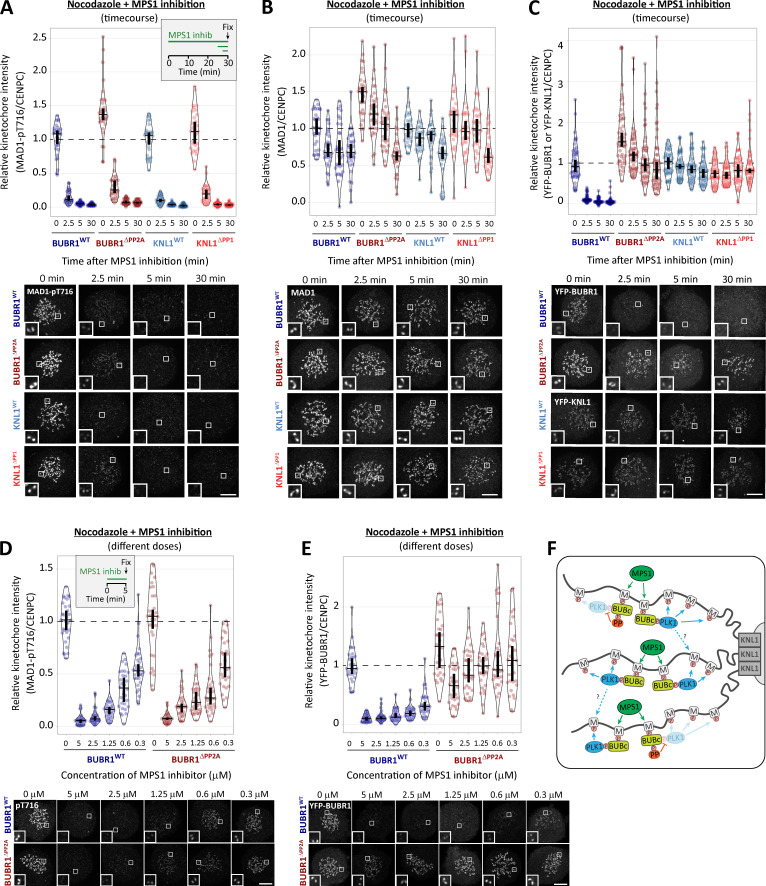
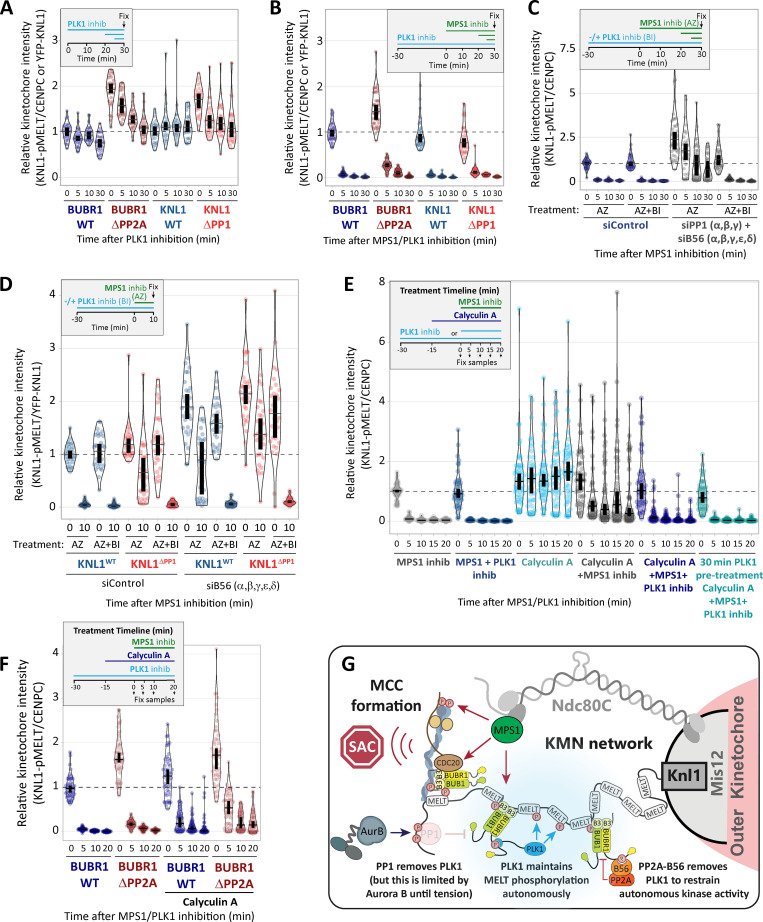
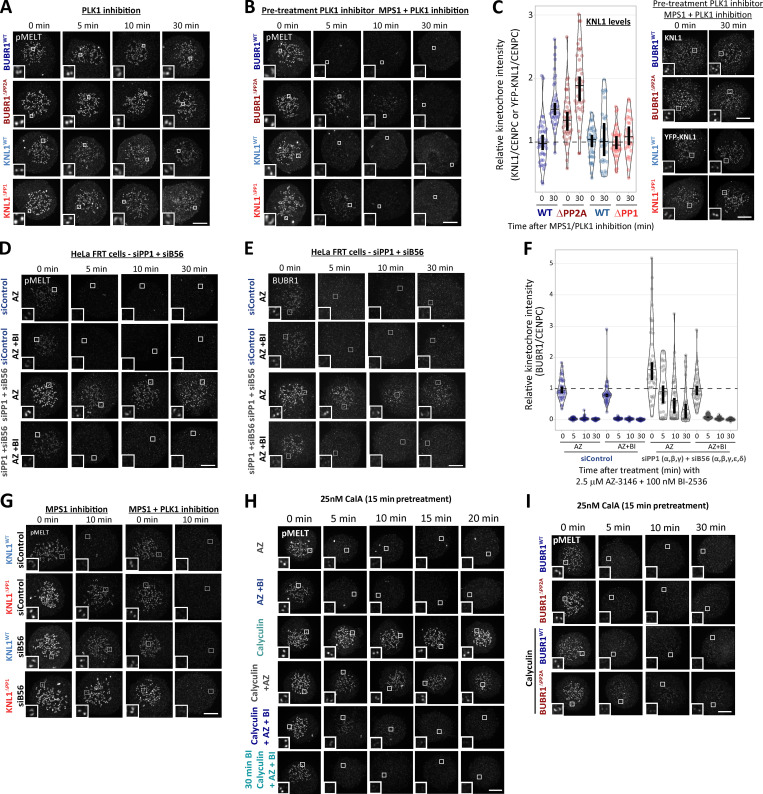
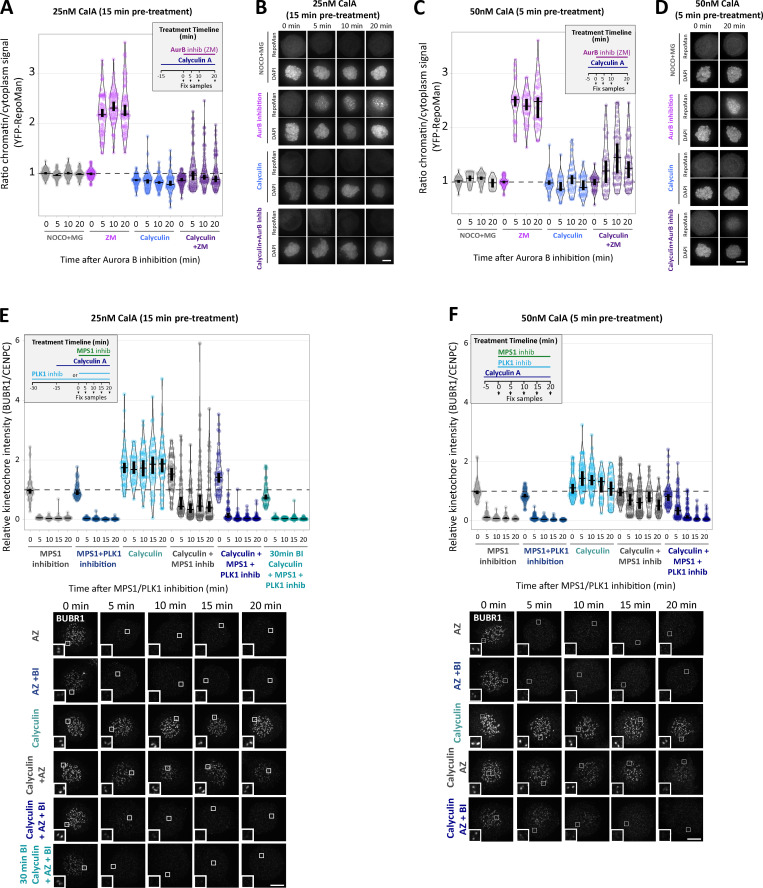
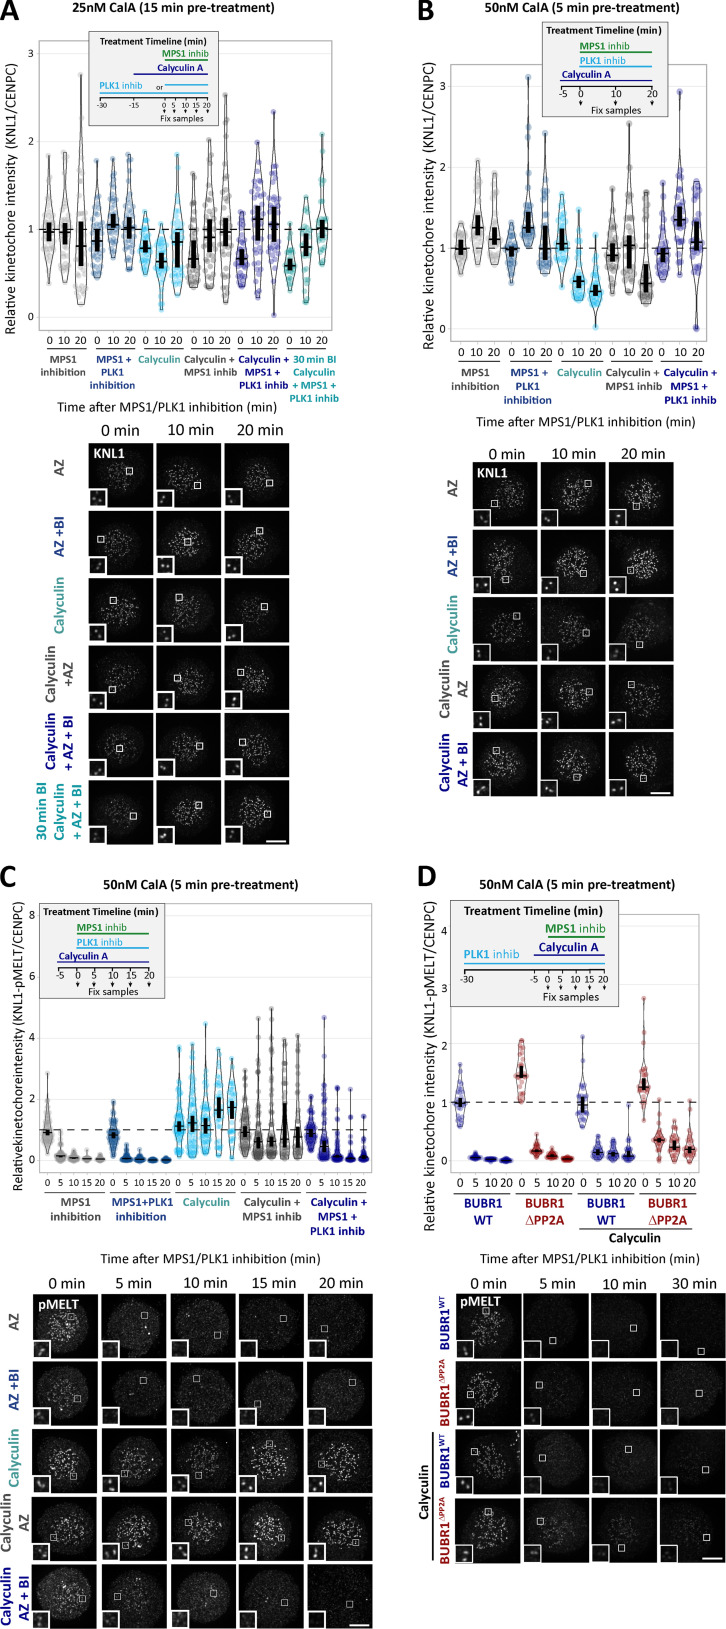
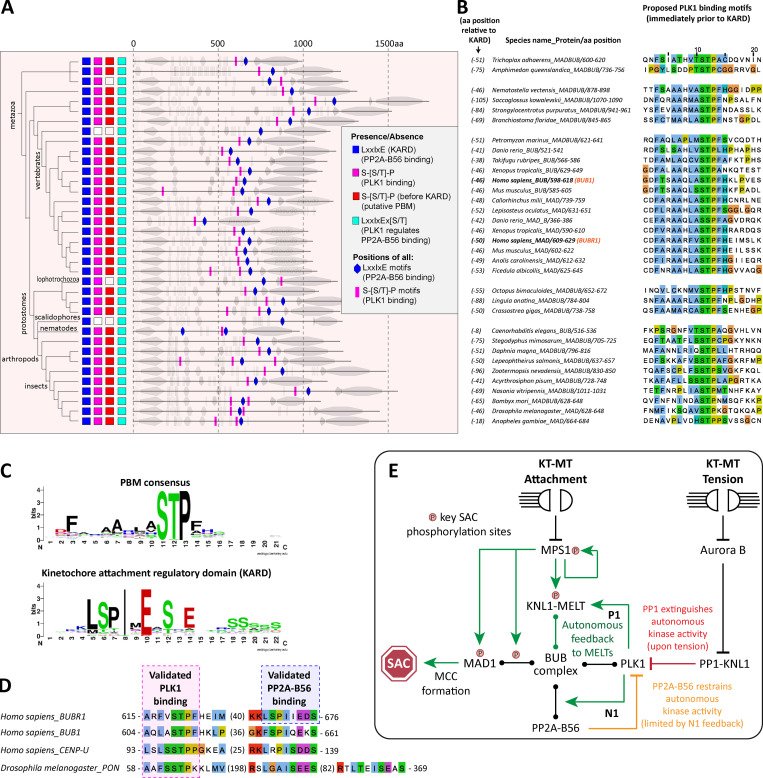
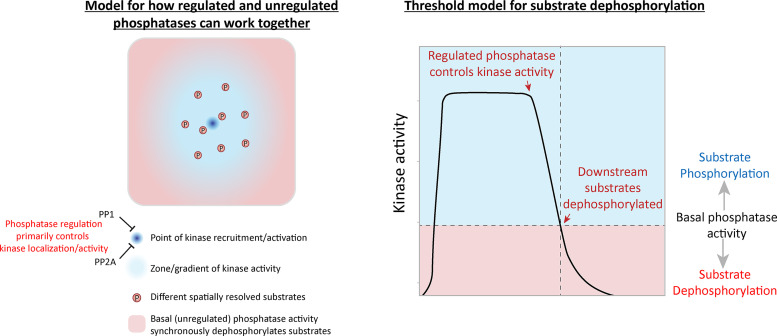
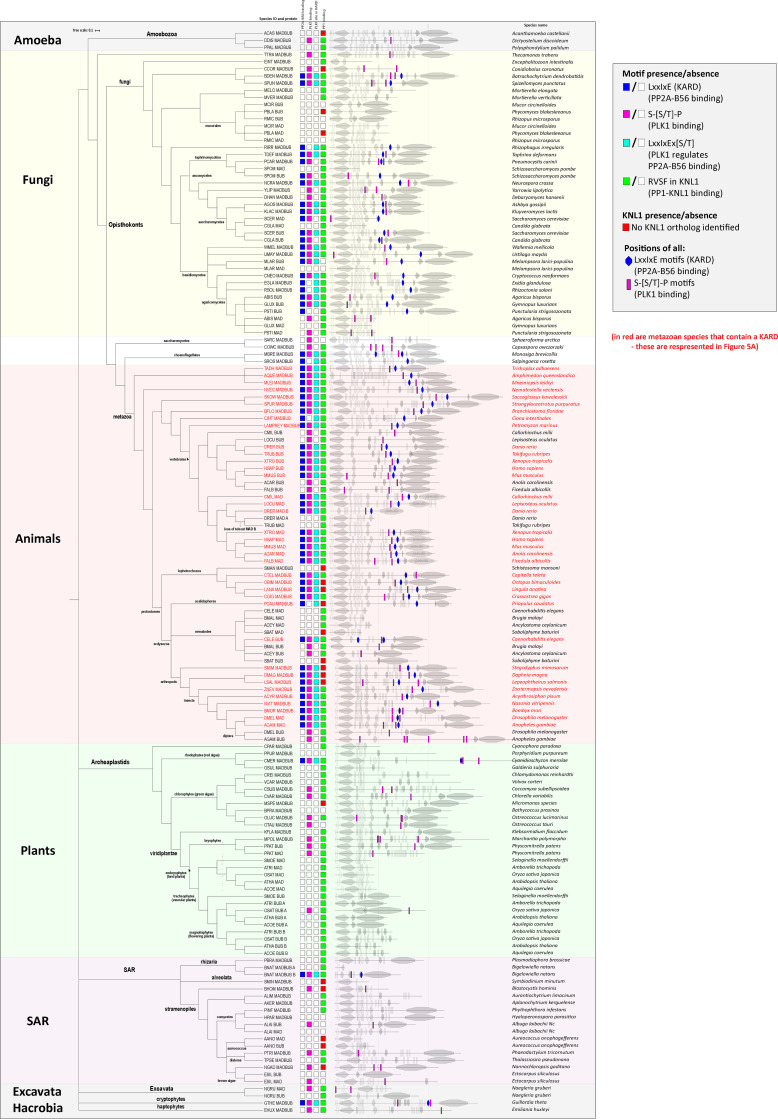
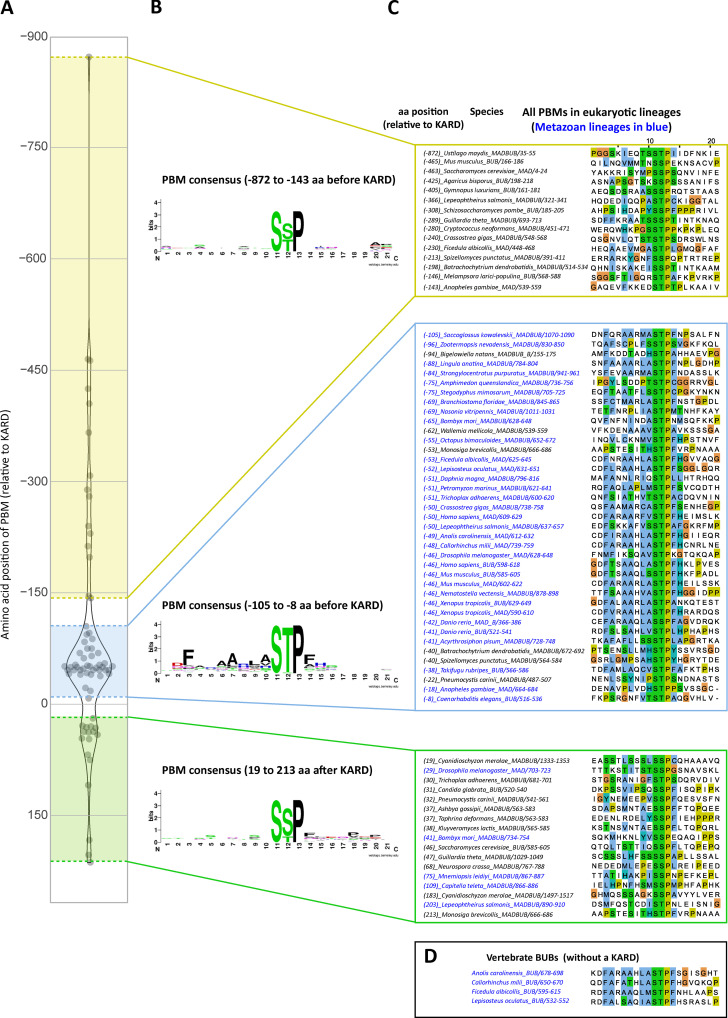
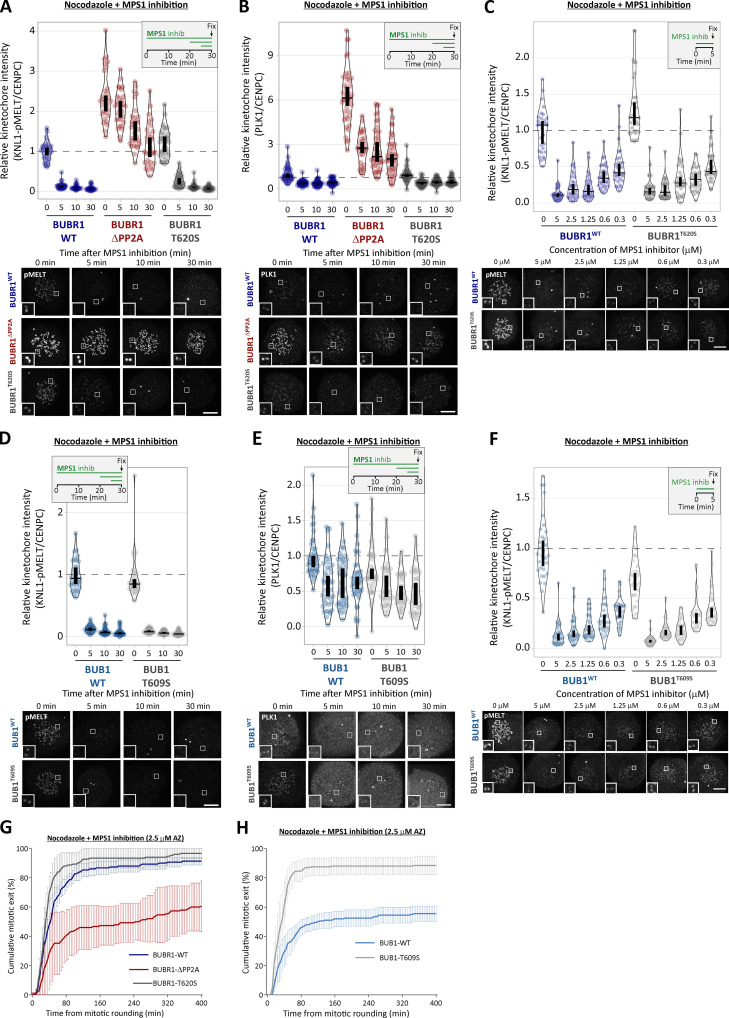
Local phosphatase regulation is needed at kinetochores to silence the mitotic checkpoint (a.k.a. spindle assembly checkpoint [SAC]). A key event in this regard is the dephosphorylation of MELT repeats on KNL1, which removes SAC proteins from the kinetochore, including the BUB complex. We show here that PP1 and PP2A-B56 phosphatases are primarily required to remove Polo-like kinase 1 (PLK1) from the BUB complex, which can otherwise maintain MELT phosphorylation in an autocatalytic manner. This appears to be their principal role in the SAC because both phosphatases become redundant if PLK1 is inhibited or BUB-PLK1 interaction is prevented. Surprisingly, MELT dephosphorylation can occur normally under these conditions even when the levels or activities of PP1 and PP2A are strongly inhibited at kinetochores. Therefore, these data imply that kinetochore phosphatase regulation is critical for the SAC, but primarily to restrain and extinguish autonomous PLK1 activity. This is likely a conserved feature of the metazoan SAC, since the relevant PLK1 and PP2A-B56 binding motifs have coevolved in the same region on MADBUB homologues.


Figures

None
Graphical abstract
Figure 1.
Figure 1.
Kinetochore phosphatases PP1 and PP2A-B56 antagonize PLK1 recruitment to the BUB complex. (A–C) Effect of phosphatase-binding mutants on levels of PLK1 (A), BUBR1-pT620 (B), and BUB1-pT609 (C) at unattached kinetochores in nocodazole-arrested cells. Mean kinetochore intensities from 30–50 cells, three to five experiments. (D and E) Effect of mutating the PLK1 binding site on BUBR1 (pT620) alone (D) or BUBR1 (pT620) and BUB1 (pT609; E) on PLK1 kinetochore levels in nocodazole-arrested BUBR1WT/ΔPP2A cells. Mean kinetochore intensities from 40 cells per condition, four experiments. All values in E are normalized to BUBR1-WT+BUB1-WT control. For all kinetochore intensity graphs, each dot represents a cell, and the error bars display the variation between the experimental repeats (displayed as ±SD of the experimental means). Two-tailed, nonparametric Mann-Whitney unpaired t tests were performed to compare the mean values between experimental groups. Example immunofluorescence images were chosen that most closely resemble the mean values in the quantifications. The insets show magnifications of the outlined regions. Scale bars, 5 µm. Inset size, 1.5 µm. ****, P < 0.0001; ns, nonsignificant.
Figure S1.
Figure S1.
Effect of BUB1/BUBR1 knockdown in PLK1, BUBR1, and BUB1 kinetochore levels (related to Fig. 1). (A–C) Relative kinetochore levels of PKL1 (A), BUBR1 (B), and BUB1 (C) after siRNA-mediated depletion of BUB1, BUBR1, or both BUB1 and BUBR1 combined in HeLa FRT cells. Graphs show the mean kinetochore intensity of 40–60 cells per condition, four experiments. For all kinetochore intensity graphs, each dot represents a cell, and the error bars display the variation between the experimental repeats (displayed as ±SD of the experimental means). Two-tailed, nonparametric Mann-Whitney unpaired t tests were performed to compare the means values between experimental groups. Example immunofluorescence images were chosen that most closely resemble the mean values in the quantifications. The insets show magnifications of the outlined regions. Scale bars, 5 µm. Inset size, 1.5 µm. ****, P < 0.0001.
Figure S2.
Figure S2.
Testing specificity of phospho-specific antibodies in cells and quantification of kinetochore BUB1 and BUBR1 levels in phosphatase-binding mutants (related to Fig. 1). (A) Mitotic cells expressing exogenous BUB1 and BUBR1 constructs were treated with/without 50 nM calyculin for 20 min before harvesting for lysis to maximally phosphorylate BUB1/BUBR1. YFP-tagged BUB1 and BUBR1, mutated in the Polo-box binding sites, were immunoprecipitated and blotted with indicated antibodies. Blots from a single experiment were chosen that best represent three independent experiments. (B and C) Effect of mutating the Polo-box binding motifs (BUBR1T620A and BUB1T609A) on antibody detection of BUBR1 pT620 (B) and BUB1 pT609 (C) by immunofluorescence. These experiments were performed in combination with either mutating the phosphatase binding motif on BUBR1 (B) or siRNA-mediated knockdown of all B56 isoforms (C) to elevate BUBR1/BUB1 phosphorylation to maximal levels. The graphs show the mean kinetochore intensity of 40 cells from four experiments. (D and E) Kinetochore quantification of BUB1 (D) and BUBR1 (E) levels in phosphatase-binding mutants. D displays 30 cells from three experiments, and E shows 30–40 cells from two or three experiments. For all kinetochore intensity graphs, each dot represents a cell, and the error bars display the variation between the experimental repeats (displayed as ±SD of the experimental means). Two-tailed, nonparametric Mann-Whitney unpaired t tests were performed to compare the means values between experimental groups. Example immunofluorescence images were chosen that most closely resemble the mean values in the quantifications. The insets show magnifications of the outlined regions. Scale bars, 5 µm. Inset size, 1.5 µm. **, P < 0.01; ****, P < 0.0001.
Figure 2.
Figure 2.
Kinetochore phosphatases PP1 and PP2A-B56 remove PLK1 from the BUB complex to silence the SAC. (A–D) Effects of phosphatase-binding mutants on KNL1-MELT dephosphorylation (A and C) and duration of mitotic arrest (B and D) in nocodazole-arrested cells treated with MPS1 inhibitor AZ-3146 (2.5 µM) either alone (A and B) or in combination with the PLK1 inhibitor BI-2536 (100 nM; C and D). MG132 was included in all MELT phosphorylation experiments to prevent mitotic exit after addition of the MPS1 inhibitor. A and C display kinetochore intensities from 30 cells per condition, three experiments. Intensities are relative to CENP-C in BUBR1 cells or YFP-KNL1 in KNL1 cells, and all BUBR1 and KNL1 intensities are normalized to their respective WT, 0 min time point. B and D show mean (±SD) of 150 cells per condition from three experiments. (E and F) Effect of mutating the PLK1 binding site on BUBR1 (pT620) on MELT dephosphorylation (E) and mitotic exit (F) in nocodazole-arrested BUBR1WT/ΔPP2A cells, treated as in A and B. E displays kinetochore intensities of 30–80 cells per condition from three to seven experimental repeats. F shows the means (±SD) of 200 cells from four experiments. (G and H) Effect of mutating both PLK1 binding sites BUBR1 (pT620) and BUB1 (pT609) on MELT dephosphorylation (G) and mitotic exit (H) in nocodazole-arrested cells, treated with MPS1 inhibitor AZ-3146 (2.5 µM in G and 1.25 µM in H). The 1.25 µM AZ dose was selected because it is then possible to see effects that weaken or strengthen the WT SAC response (2.5 µM AZ-3146 data are displayed in Fig. S3 I). G displays kinetochore intensities of 40 cells per condition from four experimental repeats, and all intensities are normalized to BUBR1-WT+BUB1-WT control. H shows the means (±SEM) of 200–250 cells from four or five experiments. In all kinetochore intensity graphs, each dot represents the mean kinetochore intensity of a cell, and the violin plots shows the distribution of intensities between cells. The thick vertical lines represent a 95% CI around the median, which can be used for statistical comparison of multiple time points/treatments by eye (see Materials and methods). Timelines indicate treatment regimen before fixation.
Figure S3.
Figure S3.
PLK1 inhibition or removal from BUB complex restores SAC silencing in the phosphatase-binding mutants (related to Fig. 2). (A) Example immunofluorescence images of the kinetochore quantifications shown in Fig. 2 A. (B) Representative images and quantification of KNL1 (BUBR1WT/ΔPP2A cells) or YFP-KNL1 (KNL1WT/ΔPP1 cells) after MPS1 inhibition with AZ-3146 (2.5 µM), as in Fig. 2 A. Graph represents 40 cells from four experiments. (C) Representative immunofluorescence images of quantifications shown in Fig. 2 C. (D) Representative images and quantification of KNL1 (BUBR1 cells) or YFP-KNL1 (KNL1 cells) after MPS1 inhibition with AZ-3146 (2.5 µM) in combination with the PLK1 inhibitor BI-2536 (100 nM), as in Fig. 2 C. Graph represents 30 cells from three experiments. (E and F) Example immunofluorescence images of the kinetochore quantifications shown in Fig. 2 E (E) and Fig. 2 G (F). (G and H) Quantification of KNL1 levels (G) and representative images (H) of BUBR1/BUB1 Polo-box–binding mutants treated with MPS1 inhibitor (2.5 µM AZ-3146), as in Fig. 2 G. Graph shows median of 40 cells per condition from four experiments. (I) Effect of mutating both PLK1 binding sites BUBR1 (pT620) and BUB1 (pT609) on mitotic exit in nocodazole-arrested cells, treated with MPS1 inhibitor AZ-3146 (2.5 µM). Graph shows the means (±SEM) of 150–200 cells from three or four experiments. The images were chosen that most closely resemble the mean values in the quantifications. The insets show magnifications of the outlined regions. Scale bars, 5 µm. Inset size, 1.5 µm.
Figure 3.
Figure 3.
PP1 and PP2A-B56 removal from kinetochores does not affect dephosphorylation of MAD1-pT716 following MPS1 inhibition. (A) Effects of phosphatase-binding mutants on MAD1-pT716 dephosphorylation in nocodazole-arrested cells treated with MPS1 inhibitor AZ-3146 (2.5 µM), as indicated in the timeline. Graph displays kinetochore intensities of 30 cells per condition from three experimental repeats. (B and C) Total MAD1 (B) and YFP (C) levels in phosphatase-binding mutants treated as in A. B displays kinetochore intensities of 30 cells per condition from three experimental repeats, and C is derived from 60 cells, six experiments. (D and E) MAD1-pT716 (D) and YFP-BUBR1 (E) kinetochore levels after 5 min of MPS1 inhibition with different concentrations of AZ-3146 (0.3–5 µM) in nocodazole-arrested cells. Graphs display kinetochore intensities of 30 cells, three experiments. (F) Schematic model to illustrate how PLK1 recruitment to multiple MELT motifs can amplify the SAC signal. M, MELT motif; BUBc, BUB complex; PP, PP2A-B56. In all kinetochore intensity graphs, each dot represents the mean kinetochore intensity of a cell, and the violin plots shows the distribution of mean intensities between cells. The thick vertical lines represent a 95% CI around the median, which can be used for statistical comparison of multiple time point/treatments by eye (see Materials and methods). Timelines indicate treatment regimen before fixation. MG132 was included in combination with MPS1 inhibitor in every case to prevent mitotic exit. Representative images were chosen that most closely resemble the mean values in the quantifications. The insets show magnifications of the outlined regions. Scale bars, 5 µm. Inset size, 1.5 µm.
Figure 4.
Figure 4.
PP1/PP2A inhibition cannot prevent MELT dephosphorylation if MPS1 and PLK1 are inhibited together. (A and B) Effects of phosphatase-binding mutants on KNL1-MELT dephosphorylation in nocodazole-arrested cells treated with PLK1 inhibitor BI-2536 (100 nM) alone (A) or in combination with MPS1 inhibitor AZ-3146 (2.5 µM; B), as indicated in the timelines. Intensities are relative to CENP-C in BUBR1 cells or YFP-KNL1 in KNL1 cells, and all BUBR1 and KNL1 intensities are normalized to their respective WT, 0 min time point. (C and D) KNL1-MELT phosphorylation levels following combined siRNA-mediated knockdown of all PP1 and B56 isoforms (C) or all B56 isoforms in KNL1WT/ΔPP1 cells (D). The quantifications are from nocodazole-arrested cells treated with MPS1 inhibitor AZ-3146 (2.5 µM) alone or in combination with PLK1 inhibitor BI-2536 (100 nM), as indicated. Representative images are displayed in Fig. S4, D and G. (E) KNL1-MELT dephosphorylation in Hela FRT cells arrested in nocodazole treated with kinase inhibitors in the presence or absence of the PP1/PP2A phosphatase inhibitor calyculin A (25 nM), as indicated. Representative images are displayed in Fig. S4 H. (F) Effects of PP2A-binding mutants in combination with the PP1/PP2A phosphatase inhibitor calyculin A (25 nM) on pMELT dephosphorylation in nocodazole-arrested cells treated with PLK1 (100 nM BI-2536) and MPS1 (2.5 µM AZ-3146) inhibitors, as indicated in the timeline. Representative images are displayed in Fig. S4 I. In all kinetochore intensity graphs, each dot represents the mean kinetochore intensity of a cell, and the violin plots shows the distribution of mean intensities between cells. The thick vertical lines represent a 95% CI around the median, which can be used for statistical comparison of multiple time point/treatments by eye (see Materials and methods). A–D derived from 30–40 cells per condition, three or four experiments. E and F display 40–50 cells, four or five experiments. Timelines indicate treatment regimen before fixation. MG132 was included in whenever MPS1 was inhibited to prevent mitotic exit. (G) Schematic model to show how kinetochore phosphatases restrain (PP2A) or extinguish (PP1) autonomous PLK1 activity to control the SAC. MCC, mitotic checkpoint complex.
Figure S4.
Figure S4.
Representative images from kinetochore quantifications in Fig. 4. (A and B) Example immunofluorescence images of the kinetochore quantifications shown in Fig. 4 A (A) and Fig. 4 B (B). (C) Representative images and quantification of KNL1 (BUBR1 cells) or YFP-KNL1 (KNL1 cells) after 30 min pretreatment with PLK1 inhibitor followed by coinhibition with MPS1 and PLK1 inhibitors, as in Fig. 4 B. Graph represents 40 cells from four experiments. (D–F) Immunofluorescence images of pMELT (D) and BUBR1 (E), and kinetochore quantification BUBR1 (F) from cells treated as in Fig. 4 C. Graph shows median of 30–40 cells per condition from three or four experiments. (G–I) Representative immunofluorescence images of the kinetochore quantifications shown in Fig. 4 D (G), Fig. 4 E (H), and Fig. 4 F (I). MG132 was included in combination with MPS1 inhibitor in every case to prevent mitotic exit. For all graphs, each dot represents a cell, and vertical bars show 95% CIs. All images were chosen that most closely resemble the mean values in the quantifications. Scale bars, 5 µm. Inset size, 1.5 µm.
Figure S5.
Figure S5.
Example images and kinetochore quantification of BUBR1 and RepoMan after calyculin A treatment with 25 nM and 50 nM doses (related to Fig. 4). (A–D) Quantifications (A and C) and representative images (B and D) of YFP-RepoMan signal on chromatin and cytoplasm to confirm phosphatase inhibition with 25 nM calyculin A (A and B) or 50 nM calyculin A (C and D) treatment regimens. Panel A represents 70 cells from four experiments, and C represents 20–45 cells from two or three experiments. (E) Kinetochore BUBR1 quantifications from cells treated with 25 nM calyculin A as in Fig. 4 E. Graph shows median of 40–50 cells per condition from four or five experiments. (F) Kinetochore levels of BUBR1 after phosphatase inhibition with 50 nM calyculin A. Graph represents 30–60 cells per condition from three to six experiments. MG132 was included in combination with MPS1 inhibitor in every case to prevent mitotic exit. For all graphs, each dot represents a cell, and vertical bars show 95% CIs. All images were chosen that most closely resemble the mean values in the quantificaions. The insets show magnifications of the outlined regions. Scale bars, 5 µm. Inset size, 1.5 µm.
Figure S6.
Figure S6.
Example images and kinetochore quantification KNL1 and KNL1-pMELT after calyculin A treatment with 25 nM and 50 nM doses (related to Fig. 4). (A) Quantification of KNL1 levels in cells treated with 25 nM calyculin as in Fig. 4 E. Graph shows 30–40 cells per condition from three or four experiments. (B and C) Kinetochore levels of KNL1 (B) and pMELT (C) after treatment with 50 nM calyculin A. B displays 30 cells from three experiments, and C represents 50–70 cells from five to seven experiments. (D) Effects of PP2A-binding mutants in combination with the PP1/PP2A phosphatase inhibitor calyculin A (50 nM) on pMELT dephosphorylation in nocodazole-arrested cells treated with PLK1 (100 nM BI-2536) and MPS1 (2.5 µM AZ-3146) inhibitors, as indicated in the timeline. Graph displays kinetochore intensities of 30 cells per condition from three experimental repeats. MG132 was included in combination with MPS1 inhibitor in every case to prevent mitotic exit. For all graphs, each dot represents a cell, and vertical bars show 95% CIs. All images were chosen that most closely resemble the mean values in the quantifications. The insets show magnifications of the outlined regions. Scale bars, 5 µm. Inset size, 1.5 µm.
Figure 5.
Figure 5.
Evolution of PBMs and PP2A-B56 binding motifs (KARD) in MADBUB homologues. (A) Annotation of PBMs (Ser-Ser/Thr-Pro) and PP2A-B56 binding motifs (LxxIxE, KARD) positions within metazoan MADBUB homologues that contain a KARD. Adapted from Tromer et al. (2016); see Fig. S8 and Data S1 for complete list of 152 eukaryotic MADBUB homologues. (B) Alignment of proposed PBM (located immediately before the KARD) in the species represented in A. (C) Consensus sequence of PBMs listed in B (for consensus motif of other PBMs within eukaryotic MADBUB homologues, see Fig. S9) and the KARD within all eukaryotic MADBUB homologues. (D) Alignment of PBM and KARD in BUBR1, BUB1, PON, and CENP-U. Note: PON is a Drosophila gene with no known homologues in humans, which is involved in mitotic asymmetric division during Drosophila brain development (Lu et al., 1998). (E) Schematic model to illustrate relevant feedback loops involved in SAC activation and silencing (see Results and discussion for explanations). KT-MT, kinetochore-microtubule.
Figure S7.
Figure S7.
Model for how localized processes could use a combination of regulated and unregulated phosphatase activity to synchronously dephosphorylate spatially resolved substrates (related to Fig. 4).
Figure S8.
Figure S8.
Annotation of putative PBMs and PP2A-B56 binding motifs (KARD) within eukaryotic MADBUB homologues (related to Fig. 5). Adapted from Tromer et al. (2016).
Figure S9.
Figure S9.
Sequence alignment of all PBM in eukaryotic MADBUB homologues with respect to position from the KARD (related to Fig. 5). (A) Distribution of the PBMs with respect to the distance from the KARD position (zero). Positive values represent PBM after KARD and negative values represent PBM before KARD. (B and C) Consensus sequence (B) and sequence alignment (C) of the PBM depending on the relative position from KARD motif. (D) PBM sequence alignment of vertebrate BUBs without a KARD.
Figure S10.
Figure S10.
Thr-to-Ser conversion in the PBM of BUB1 or BUBR1 does not increase PLK1 levels or delay MELT dephosphorylation after MPS1 inhibition (related to Fig. 5). (A and B) Effect of Thr-to-Ser conversion in BUB1 (T609S) on kinetochore levels of pMELT (A) and PLK1 (B) after MPS1 inhibition with 2.5 µM AZ-3146. A shows 30 cells per condition from three experiments, and B represents 30–40 cells from three or four experiments. (C) MELT phosphorylation levels in BUB1-T609S cells after 5 min of MPS1 inhibition with different concentrations of AZ-3146 (0.3–5 µM) in nocodazole-arrested cells. Graphs display kinetochore intensities of 30 cells, three experiments. (D and E) Effect of Thr-to-Ser conversion in BUBR1 (T620S) in pMELT (D) and PLK1 (E) levels after MPS1 inhibition (2.5 µM AZ-3146). D represents 30 cells from three experiments, and E shows 40 cells from four experiments. (F) MELT phosphorylation levels in BUBR1-T620S cells after 5 min of MPS1 inhibition with different concentrations of AZ-3146 (0.3–5 µM) in nocodazole-arrested cells. Graphs display kinetochore intensities of 20–30 cells, two or three experiments. (G and H) Effect of BUBR1-T620S (G) and BUB1-T609S (H) mutations on mitotic exit in nocodazole-arrested cells treated with MPS1 inhibitor (2.5 µM AZ-3146). G shows the means (±SEM) of 150 cells from three experiments, and H shows 200 cells from four experiments. MG132 was included in combination with MPS1 inhibitor in every case to prevent mitotic exit. For all graphs, each dot represents a cell, and vertical bars show 95% CIs. All images were chosen that most closely resemble the mean values in the quantifications. Scale bars, 5 µm. Inset size, 1.5 µm.

Comment in

References

    1. Alexander, J., Lim D., Joughin B.A., Hegemann B., Hutchins J.R., Ehrenberger T., Ivins F., Sessa F., Hudecz O., Nigg E.A., et al. . 2011. Spatial exclusivity combined with positive and negative selection of phosphorylation motifs is the basis for context-dependent mitotic signaling. Sci. Signal. 4:ra42. 10.1126/scisignal.2001796 - DOI - PMC - PubMed
    1. Allan, L.A., Camacho Reis M., Ciossani G., Huis In ’t Veld P.J., Wohlgemuth S., Kops G.J., Musacchio A., and Saurin A.T.. 2020. Cyclin B1 scaffolds MAD1 at the kinetochore corona to activate the mitotic checkpoint. EMBO J. 39:e103180. 10.15252/embj.2019103180 - DOI - PMC - PubMed
    1. Aravamudhan, P., Goldfarb A.A., and Joglekar A.P.. 2015. The kinetochore encodes a mechanical switch to disrupt spindle assembly checkpoint signalling. Nat. Cell Biol. 17:868–879. 10.1038/ncb3179 - DOI - PMC - PubMed
    1. Bader, J.R., and Vaughan K.T.. 2010. Dynein at the kinetochore: Timing, Interactions and Functions. Semin. Cell Dev. Biol. 21:269–275. 10.1016/j.semcdb.2009.12.015 - DOI - PMC - PubMed
    1. Benzi, G., Camasses A., Atsunori Y., Katou Y., Shirahige K., and Piatti S.. 2020. A common molecular mechanism underlies the role of Mps1 in chromosome biorientation and the spindle assembly checkpoint. EMBO Rep. 21:e50257. 10.15252/embr.202050257 - DOI - PMC - PubMed

Publication types

MeSH terms