. 2020 Oct 30;16(10):e1009022.
doi: 10.1371/journal.pgen.1009022. eCollection 2020 Oct.

Transcriptome and epigenome diversity and plasticity of muscle stem cells following transplantation

Affiliations

Transcriptome and epigenome diversity and plasticity of muscle stem cells following transplantation

Brendan Evano et al. PLoS Genet. .

Abstract

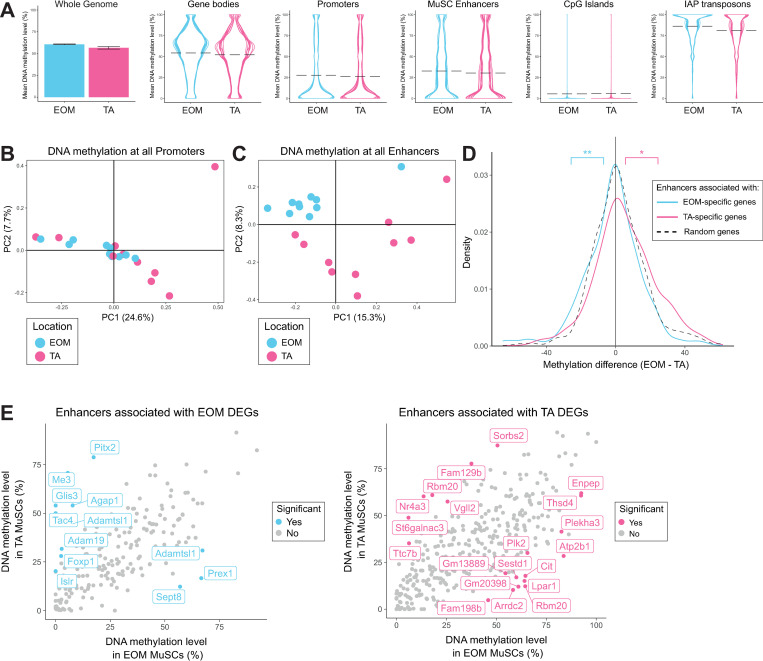
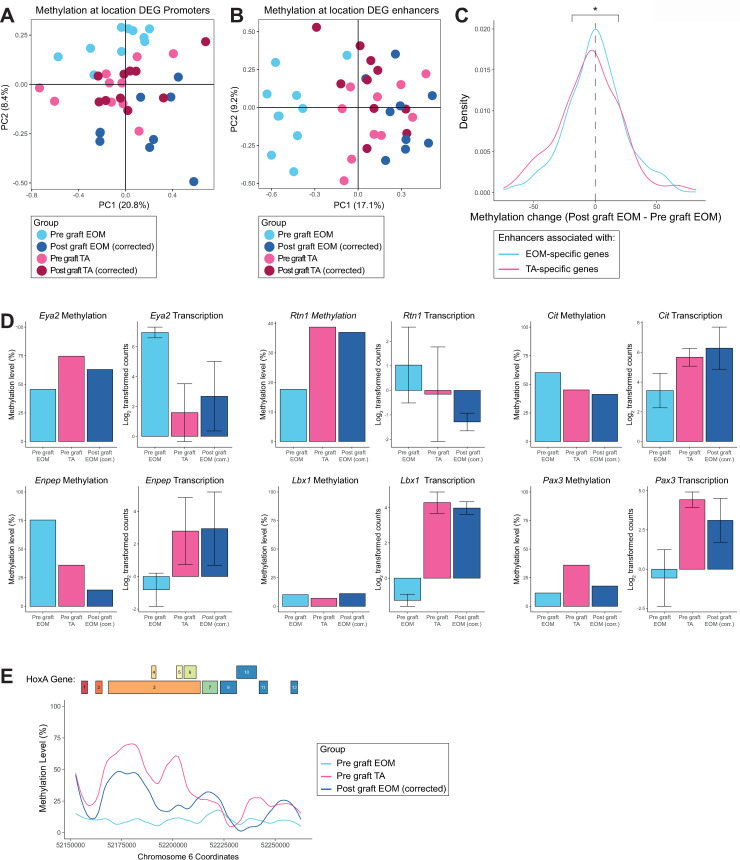
Adult skeletal muscles are maintained during homeostasis and regenerated upon injury by muscle stem cells (MuSCs). A heterogeneity in self-renewal, differentiation and regeneration properties has been reported for MuSCs based on their anatomical location. Although MuSCs derived from extraocular muscles (EOM) have a higher regenerative capacity than those derived from limb muscles, the molecular determinants that govern these differences remain undefined. Here we show that EOM and limb MuSCs have distinct DNA methylation signatures associated with enhancers of location-specific genes, and that the EOM transcriptome is reprogrammed following transplantation into a limb muscle environment. Notably, EOM MuSCs expressed host-site specific positional Hox codes after engraftment and self-renewal within the host muscle. However, about 10% of EOM-specific genes showed engraftment-resistant expression, pointing to cell-intrinsic molecular determinants of the higher engraftment potential of EOM MuSCs. Our results underscore the molecular diversity of distinct MuSC populations and molecularly define their plasticity in response to microenvironmental cues. These findings provide insights into strategies designed to improve the functional capacity of MuSCs in the context of regenerative medicine.


Conflict of interest statement

I have read the journal's policy and the authors of this manuscript have the following competing interests: W.R. is a consultant and shareholder of Cambridge Epigenetix. T.S. is CEO and shareholder of Chronomics. All other authors declare no competing interests.

Figures

Fig 1
Fig 1. Head and limb-derived MuSCs display specific transcriptome signatures.
(A) Experimental scheme. Head and limb MuSCs were isolated by FACS from EOM and TA muscles respectively, from Tg:Pax7-nGFP adult mice and processed through RNA- and bisulfite-sequencing. N = 10 mice, n = 500 cells/mouse (S1 Table). (B) PCA analysis of EOM and TA MuSC transcriptomes. The first principal component separates samples based on their anatomical location. (C) Volcano plot showing the results of differential expression analysis of EOM and TA MuSCs. Genes that demonstrated a fold change greater than 2 and a p-value less than 0.05 according to DESeq2 were classified as differentially expressed and colour-coded by their tissue specificity. (D) Selected markers and differentially expressed genes between EOM and TA MuSCs. Error bars represent the standard deviation of the mean. p-values were determined by DESeq2. *** p < 0.001, ** p < 0.01, * p < 0.05. (E) Gene expression analysis throughout the HoxA, HoxB, HoxC and HoxD clusters in EOM (left) and TA (middle) MuSCs. Genes were colour-coded according to their antero-posterior expression domain in mouse at embryonic day 12.5 (right, adapted from [57]).
Fig 2
Fig 2. Head and limb-derived MuSCs display specific DNA methylation patterns at enhancers.
(A) DNA methylation levels of the whole genome, promoters, enhancers, gene bodies, CpG islands and IAP repeat elements in EOM and TA MuSCs. The mean DNA methylation level across the whole genome is represented as a bar chart with error bars representing the standard deviation between samples. The mean DNA methylation levels of individual genomic elements are represented as violin plots to highlight their distribution. Each line in the violin plots represents a different sample, mean values are indicated by dashed lines. Promoters were defined as -2000bp to 500bp of the TSS of Ensembl genes. H3K27ac peaks were called using macs2 on H3K27ac ChIP-seq data obtained from [58]. Enhancers were defined as H3K27ac peaks that did not overlap promoters. Enhancers were linked to genes based on proximity. Overall DNA methylation was similar between the two locations, though EOM MuSCs had slightly higher levels of DNA methylation relative to TA MuSCs. (B) PCA analysis of DNA methylation at promoters fails to separate EOM and TA samples based on their anatomical location. (C) PCA analysis of DNA methylation at enhancers separates EOM and TA samples based on their anatomical location. (D) Density plots showing methylation differences between EOM and TA MuSCs at enhancers associated with location-specific genes (enhancer regions within 1 Mb to the closest transcription start site of a DEG). Enhancers associated with EOM genes (n = 198) were significantly hypomethylated in EOM relative to TA MuSCs when compared to a random subset of enhancers (n = 350), while enhancers associated with TA genes (n = 346) were significantly hypermethylated in the same comparison. ** p < 0.01, * p < 0.05 by Welch’s t test. (E) Scatter plots comparing the mean DNA methylation levels of enhancers associated with location DEGs in EOM and TA MuSCs. Enhancers were colour-coded as significant if they were also found to be differentially methylated by a rolling Z score approach (p < 0.05) when comparing the methylation levels of all enhancers in EOM and TA MuSCs (S2B Fig). The significant enhancers have been labelled with their associated gene. Only a subset of enhancers associated with location DEGs were differentially methylated. More enhancers associated with EOM DEGs were hypermethylated in TA than in EOM MuSCs. Likewise, more enhancers associated with TA DEGs were hypermethylated in EOM than in TA MuSCs.
Fig 3
Fig 3. Head-derived MuSCs adopt a limb-like transcriptome upon transplantation in limb muscles.
(A) Experimental scheme. EOM and TA-derived MuSCs were engrafted into pre-injured recipient TA muscles. After regeneration, engrafted MuSCs were re-isolated and processed through RNA- and BS-sequencing. ‘Post-graft’ MuSCs were compared to their ‘Pre-graft’ counterparts. N = 10 donor mice and N = 10 recipient mice. For each donor mouse, equal number of EOM and TA MuSCs (in the range of 10,000 cells) were transplanted to TA muscles of the same recipient mouse. For each donor muscle, 500 pre-graft cells and 60 re-isolated post-graft cells (mean value) were analysed (S1 Table). (B) Expression analysis of EOM post-graft and EOM pre-graft. Each dot represents a gene. Genes are colour-coded according to their fold change in pre-graft TA vs EOM MuSCs (from Fig 1, without transplantation). Note that genes highly expressed in pre-graft TA MuSCs (from Fig 1, coloured in pink) were mostly upregulated in EOM MuSCs following grafting, while genes highly expressed in pre-graft EOM MuSCs (from Fig 1, coloured in blue) were mostly downregulated in EOM MuSCs following grafting. (C) PCA analysis of TA pre-graft, EOM pre-graft and EOM post-graft MuSCs using the expression values of genes differentially expressed between EOM and TA pre-graft MuSCs. PC1 separates EOM and TA MuSCs and shows that after engrafting EOM MuSCs into the TA muscle, they resemble transcriptionally TA MuSCs more than EOM MuSCs. (D) (left) Classification of EOM and TA-specific genes as resistant, responsive, or intermediate upon heterotopic transplantation of EOM MuSCs. Determining the responsiveness of each gene to transplantation was carried out in two steps. First, expression values for TA-specific genes (resp EOM-specific) in pre-graft MuSCs were rescaled to 0–100, where 0 represented the mean expression in EOM (resp TA) MuSCs and 100 represented the mean expression in TA (resp EOM) MuSCs. Next, the expression of EOM and TA-specific genes were rescaled similarly in post-graft EOM MuSCs. Each dark blue dot represents a gene with corresponding rescaled value in post-graft EOM MuSCs. EOM-specific genes with rescaled values in post-graft EOM MuSCs less than 25 were classified as responsive, between 25 and 75 as intermediate and above 75 as resistant. TA-specific genes with rescaled values in post-graft EOM MuSCs less than 25 were classified as resistant, between 25 and 75 as intermediate and above 75 as responsive. (right) Distribution of responses of EOM and TA-specific genes in post-graft EOM MuSCs. (E) Expression of selected markers between TA pre-graft, EOM pre-graft and EOM post-graft MuSCs. Many TA marker genes were upregulated to TA-like levels when EOM MuSCs were grafted into TA muscle. In addition, some EOM marker genes such as Lmx1a and Mobp were downregulated in this scenario. *** p < 0.001, ** p < 0.01, * p < 0.05 by Welch’s t test. (F) Gene expression analysis throughout the HoxA, HoxB, HoxC and HoxD clusters in post-graft EOM (heterologous graft, left panel) and TA (homologous graft, middle panel) MuSCs. Genes were colour-coded according to their antero-posterior expression domain in mouse at embryonic day 12.5 (right panel, adapted from [57]). All TA-specific Hox genes were upregulated in post-graft EOM MuSCs. See Fig 1E for pre-graft expression levels in EOM and TA MuSCs.
Fig 4
Fig 4. DNA methylation at enhancers partially accounts for the transcriptome plasticity of MuSCs upon heterotopic transplantation.
(A) PCA analysis of TA pre-graft, EOM pre-graft and EOM post-graft MuSCs DNA methylation at promoters fails to separate samples based on anatomical location. (B) PCA analysis of TA pre-graft, EOM pre-graft and EOM post-graft MuSCs DNA methylation at enhancers separates samples based on anatomical location and demonstrates that EOM MuSCs after grafting resemble TA MuSCs at an epigenetic level in the enhancer context. (C) Density plots of the methylation difference between post-graft EOM MuSCs and pre-graft EOM MuSCs at enhancers associated with EOM or TA upregulated genes. EOM enhancers became hypermethylated in EOM MuSCs after grafting into the TA environment, while TA enhancers were hypomethylated. * p < 0.05 by Student’s t test. (D) Enhancer methylation and gene expression levels of selected EOM and TA DEGs that are responsive to grafting. (E) DNA methylation level across the HoxA gene cluster in pre-graft EOM, pre-graft TA and post-graft EOM samples. The HoxA region was highly methylated in TA MuSCs but not in EOM MuSCs. Notably, DNA methylation was gained across this region when EOM MuSCs were grafted into TA muscle.

References

    1. von Maltzahn J, Jones AE, Parks RJ, Rudnicki MA. Pax7 is critical for the normal function of satellite cells in adult skeletal muscle. Proc Natl Acad Sci. 2013;110:16474–16479. 10.1073/pnas.1307680110 - DOI - PMC - PubMed
    1. Sambasivan R, Yao R, Kissenpfennig A, Van Wittenberghe L, Paldi A, Gayraud-Morel B et al. Pax7-expressing satellite cells are indispensable for adult skeletal muscle regeneration. Development. 2011;138:3647–3656. 10.1242/dev.067587 - DOI - PubMed
    1. Lepper C, Partridge TA, Fan C-M. An absolute requirement for Pax7-positive satellite cells in acute injury-induced skeletal muscle regeneration. Development. 2011;138:3639–3646. 10.1242/dev.067595 - DOI - PMC - PubMed
    1. Webster C, Blau HM. Accelerated age-related decline in replicative life-span of Duchenne muscular dystrophy myoblasts: implications for cell and gene therapy. Somat Cell Mol Genet. 1990;16:557–565. 10.1007/BF01233096 - DOI - PubMed
    1. Blau HM, Webster C, Pavlath GK. Defective myoblasts identified in Duchenne muscular dystrophy. Proc Natl Acad Sci U S A. 1983;80:4856–4860. 10.1073/pnas.80.15.4856 - DOI - PMC - PubMed

Publication types

MeSH terms

LinkOut - more resources