

Computed tomography semi-automated lung volume quantification in SARS-CoV-2-related pneumonia
- PMID: 33125559
- PMCID: PMC7596627
- DOI: 10.1007/s00330-020-07271-0
Computed tomography semi-automated lung volume quantification in SARS-CoV-2-related pneumonia
Abstract
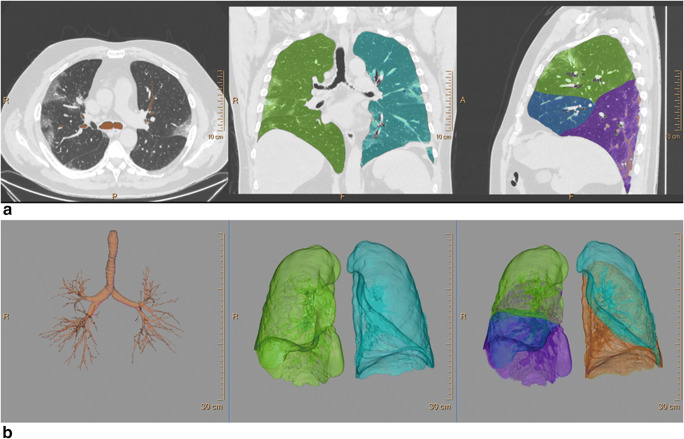
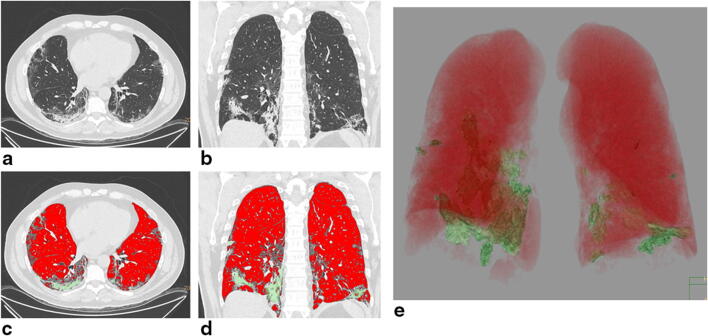
Objectives: To evaluate a semi-automated segmentation and ventilated lung quantification on chest computed tomography (CT) to assess lung involvement in patients affected by SARS-CoV-2. Results were compared with clinical and functional parameters and outcomes.
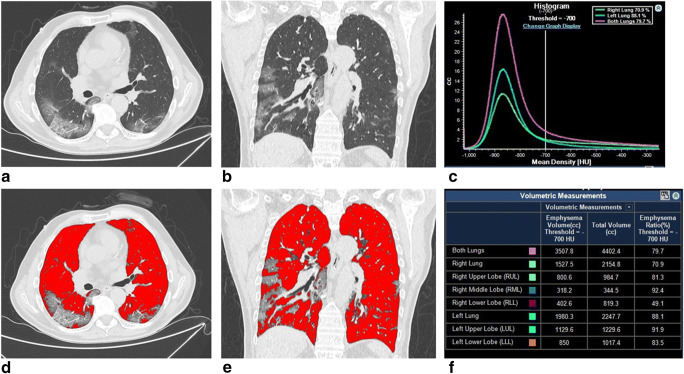
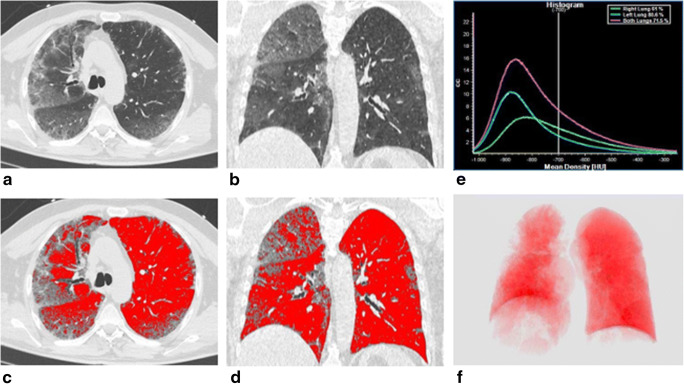
Methods: All images underwent quantitative analyses with a dedicated workstation using a semi-automatic lung segmentation software to compute ventilated lung volume (VLV), Ground-glass opacity (GGO) volume (GGO-V), and consolidation volume (CONS-V) as absolute volume and as a percentage of total lung volume (TLV). The ratio between CONS-V, GGO-V, and VLV (CONS-V/VLV and GGO-V/VLV, respectively), TLV (CONS-V/TLV, GGO-V/TLV, and GGO-V + CONS-V/TLV respectively), and the ratio between VLV and TLV (VLV/TLV) were calculated.
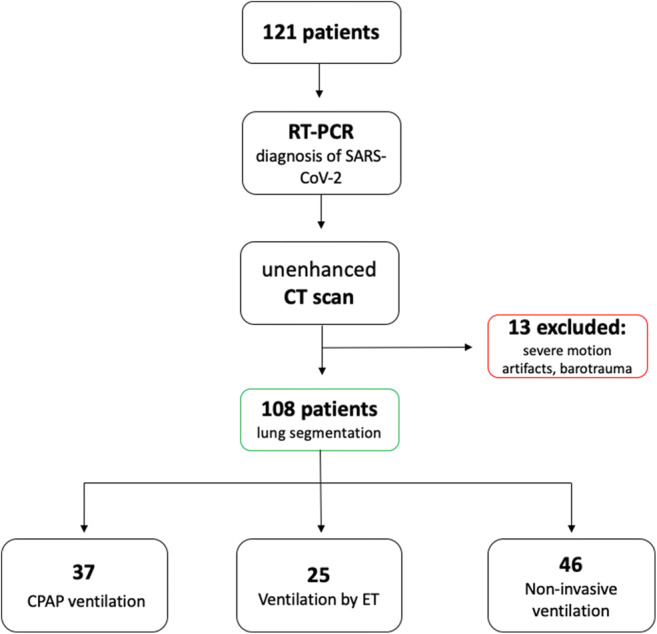
Results: A total of 108 patients were enrolled. GGO-V/TLV significantly correlated with WBC (r = 0.369), neutrophils (r = 0.446), platelets (r = 0.182), CRP (r = 0.190), PaCO2 (r = 0.176), HCO3- (r = 0.284), and PaO2/FiO2 (P/F) values (r = - 0.344). CONS-V/TLV significantly correlated with WBC (r = 0.294), neutrophils (r = 0.300), lymphocytes (r = -0.225), CRP (r = 0.306), PaCO2 (r = 0.227), pH (r = 0.162), HCO3- (r = 0.394), and P/F (r = - 0.419) values. Statistically significant differences between CONS-V, GGO-V, GGO-V/TLV, CONS-V/TLV, GGO-V/VLV, CONS-V/VLV, GGO-V + CONS-V/TLV, VLV/TLV, CT score, and invasive ventilation by ET were found (all p < 0.05).
Conclusion: The use of quantitative semi-automated algorithm for lung CT elaboration effectively correlates the severity of SARS-CoV-2-related pneumonia with laboratory parameters and the need for invasive ventilation.
Key points: • Pathological lung volumes, expressed both as GGO-V and as CONS-V, can be considered a useful tool in SARS-CoV-2-related pneumonia. • All lung volumes, expressed themselves and as ratio with TLV and VLV, correlate with laboratory data, in particular C-reactive protein and white blood cell count. • All lung volumes correlate with patient's outcome, in particular concerning invasive ventilation.
Keywords: Artificial intelligence; Computed tomography, X-ray; Infection, coronavirus; Lung volume measurements; Pneumonia.
Conflict of interest statement
Two of the authors (M.P. and S.T.) are affiliated with PHILIPS HEALTHCARE, as a specialist product, and they helped and supervised us during the use of COPD Software, without any financial support. The other authors of manuscript declare no relationships with any companies, whose products or services may be related to the subject matter of the article.
Figures
Similar articles
-
Clinical and laboratory data, radiological structured report findings and quantitative evaluation of lung involvement on baseline chest CT in COVID-19 patients to predict prognosis.Radiol Med. 2021 Jan;126(1):29-39. doi: 10.1007/s11547-020-01293-w. Epub 2020 Oct 12. Radiol Med. 2021. PMID: 33047295 Free PMC article.
-
[Quantitative analysis of chest CT in coronavirus infected patients and its correlation with clinical features].Zhonghua Wei Zhong Bing Ji Jiu Yi Xue. 2024 Dec;36(12):1238-1243. doi: 10.3760/cma.j.cn121430-20240422-00369. Zhonghua Wei Zhong Bing Ji Jiu Yi Xue. 2024. PMID: 39780665 Chinese.
-
COVID-19 pneumonia: computer-aided quantification of healthy lung parenchyma, emphysema, ground glass and consolidation on chest computed tomography (CT).Radiol Med. 2021 Apr;126(4):553-560. doi: 10.1007/s11547-020-01305-9. Epub 2020 Nov 18. Radiol Med. 2021. PMID: 33206301 Free PMC article.
-
Comparison of the computed tomography findings in COVID-19 and other viral pneumonia in immunocompetent adults: a systematic review and meta-analysis.Eur Radiol. 2020 Dec;30(12):6485-6496. doi: 10.1007/s00330-020-07018-x. Epub 2020 Jun 27. Eur Radiol. 2020. PMID: 32594211 Free PMC article.
-
Similarities and Differences of Early Pulmonary CT Features of Pneumonia Caused by SARS-CoV-2, SARS-CoV and MERS-CoV: Comparison Based on a Systemic Review.Chin Med Sci J. 2020 Sep 30;35(3):254-261. doi: 10.24920/003727. Chin Med Sci J. 2020. PMID: 32972503 Free PMC article.
Cited by
-
Artificial Intelligence in Lung Cancer Imaging: Unfolding the Future.Diagnostics (Basel). 2022 Oct 31;12(11):2644. doi: 10.3390/diagnostics12112644. Diagnostics (Basel). 2022. PMID: 36359485 Free PMC article. Review.
-
Well-Aerated Lung and Mean Lung Density Quantified by CT at Discharge to Predict Pulmonary Diffusion Function 5 Months after COVID-19.Diagnostics (Basel). 2022 Nov 23;12(12):2921. doi: 10.3390/diagnostics12122921. Diagnostics (Basel). 2022. PMID: 36552928 Free PMC article.
-
Lung volume measurement using chest CT in COVID-19 patients: a cohort study in Japan.BMJ Open Respir Res. 2024 Apr 24;11(1):e002234. doi: 10.1136/bmjresp-2023-002234. BMJ Open Respir Res. 2024. PMID: 38663888 Free PMC article.
-
Effects of Intravenous Infusion of Iodine Contrast Media on the Tracheal Diameter and Lung Volume Measured with Deep Learning-Based Algorithm.J Imaging Inform Med. 2024 Aug;37(4):1609-1617. doi: 10.1007/s10278-024-01071-4. Epub 2024 Mar 6. J Imaging Inform Med. 2024. PMID: 38448759 Free PMC article.
-
Different Lung Parenchyma Quantification Using Dissimilar Segmentation Software: A Multi-Center Study for COVID-19 Patients.Diagnostics (Basel). 2022 Jun 20;12(6):1501. doi: 10.3390/diagnostics12061501. Diagnostics (Basel). 2022. PMID: 35741310 Free PMC article.
References
-
- Use of laboratory methods for SARS diagnosis. In: who.int. https://www.who.int/csr/sars/labmethods/en/. Accessed 10 July 2020
MeSH terms
LinkOut - more resources
Full Text Sources
Medical
Research Materials
Miscellaneous
