Review
. 2021 Mar;38(3):187-196.
doi: 10.1002/yea.3530. Epub 2020 Dec 14.

The complex role of genetic background in shaping the effects of spontaneous and induced mutations

Affiliations
Review

The complex role of genetic background in shaping the effects of spontaneous and induced mutations

Ilan Goldstein et al. Yeast. 2021 Mar.

Abstract

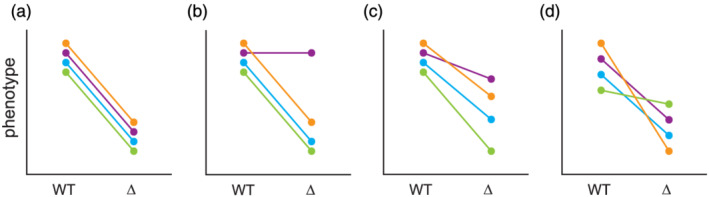
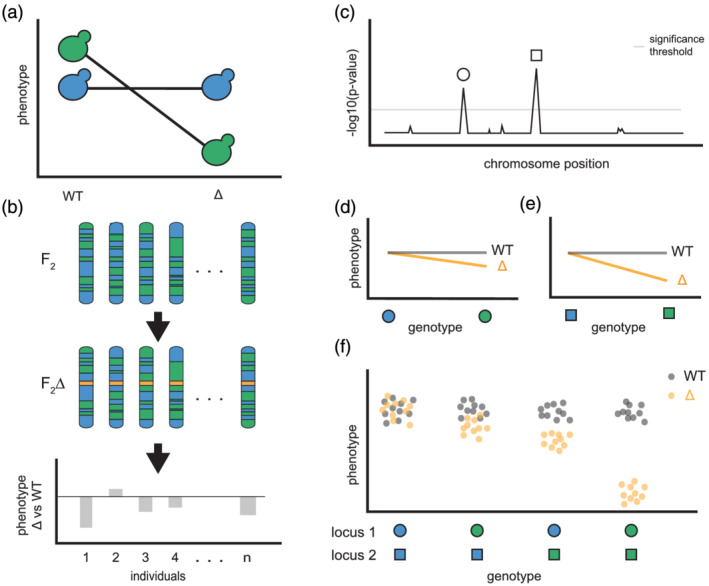
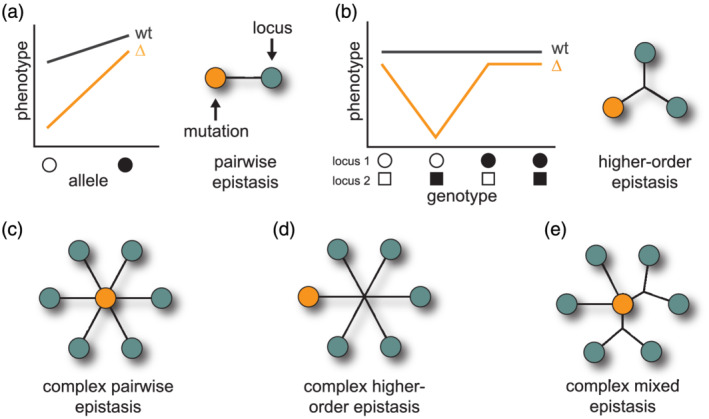
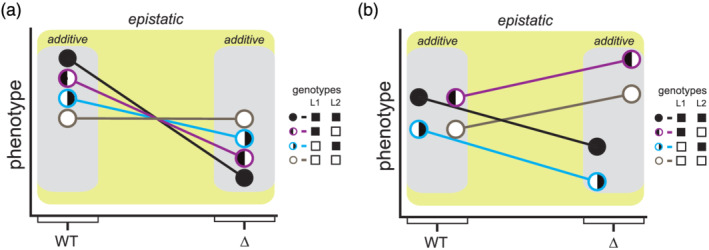
Spontaneous and induced mutations frequently show different phenotypic effects across genetically distinct individuals. It is generally appreciated that these background effects mainly result from genetic interactions between the mutations and segregating loci. However, the architectures and molecular bases of these genetic interactions are not well understood. Recent work in a number of model organisms has tried to advance knowledge of background effects both by using large-scale screens to find mutations that exhibit this phenomenon and by identifying the specific loci that are involved. Here, we review this body of research, emphasizing in particular the insights it provides into both the prevalence of background effects across different mutations and the mechanisms that cause these background effects.


Figures

FIGURE 1
FIGURE 1
Examples of background effects. Background effects show a variety of manifestations, some of which are included here. For simplicity, we focus on haploid individuals in which a gene is either present (WT) or absent (∆). Each genetically distinct individual is illustrated using two coloured points, which denote its phenotype in both the WT and ∆ states. A given individual's response to a mutation is represented by the line connecting its two dots. These plots are intended to show how background effects can be seen at both the levels of individuals and populations. (a) No background effect: Each individual genotype shows the same response to a mutation. (b) Incomplete penetrance: Some individuals show the same response to the mutation, whereas one individual exhibits no response. (c) Variable expressivity: Individuals that respond to the mutation do so in a quantitatively different manner. (d) Line crossing: Different responses to the mutations occur, but there is no overall change in total phenotypic variation. Contrasting (b) and (c), in which total phenotypic variation changes when the mutation is present or absent, against (d) shows how mutations may or may not affect total phenotypic variation among examined individuals [Colour figure can be viewed at wileyonlinelibrary.com]
FIGURE 2
FIGURE 2
Genetic dissection of background effects. Here, we show a general experimental and data analysis workflow that could be used to determine the genetic architecture underlying a background effect. (a) A mutation in haploid yeast negatively affects the green strain but has no effect on the blue strain. (b) A cross of blue and green strains yields haploid F 2 segregants. The mutation of interest (represented by a gold bar) is then introduced into each genotype, and the effect of the mutation on each genotype is measured. (c) Linkage mapping of response to the mutation identifies two loci that genetically interact with the mutation, which are denoted by the circle and square symbols. In (d) and (e), the genetic interactions between the mutation and each involved locus are examined. Individuals carrying the green allele for either locus show a decrease in phenotype when the mutation is present, whereas individuals with the blue allele show no change. (f) In this example, higher‐order epistasis between the mutation and the two loci causes the background effect. Here, neither locus contributes to phenotypic variation among wild‐type segregants. Each point in (f) represents a different segregant [Colour figure can be viewed at wileyonlinelibrary.com]
FIGURE 3
FIGURE 3
Forms of epistasis underlying background effects. Background effects arise because of epistasis between mutations and segregating loci. These genetic interactions can vary in the number of involved loci, as well as the contribution of higher‐order epistasis between a mutation and multiple loci. In (a) and (b), hypothetical genotype–phenotype relationships are shown for a pairwise genetic interaction between a mutation and a single locus and for a higher‐order genetic interaction between a mutation and two loci, respectively. Example graphical representations of these interactions are shown for each case. In this and subsequent higher‐order genetic interactions, the intersections of black lines are used to signify epistasis between a combination of more than two loci. In (c)–(e), different architectures of epistasis between mutations and loci are shown. (c) displays a mutation exhibiting a number of pairwise genetic interactions with loci. In contrast, (d) shows a mutation exhibiting higher‐order epistasis with many loci. (e) illustrates how a background effect could involve a mix of pairwise and higher‐order epistasis between a mutation and loci [Colour figure can be viewed at wileyonlinelibrary.com]
FIGURE 4
FIGURE 4
The role of epistasis in background effects is not inconsistent with the importance of additivity in conventional studies of complex traits. In this figure, we provide simple examples of how segregating loci may act additively in the presence or absence of a mutation but may show epistasis when the mutant and wild‐type individuals are combined together. For both plots, L1 and L2 denote two different loci that segregate within a population. The circles represent the expected mean for a particular two‐locus genotype class, with the genotype of the class indicated using black or white colouring inside the circle. In (a), L1 and L2 each have effects in both the presence and absence of the mutation. For both loci, the black allele produces higher phenotypic values when the mutation is absent, but lower phenotypic values when the mutation is absent. The change in the effects of these loci between mutant and wild‐type individuals represents epistasis between the mutation and loci. In (b), the effect of L1 remains the same in the presence of the mutation. In contrast, L2 has no effect among wild‐type individuals despite having an effect among mutants. Thus, introduction of the mutation leads to a significant change in the expected phenotypes of the different genotype classes [Colour figure can be viewed at wileyonlinelibrary.com]

Similar articles

Cited by

References

    1. Acuna‐Hidalgo, R. , Veltman, J. A. , & Hoischen, A. (2016). New insights into the generation and role of de novo mutations in health and disease. Genome Biology, 17(1), 1–19. - PMC - PubMed
    1. Barabási, A. L. , & Oltvai, Z. N. (2004). Network biology: Understanding the cell's functional organization. Nature Reviews Genetics, 5(2), 101–113. - PubMed
    1. Bergman, A. , & Siegal, M. L. (2003). Evolutionary capacitance as a general feature of complex gene networks. Nature, 424(6948), 549–552. 10.1038/nature01765 - DOI - PubMed
    1. Bloom, J. S. , Ehrenreich, I. M. , Loo, W. T. , Lite, T.‐L. V. , & Kruglyak, L. (2013). Finding the sources of missing heritability in a yeast cross. Nature, 494(7436), 234–237. - PMC - PubMed
    1. Bloom, J. S. , Kotenko, I. , Sadhu, M. J. , Treusch, S. , Albert, F. W. , & Kruglyak, L. (2015). Genetic interactions contribute less than additive effects to quantitative trait variation in yeast. Nature Communications, 6(1), 1–6. - PMC - PubMed

Publication types

LinkOut - more resources