. 2020 Nov 10;15(5):1047-1055.
doi: 10.1016/j.stemcr.2020.10.003. Epub 2020 Oct 29.

Relative Levels of Gli1 and Gli2 Determine the Response of Ventral Neural Stem Cells to Demyelination

Affiliations

Relative Levels of Gli1 and Gli2 Determine the Response of Ventral Neural Stem Cells to Demyelination

Daniel Z Radecki et al. Stem Cell Reports. .

Abstract

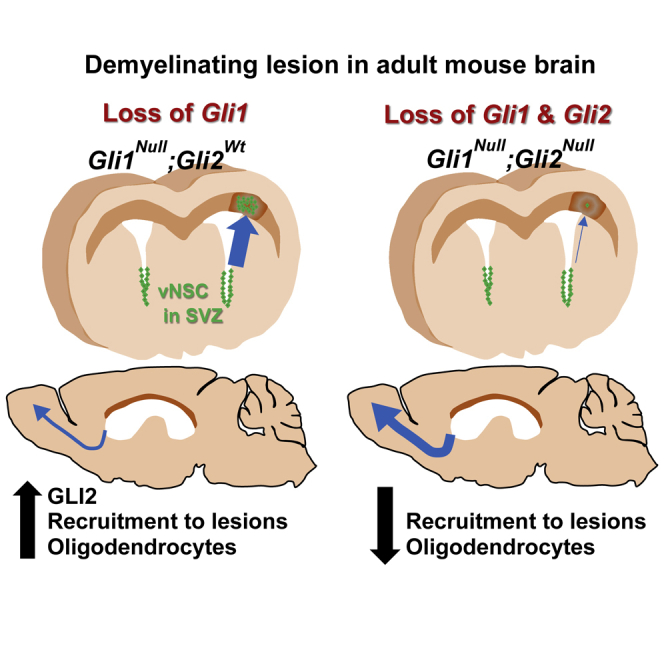
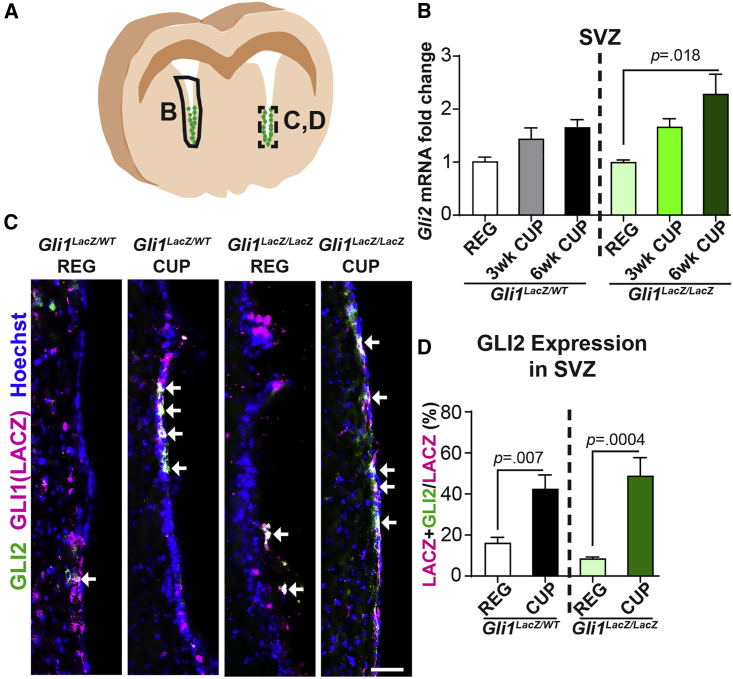
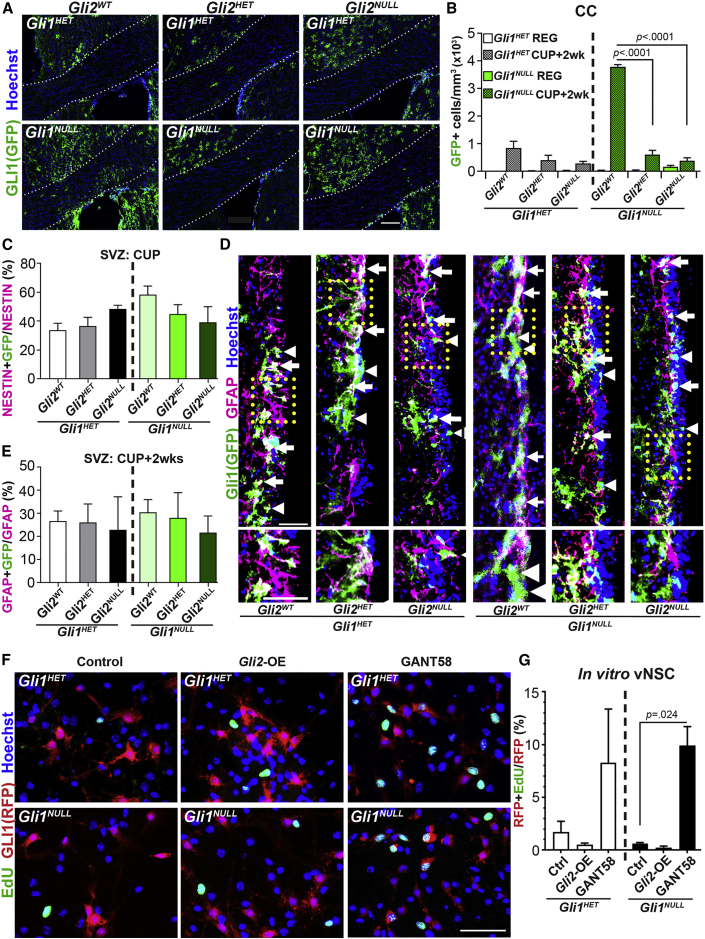
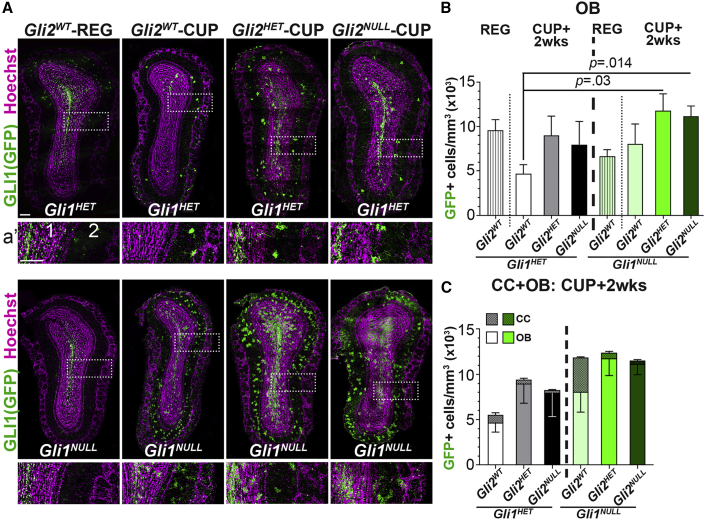
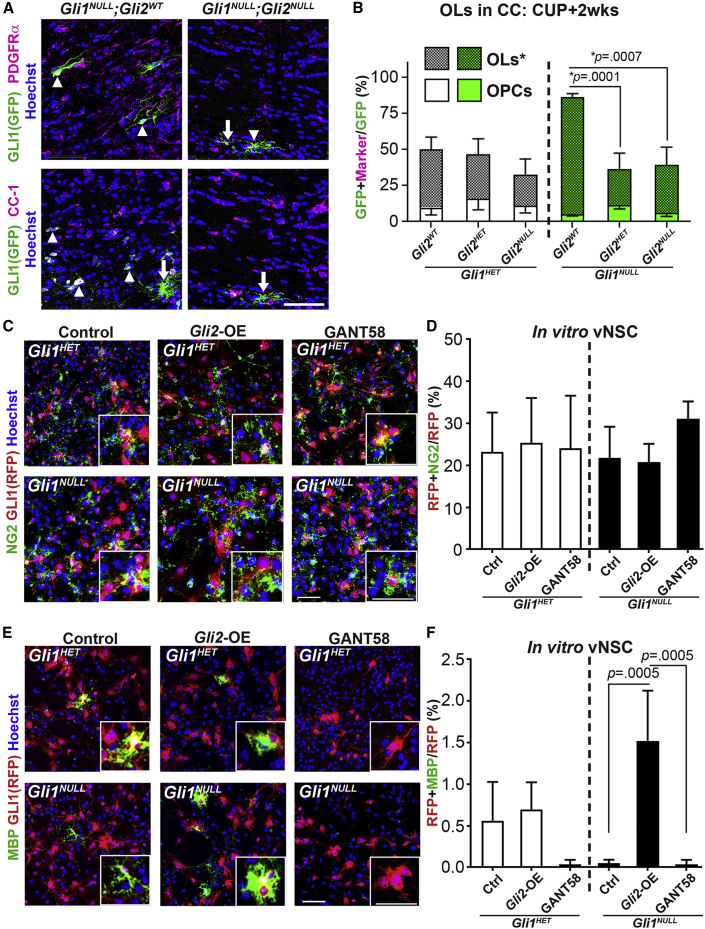
Enhancing repair of myelin is an important therapeutic goal in many neurological disorders characterized by demyelination. In the healthy adult brain, ventral neural stem cells (vNSCs) in the subventricular zone, marked by GLI1 expression, do not generate oligodendrocytes. However, in response to demyelination, their progeny are recruited to lesions where they differentiate into oligodendrocytes and ablation of GLI1 further enhances remyelination. GLI1 and GLI2 are closely related transcriptional activators but the role of GLI2 in remyelination by vNSCs is not clear. Here, we show that genetic ablation of Gli1 in vNSCs increases GLI2 expression and combined loss of both transcription factors decreases the recruitment and differentiation of their progeny in demyelinated lesions. These results indicate that GLI1 and GLI2 have distinct, non-redundant functions in vNSCs and their relative levels play an essential role in the response to demyelination.

Keywords: GLI1; GLI2; Gli1 inhibition; Gli2 inhibition; adult subventricular zone; neural stem cell; remyelination.


Figures

None
Graphical abstract
Figure 1
Figure 1
Gli2 Expression Increases in the Gli1NULL SVZ on Demyelination (A) Schematic for tissue harvested for qRT-PCR in (B) and immunofluorescence in (C and D). (B) qRT-PCR showing Gli2 mRNA expression in the SVZ on demyelination induced with 6 weeks of cuprizone diet. (C) Immunofluorescence for co-localization of Gli2 (green) and LacZ (magenta) in the ventral SVZ of mice on 6 weeks of regular or cuprizone diets. Scale bar, 50 μm. Hoechst, nuclei. (D) Quantification of the Gli1-LacZ NSCs co-expressing Gli2 in (C). One-way ANOVAs with Tukey's post-hoc t tests; data presented as mean ± SEM; n = 3 mice/group. SVZ, subventricular zone; CUP, cuprizone diet; REG, regular diet.
Figure 2
Figure 2
Ablation of Gli2 Decreases Recruitment of Gli1NULL vNSC Progeny to the White Matter Lesion. (A) Immunofluorescence for GFP + fate-mapped Gli1 cells in the CC of mice at 2 weeks of recovery from a cuprizone diet. Scale bar, 200 μm, n = 5 mice/group. (B) Quantification of the total number of fate-mapped Gli1HET (white) and Gli1NULL (green) vNSCs in (A). Two-way ANOVAs with Tukey's post-hoc t tests within Gli1HET and Gli1NULL groups; mean ± SEM. n = 5 mice/genotype. (C) Quantification of the proportion of GFP + fate-mapped Gli1 vNSCs co-expressing Nestin in the SVZ at 6 weeks of cuprizone diet. n = 3 mice/genotype. (D) Immunofluorescence for co-expression of GFAP (magenta) and GFP (green) in fate-mapped Gli1HET (left) or Gli1NULL (right) vNSCs in the SVZ at 2 weeks of recovery from a cuprizone diet. Gli1 + GFAP + NSCs (arrows); Gli1 + GFAP- cells (arrowheads). Inset shows enlarged boxed area. n = 3 mice/genotype, Scale bars, 50 μm. (E) Quantification of the proportion of fate-mapped Gli1 vNSCs co-expressing GFAP (D) in Gli1HET and Gli1NULL mice. n = 3 mice/genotype. (F) Immunofluorescence for EdU incorporation (green) in RFP + fate-mapped Gli1 vNSCs (red) from Gli1HET and Gli1NULL mice in vitro. n = 3 replicates, Scale bar, 50 μm. (G) Quantification of the proportion of RFP + fate-mapped Gli1 vNSCs labeled by EdU in (F). For (C), (E), and (G): one-way ANOVA within Gli1 groups followed by t tests comparing groups with controls. Data presented as mean ± SEM. CC, corpus callosum; SVZ, subventricular zone; CUP, cuprizone diet; REG, regular diet; Gli2-OE, Gli2 overexpression.
Figure 3
Figure 3
Ablation of Gli2 Increases Recruitment of Gli1NULL vNSC Progeny to the Olfactory Bulb (A) Immunofluorescence for GFP + fate-mapped vNSCs (green) in Gli1HET (top) and Gli1NULL (bottom) OB on regular diet or at 2 weeks of recovery from a cuprizone diet. (A’) Enlarged portion of the OB (dotted rectangle) showing (1) granule and (2) external plexiform layers. (B) Quantification of the fate-mapped Gli1HET and Gli1NULL vNSCs in (A). One-way ANOVAs followed by multiple t tests within Gli1 groups and comparing all groups with Gli1HET;Gli2WT controls. (C) Quantification of the combined number of fate-mapped Gli1HET and Gli1NULL cells in the CC and OB. One-way ANOVAs followed by multiple t tests within Gli1 groups. Data presented as mean ± SEM; n = 3 mice/genotype. Scale bar, 50 μm. OB, olfactory bulb; CC, corpus callosum; SVZ, subventricular zone; CUP, cuprizone diet; REG, regular diet.
Figure 4
Figure 4
Gli2 Promotes Oligodendrocyte Differentiation from vNSCs (A) Immunofluorescence for fate-mapped Gli1NULL vNSCs (green) co-expressing PDGFRα (OPC) or CC1 (OL) (magenta). n = 5 mice/genotype, GFP + cell (arrows) and marker + GFP co-expressing cells (arrowheads). (B) Quantification of the proportion of GFP + fate-mapped Gli1HET (white) and Gli1NULL (green) vNSCs that co-express markers of OPC (PDGFRα) and OL (CC1) in (B). (C) Immunofluorescence for OPCs (NG2, green) and RFP + Gli1 fate-mapped vNSCs (red) following overexpression (Gli2-OE) or inhibition (GANT58 treatment) of Gli2 in vitro. n = 3 replicates. (D) Quantification of Gli2 overexpression or inhibition in (C). (E) Immunofluorescence for MBP + mature OLs (green) and RFP + fate-mapped Gli1 vNSCs (red) following overexpression (Gli2-OE) or inhibition (GANT58 treatment) of Gli2 in vitro. n = 3 replicates. (F) Quantification of Gli2 overexpression (Gli2-OE) or inhibition (GANT58 treatment) in (E). One-way ANOVA with Tukey's post-hoc t tests within Gli1 genotypes; all data presented as mean ± SEM. Scale bars, 50 μm. CC, corpus callosum; OPC, oligodendrocyte progenitor cells; OL, oligodendrocyte; CUP, cuprizone diet; Gli2-OE, Gli2-overexpression.

References

    1. Ahn S., Joyner A.L. In vivo analysis of quiescent adult neural stem cells responding to Sonic hedgehog. Nature. 2005;437:894–897. - PubMed
    1. Ali S.A., Niu B., Cheah K.S.E., Alman B. Unique and overlapping GLI1 and GLI2 transcriptional targets in neoplastic chondrocytes. PLoS One. 2019;14:e0211333. - PMC - PubMed
    1. Bai C.B., Auerbach W., Lee J.S., Stephen D., Joyner A.L. Gli2, but not Gli1, is required for initial Shh signaling and ectopic activation of the Shh pathway. Development. 2002;129:4753–4761. - PubMed
    1. Brewster R., Mullor J.L., Ruiz i Altaba A. Gli2 functions in FGF signaling during antero-posterior patterning. Development. 2000;127:4395–4405. - PubMed
    1. Chaker Z., Codega P., Doetsch F. A mosaic world: puzzles revealed by adult neural stem cell heterogeneity. Wiley Interdiscip. Rev. Dev. Biol. 2016;5:640–658. - PMC - PubMed

Publication types

MeSH terms

LinkOut - more resources