

Single-Cell Transcriptomics Reveals Early Emergence of Liver Parenchymal and Non-parenchymal Cell Lineages
- PMID: 33125890
- PMCID: PMC7643810
- DOI: 10.1016/j.cell.2020.09.012
Single-Cell Transcriptomics Reveals Early Emergence of Liver Parenchymal and Non-parenchymal Cell Lineages
Abstract
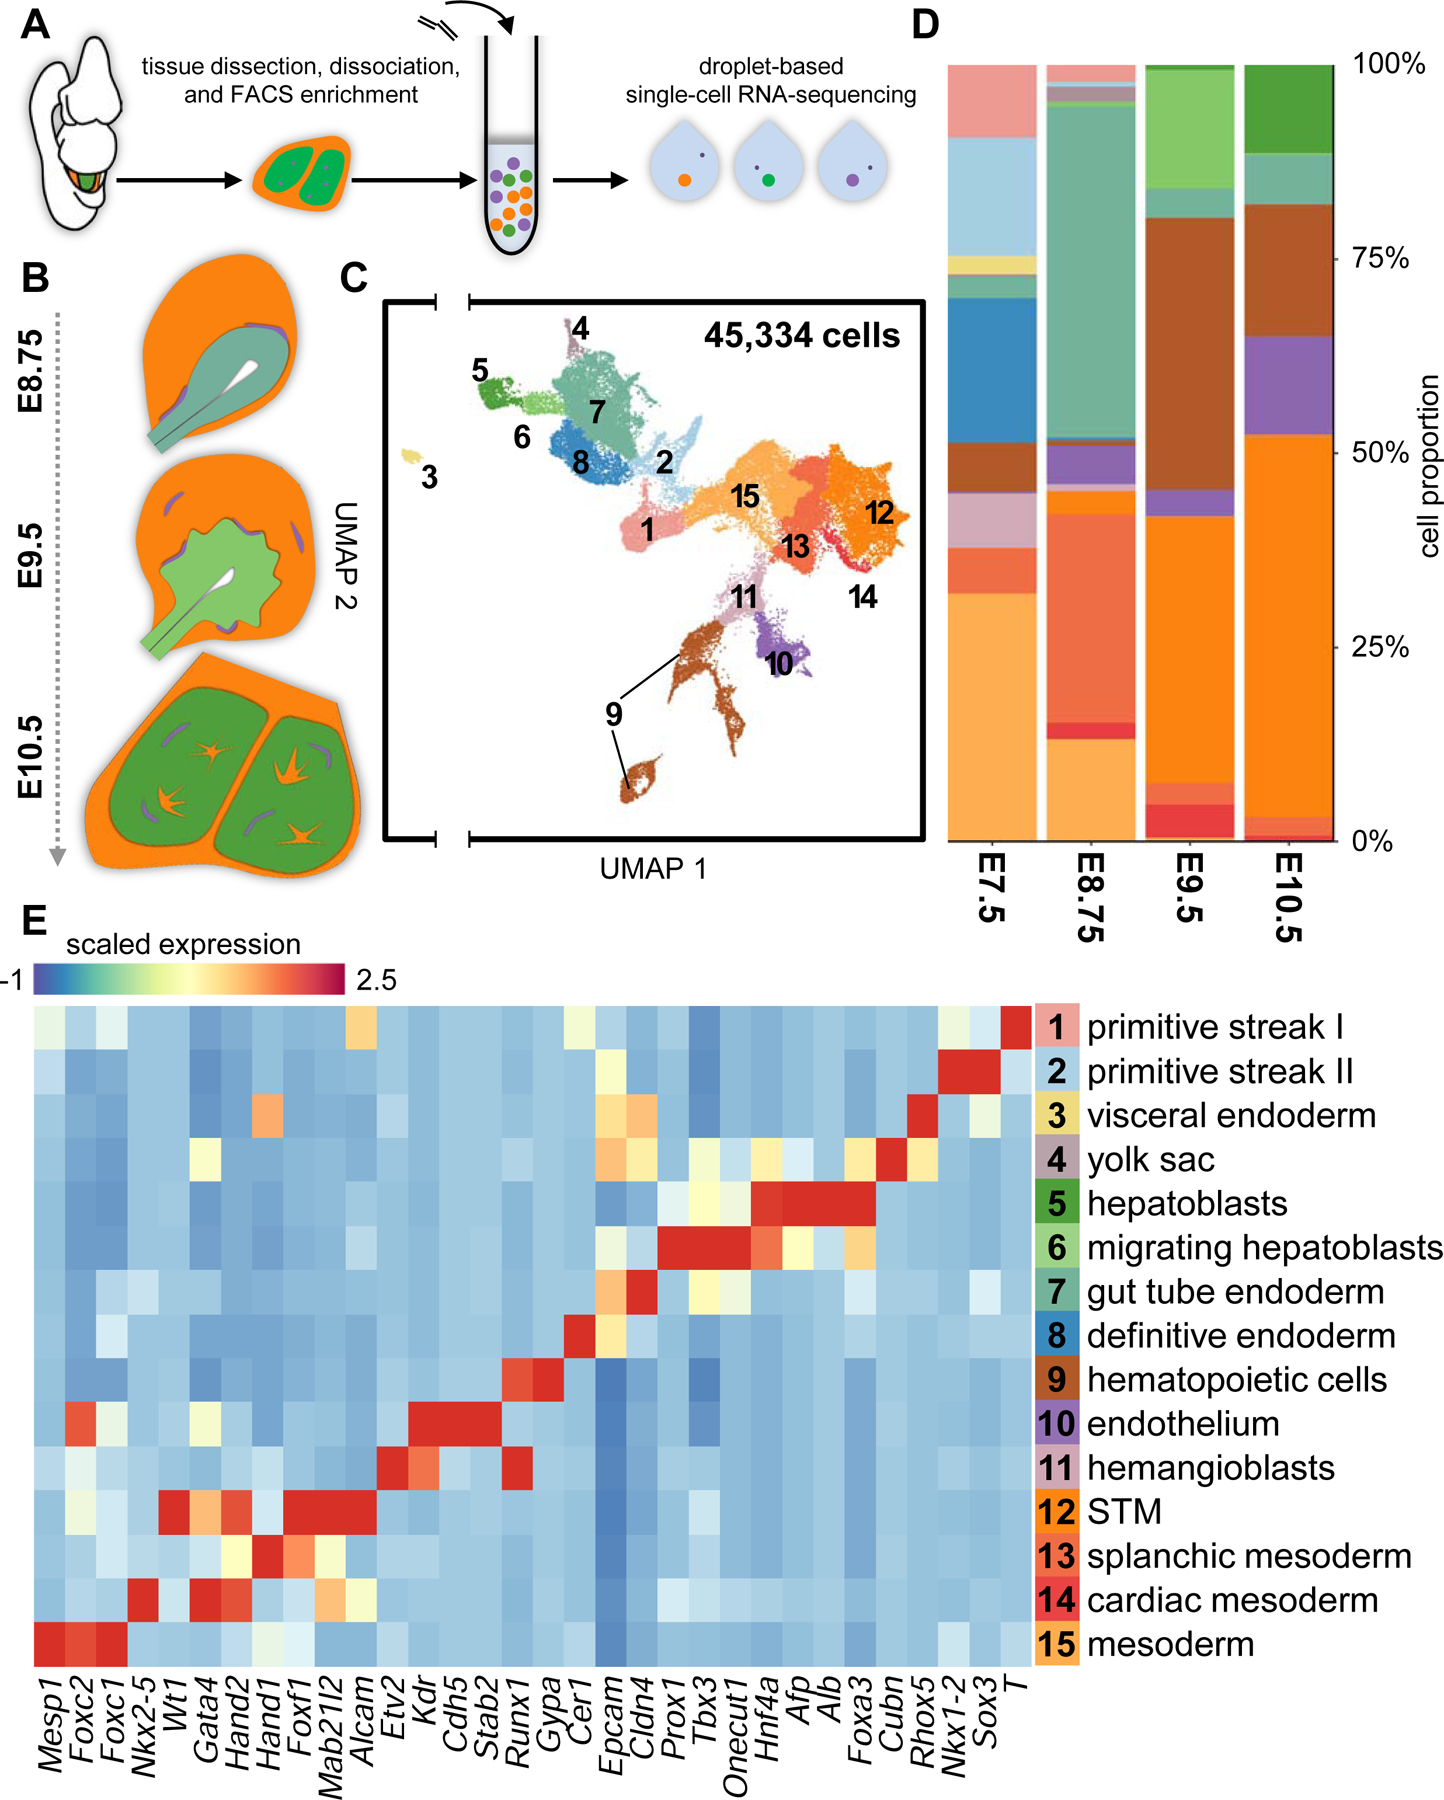
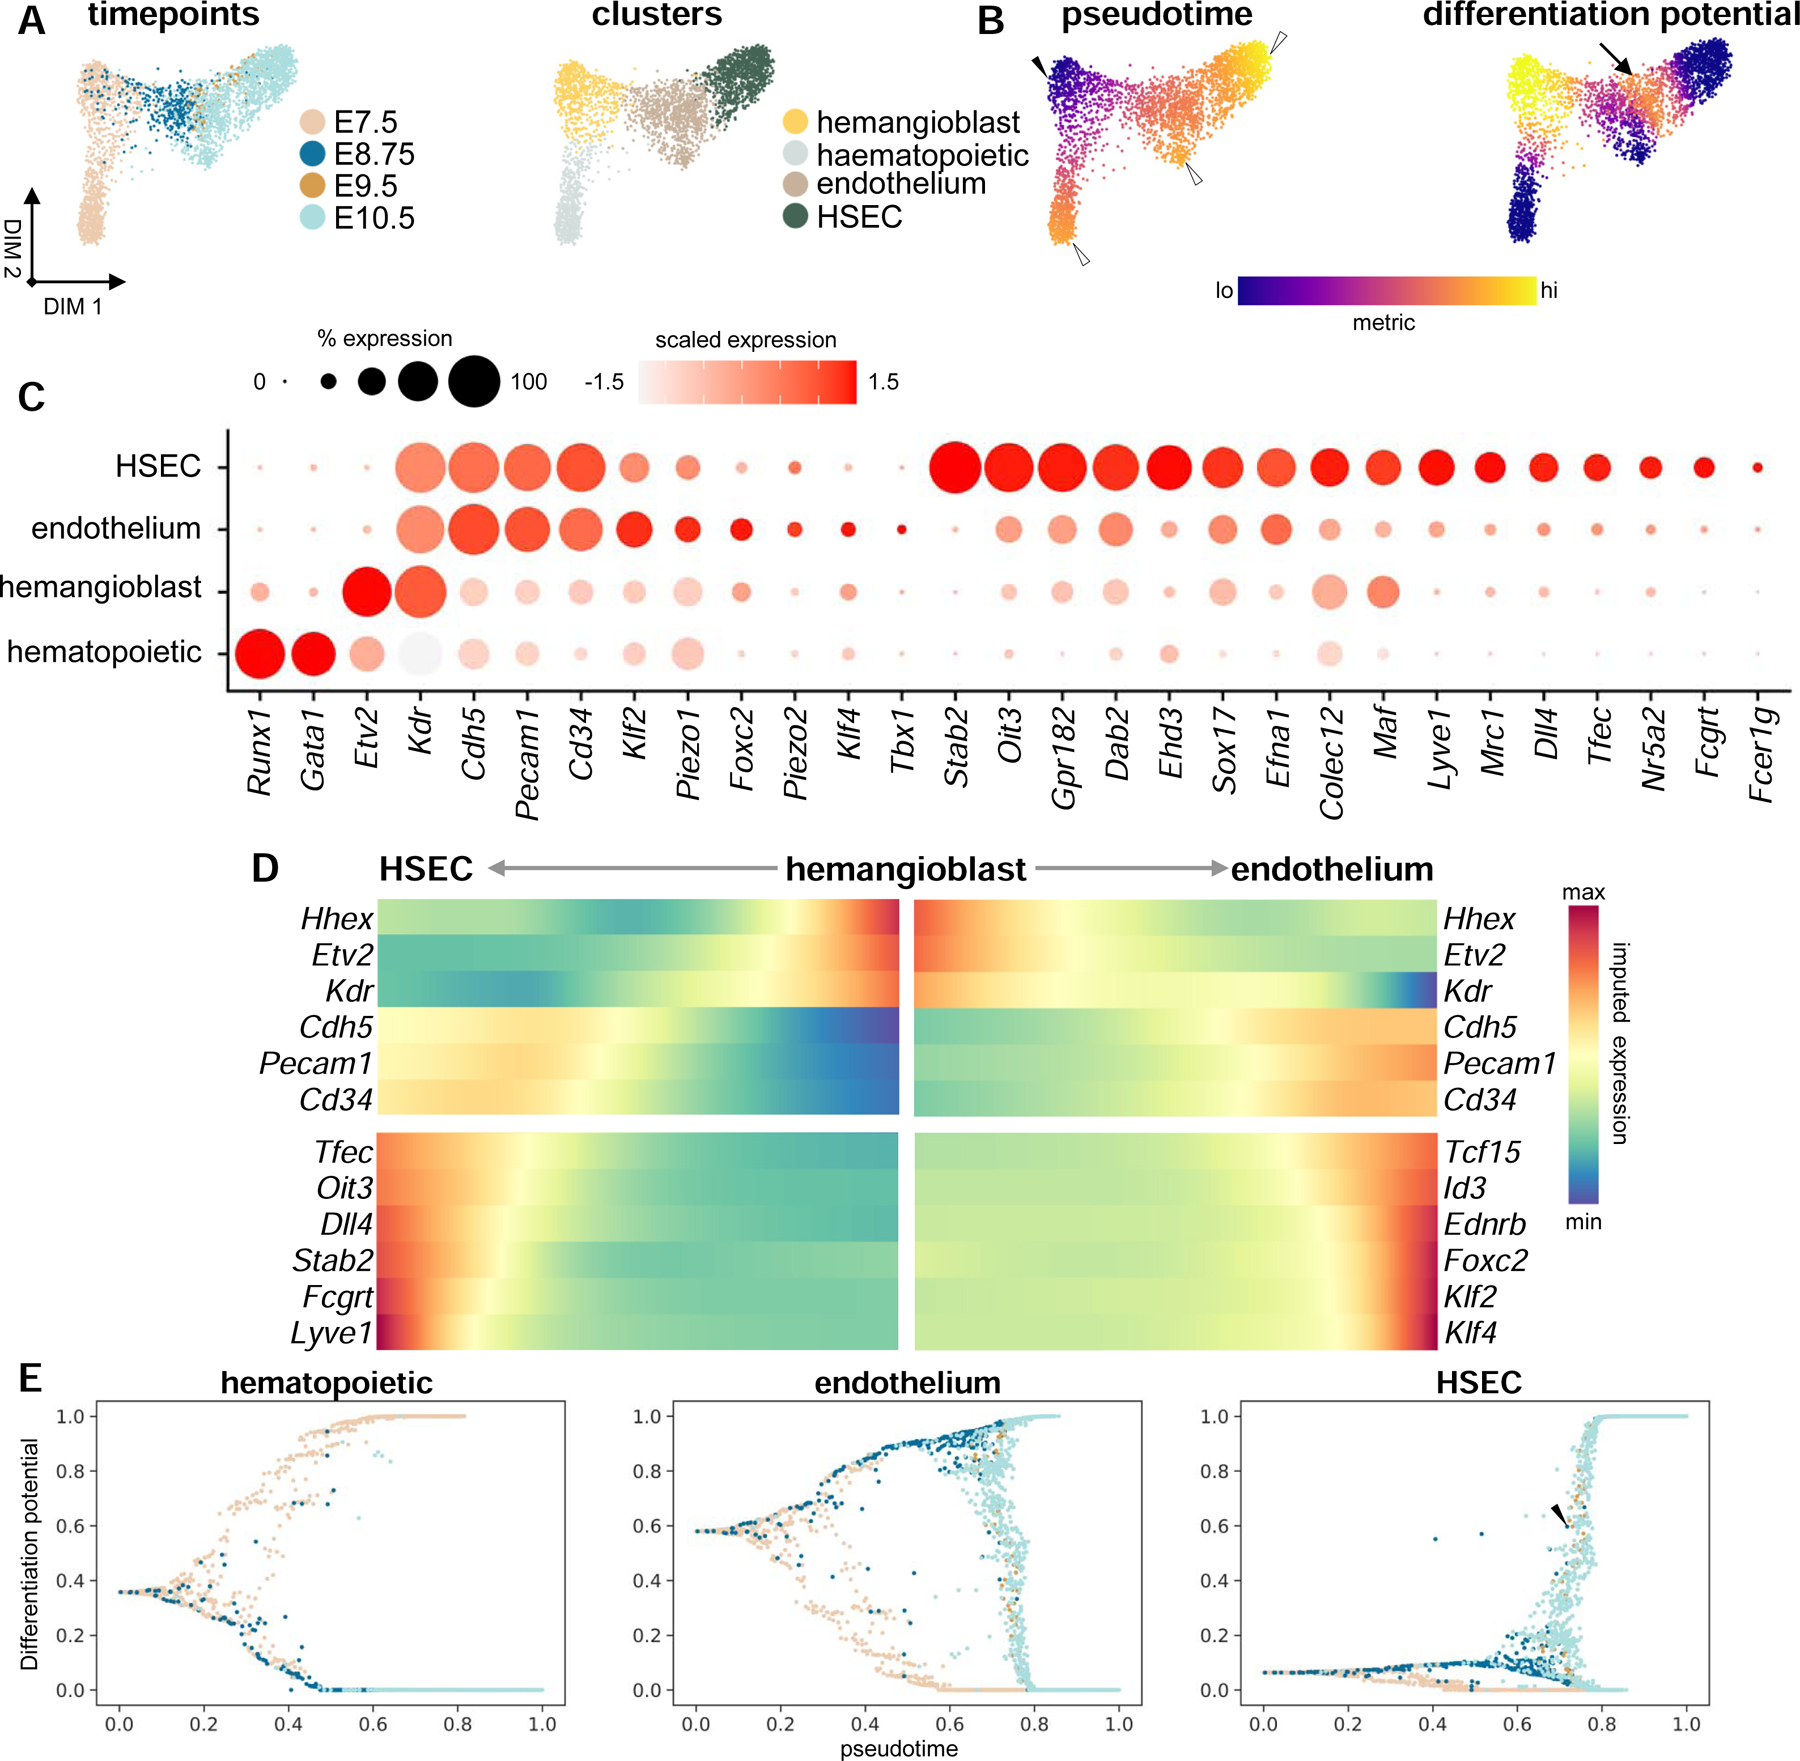
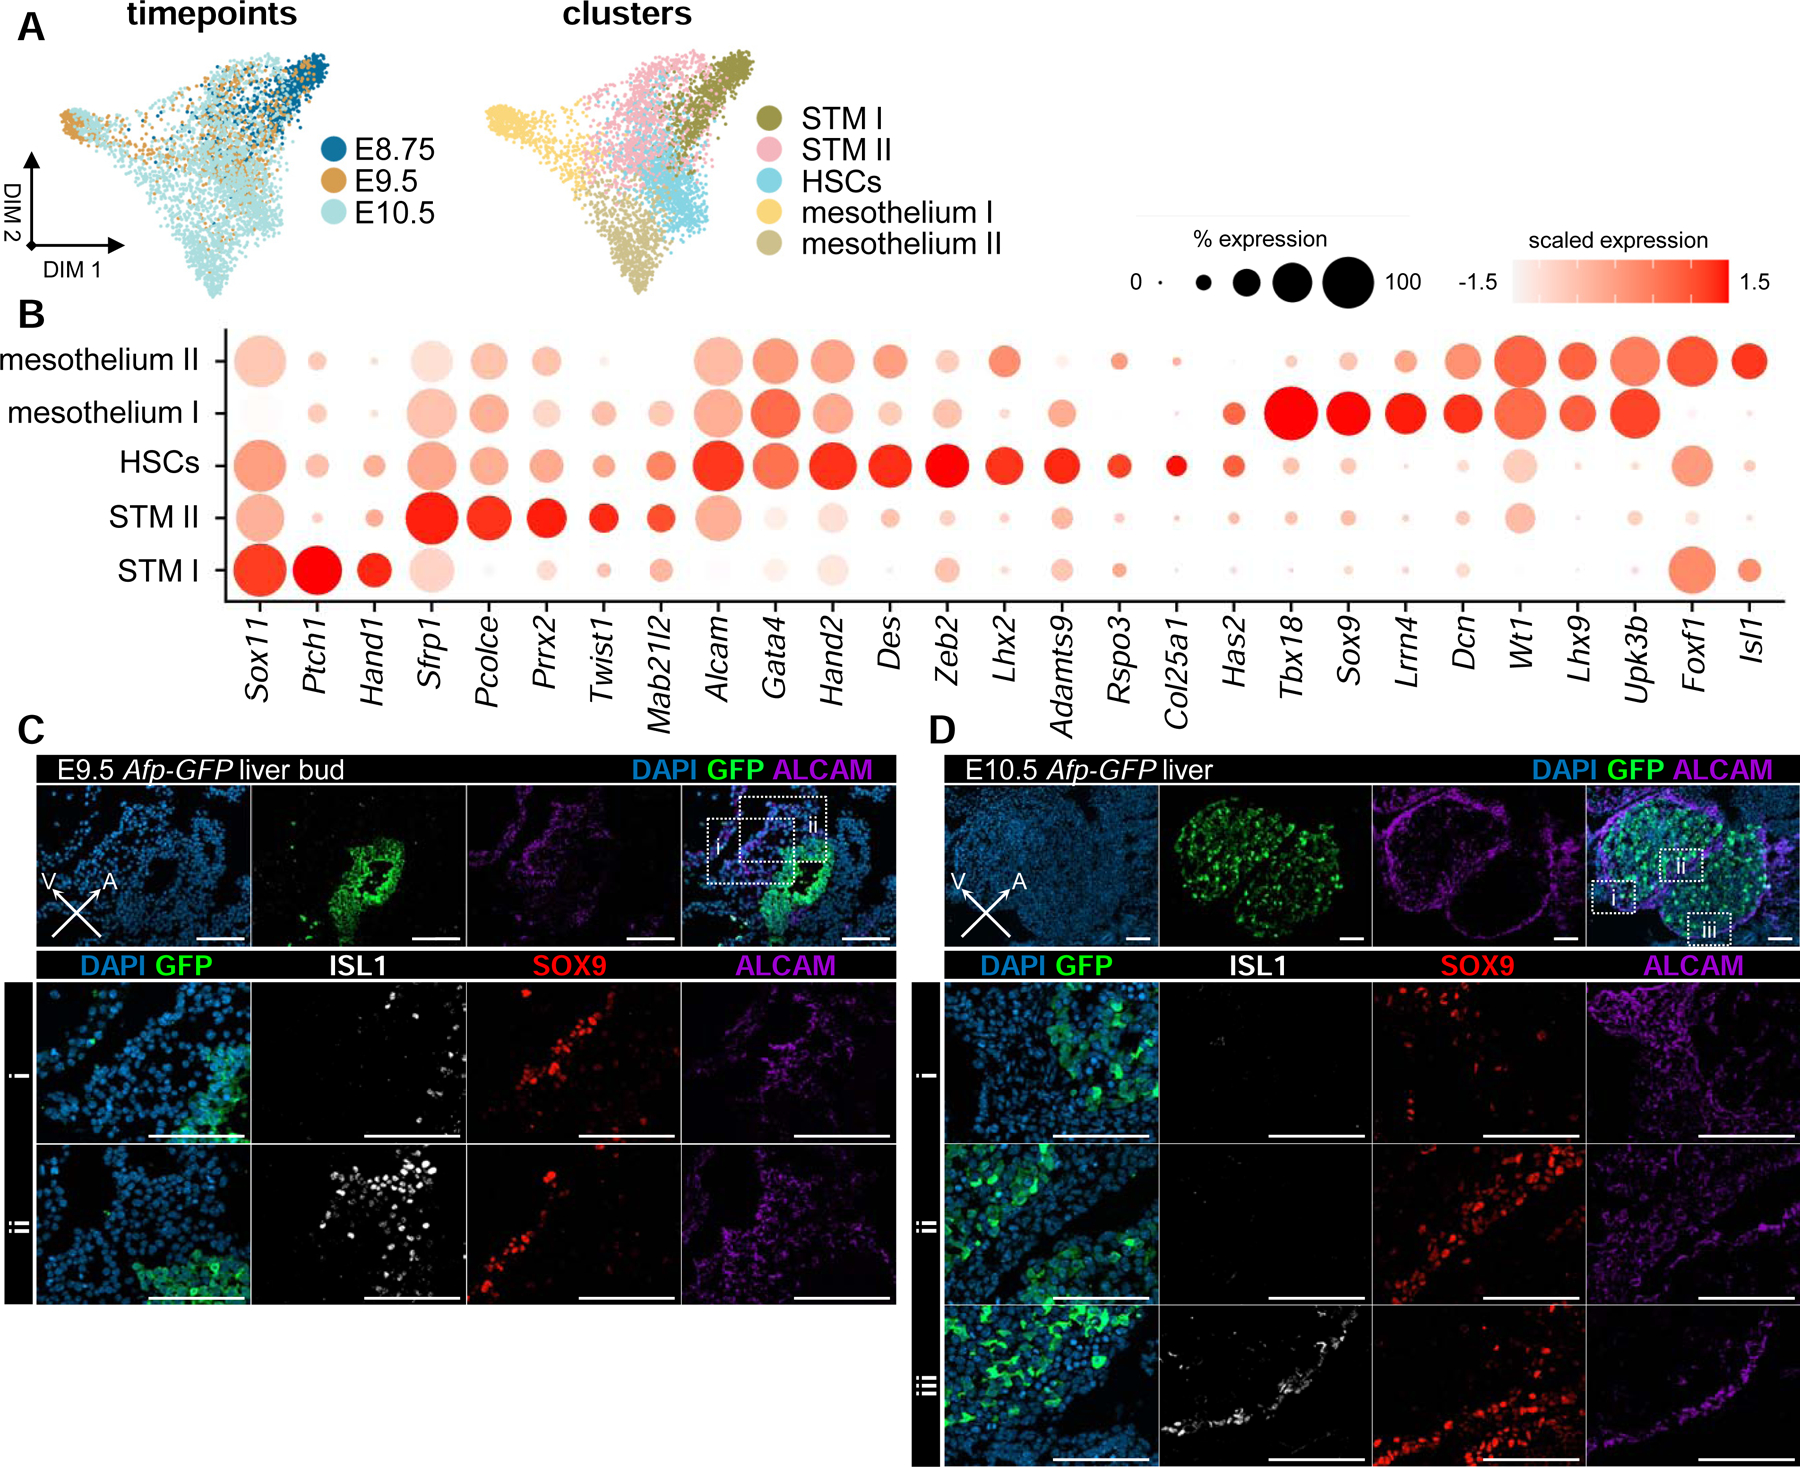
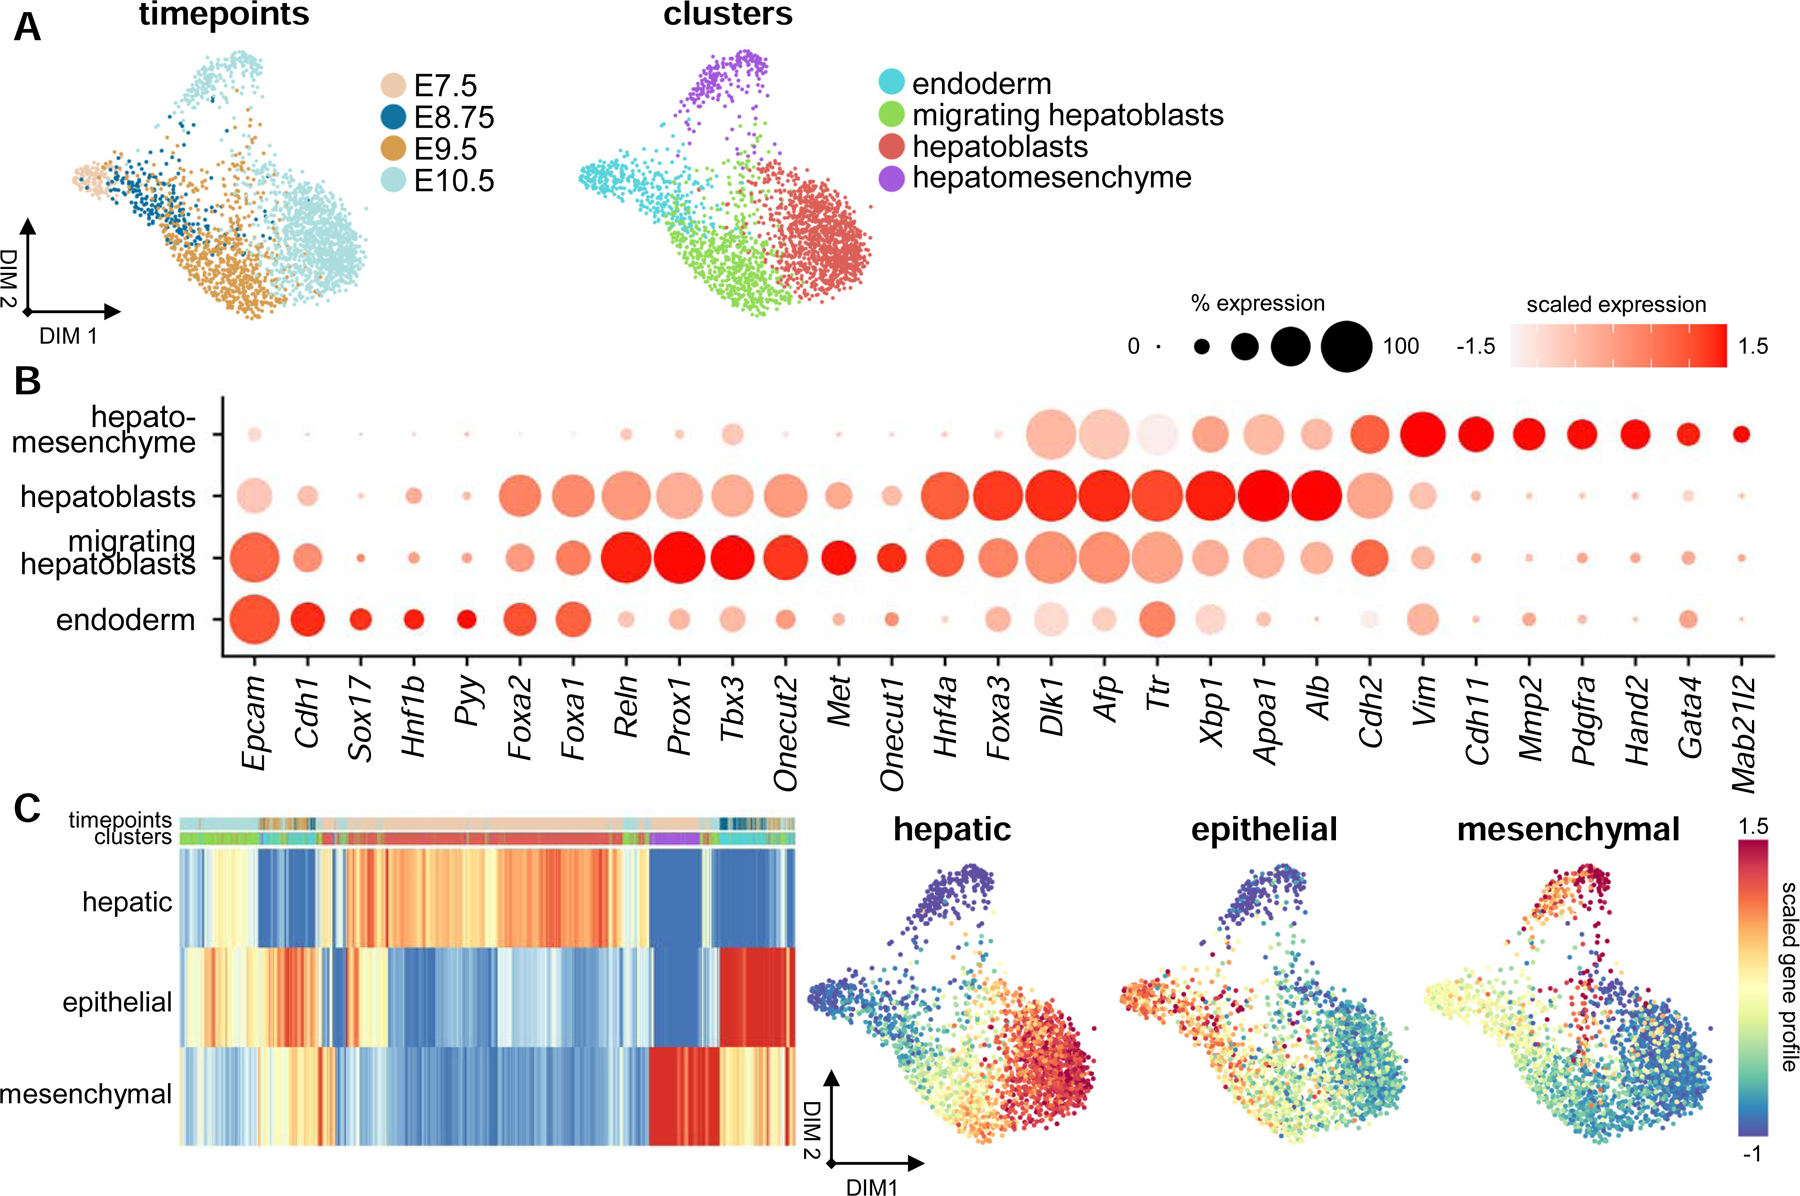
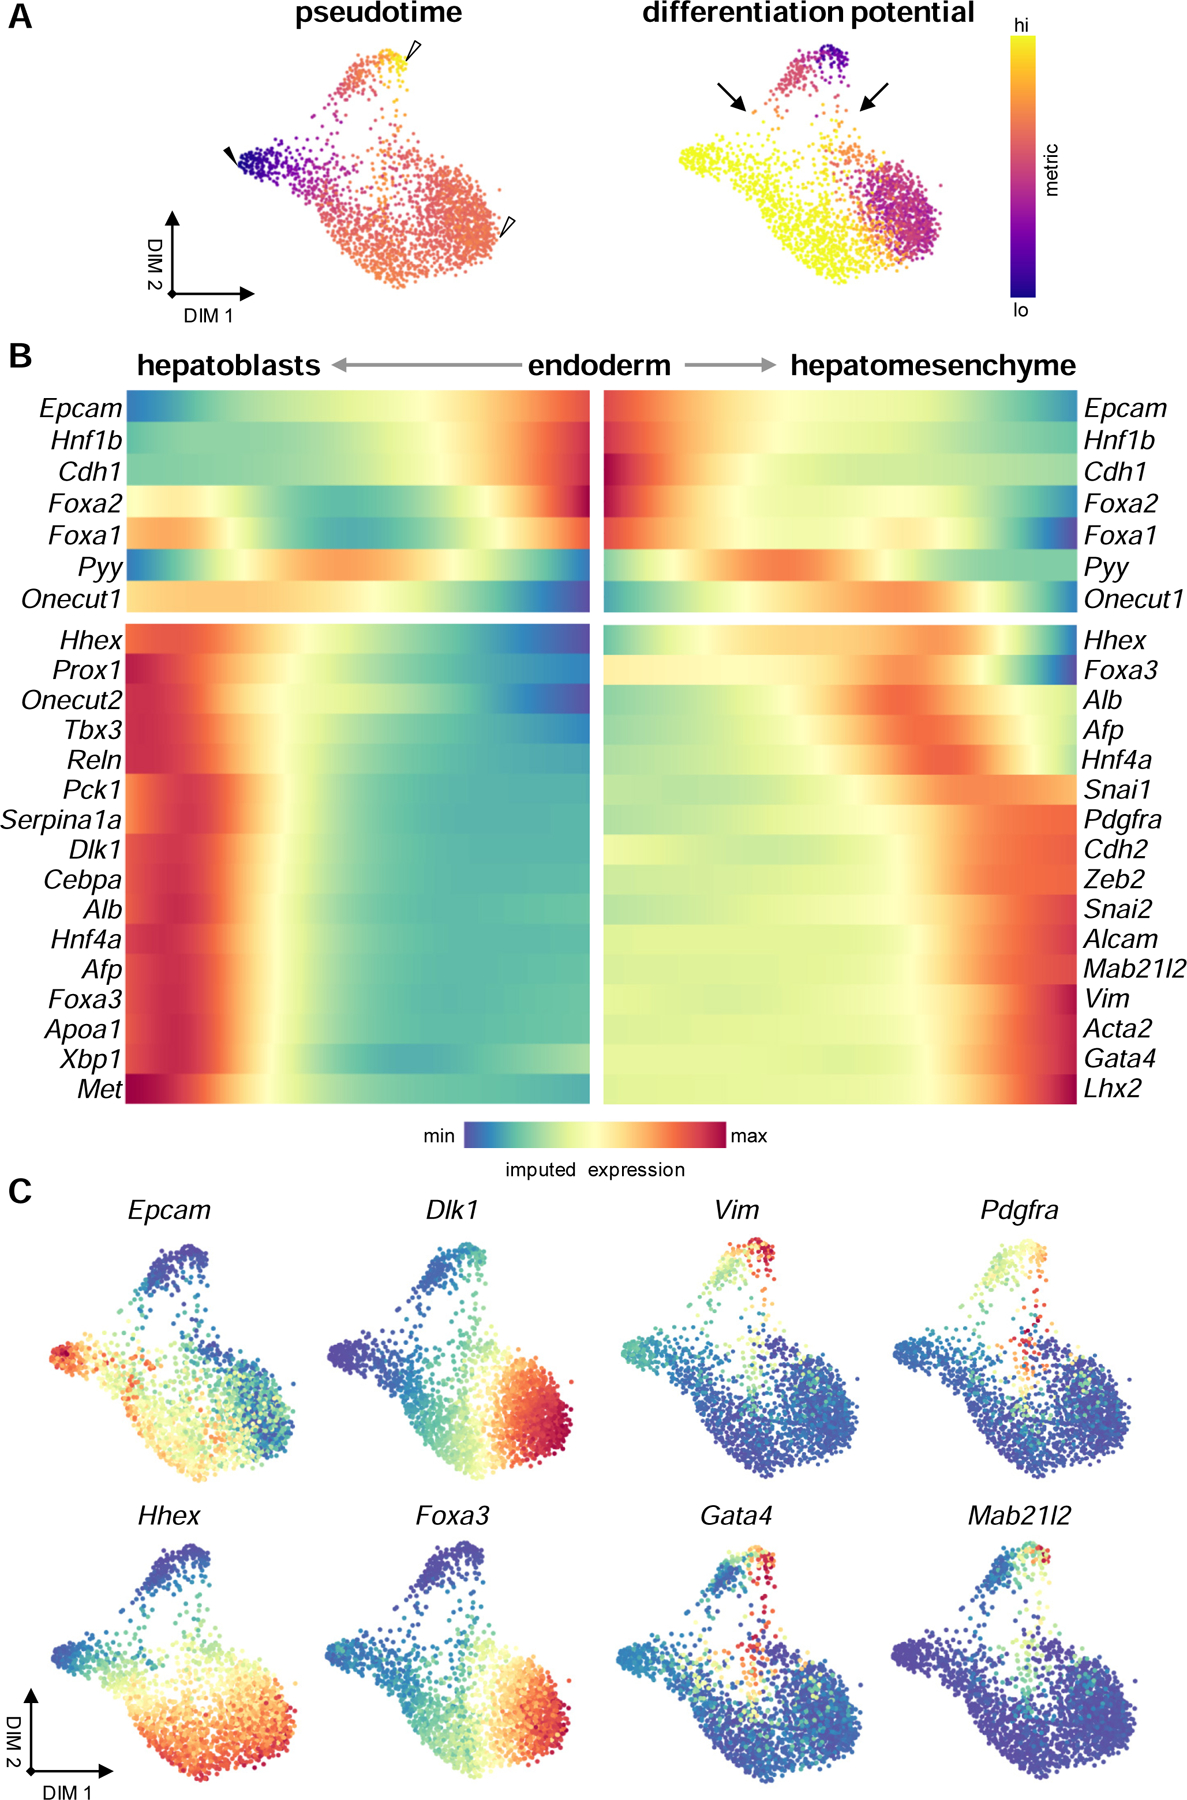
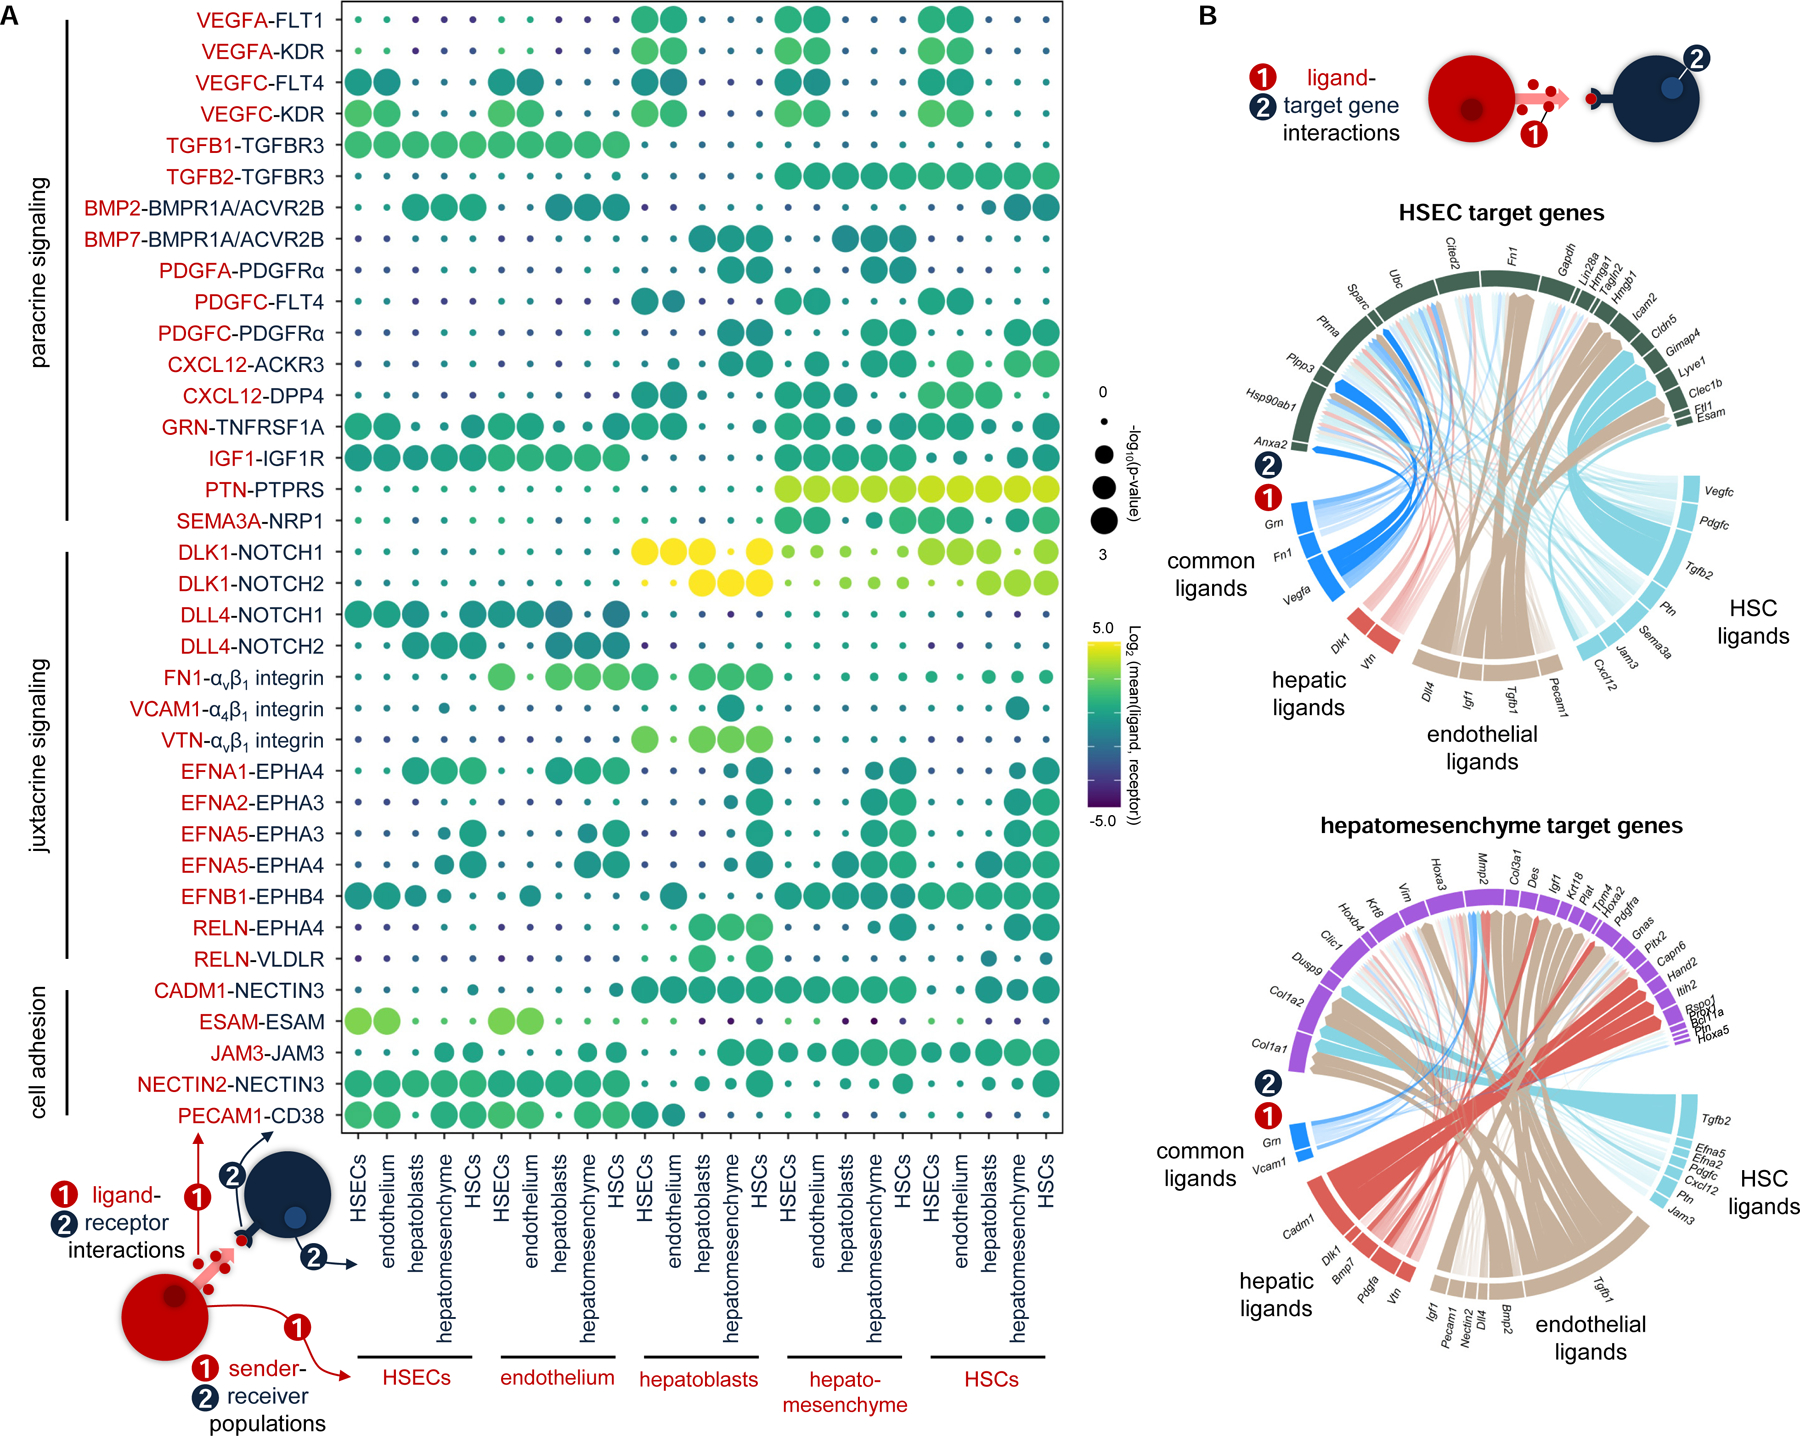
The cellular complexity and scale of the early liver have constrained analyses examining its emergence during organogenesis. To circumvent these issues, we analyzed 45,334 single-cell transcriptomes from embryonic day (E)7.5, when endoderm progenitors are specified, to E10.5 liver, when liver parenchymal and non-parenchymal cell lineages emerge. Our data detail divergence of vascular and sinusoidal endothelia, including a distinct transcriptional profile for sinusoidal endothelial specification by E8.75. We characterize two distinct mesothelial cell types as well as early hepatic stellate cells and reveal distinct spatiotemporal distributions for these populations. We capture transcriptional profiles for hepatoblast specification and migration, including the emergence of a hepatomesenchymal cell type and evidence for hepatoblast collective cell migration. Further, we identify cell-cell interactions during the organization of the primitive sinusoid. This study provides a comprehensive atlas of liver lineage establishment from the endoderm and mesoderm through to the organization of the primitive sinusoid at single-cell resolution.
Keywords: endoderm; hepatoblasts; liver; mesothelium; organogenesis; scRNA-seq; single-cell; sinusoidal endothelium; stellate cells.
Copyright © 2020 Elsevier Inc. All rights reserved.
Conflict of interest statement
Declaration of Interests S.C.B and D.M.C. are current and past employees, respectively, and shareholders at 10x Genomics.
Figures
Similar articles
-
Comparative analysis of cell lineage differentiation during hepatogenesis in humans and mice at the single-cell transcriptome level.Cell Res. 2020 Dec;30(12):1109-1126. doi: 10.1038/s41422-020-0378-6. Epub 2020 Jul 20. Cell Res. 2020. PMID: 32690901 Free PMC article.
-
Spatiotemporal sequence of mesoderm and endoderm lineage segregation during mouse gastrulation.Development. 2021 Jan 7;148(1):dev193789. doi: 10.1242/dev.193789. Development. 2021. PMID: 33199445
-
Crucial roles of mesodermal cell lineages in a murine embryonic stem cell-derived in vitro liver organogenesis system.Stem Cells. 2005 Aug;23(7):903-13. doi: 10.1634/stemcells.2004-0295. Stem Cells. 2005. PMID: 16043458
-
Cooperation of liver cells in health and disease.Adv Anat Embryol Cell Biol. 2001;161:III-XIII, 1-151. doi: 10.1007/978-3-642-56553-3. Adv Anat Embryol Cell Biol. 2001. PMID: 11729749 Review.
-
The contributions of mesoderm-derived cells in liver development.Semin Cell Dev Biol. 2019 Aug;92:63-76. doi: 10.1016/j.semcdb.2018.09.003. Epub 2018 Sep 10. Semin Cell Dev Biol. 2019. PMID: 30193996 Review.
Cited by
-
ScRNA-seq and ST-seq in liver research.Cell Regen. 2023 Feb 3;12(1):11. doi: 10.1186/s13619-022-00152-5. Cell Regen. 2023. PMID: 36732412 Free PMC article. Review.
-
Fetal liver development and implications for liver disease pathogenesis.Nat Rev Gastroenterol Hepatol. 2023 Sep;20(9):561-581. doi: 10.1038/s41575-023-00775-2. Epub 2023 May 19. Nat Rev Gastroenterol Hepatol. 2023. PMID: 37208503 Review.
-
Single-cell sequencing reveals the existence of fetal vascular endothelial stem cell-like cells in mouse liver.Stem Cell Res Ther. 2023 Aug 30;14(1):227. doi: 10.1186/s13287-023-03460-y. Stem Cell Res Ther. 2023. PMID: 37649114 Free PMC article.
-
Single cell Raman spectroscopy to identify different stages of proliferating human hepatocytes for cell therapy.Stem Cell Res Ther. 2021 Oct 30;12(1):555. doi: 10.1186/s13287-021-02619-9. Stem Cell Res Ther. 2021. PMID: 34717753 Free PMC article.
-
Divergent WNT signaling and drug sensitivity profiles within hepatoblastoma tumors and organoids.Nat Commun. 2024 Nov 20;15(1):8576. doi: 10.1038/s41467-024-52757-w. Nat Commun. 2024. PMID: 39567475 Free PMC article.
References
-
- Andersen OM, Benhayon D, Curran T, and Willnow TE (2003). Differential binding of ligands to the apolipoprotein E receptor 2. Biochemistry 42, 9355–9364. - PubMed
Publication types
MeSH terms
Grants and funding
LinkOut - more resources
Full Text Sources
Other Literature Sources
Molecular Biology Databases
