. 2020 Oct 29;183(3):752-770.e22.
doi: 10.1016/j.cell.2020.09.062.

M. tuberculosis Reprograms Hematopoietic Stem Cells to Limit Myelopoiesis and Impair Trained Immunity

Affiliations

M. tuberculosis Reprograms Hematopoietic Stem Cells to Limit Myelopoiesis and Impair Trained Immunity

Nargis Khan et al. Cell. .

Abstract

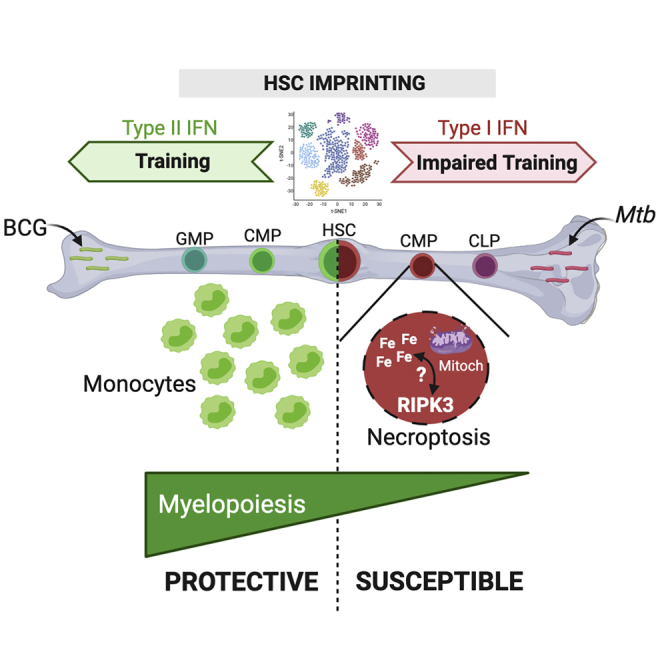
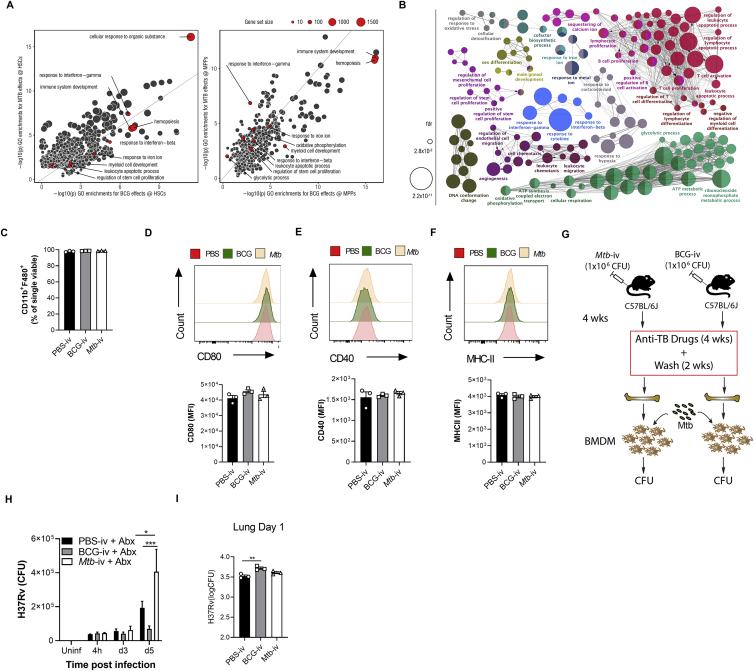
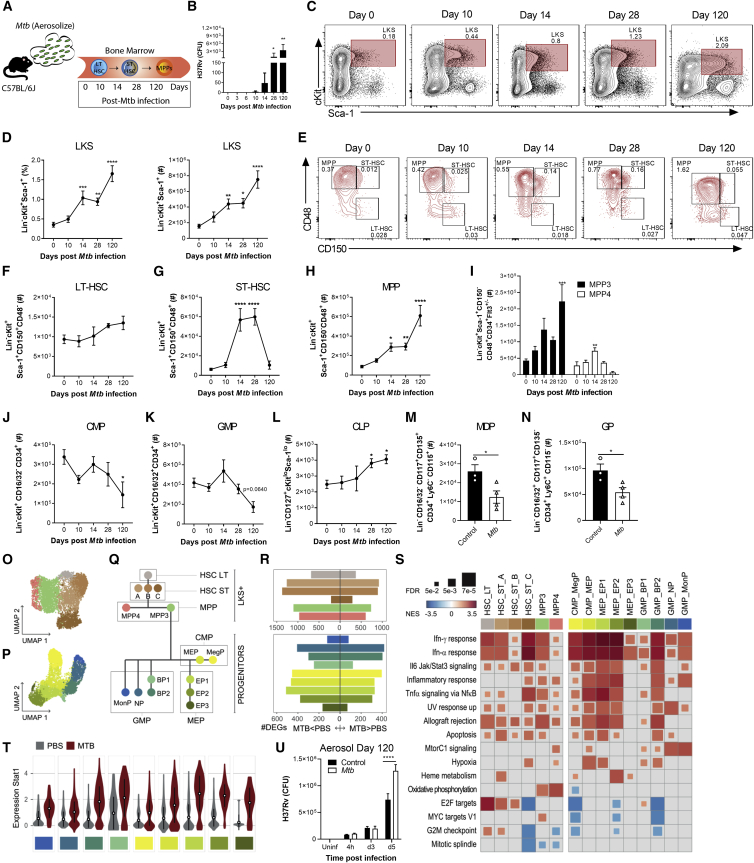
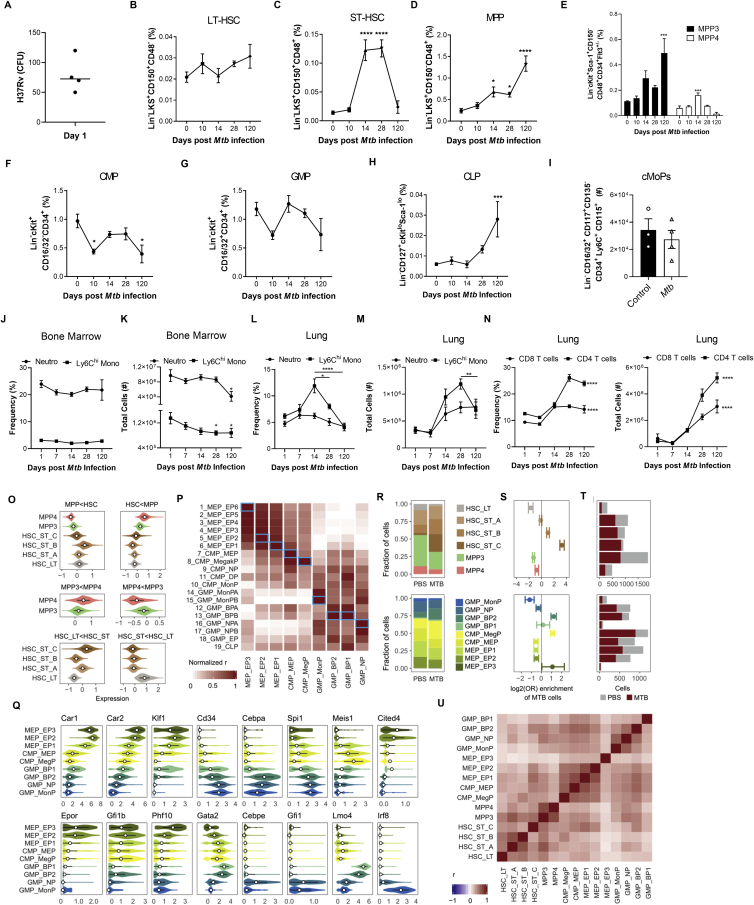
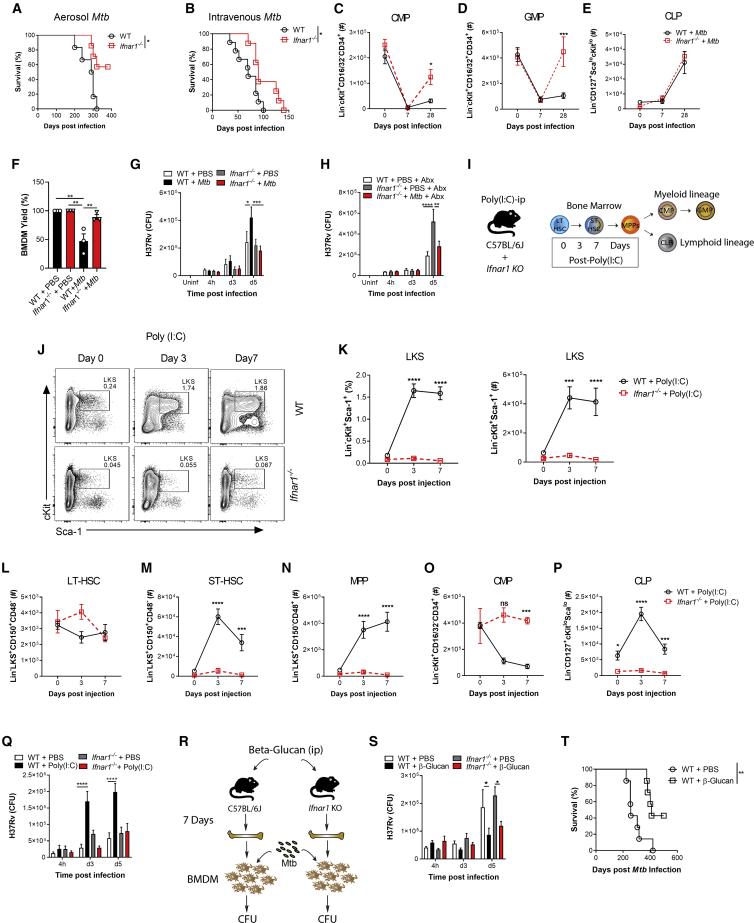
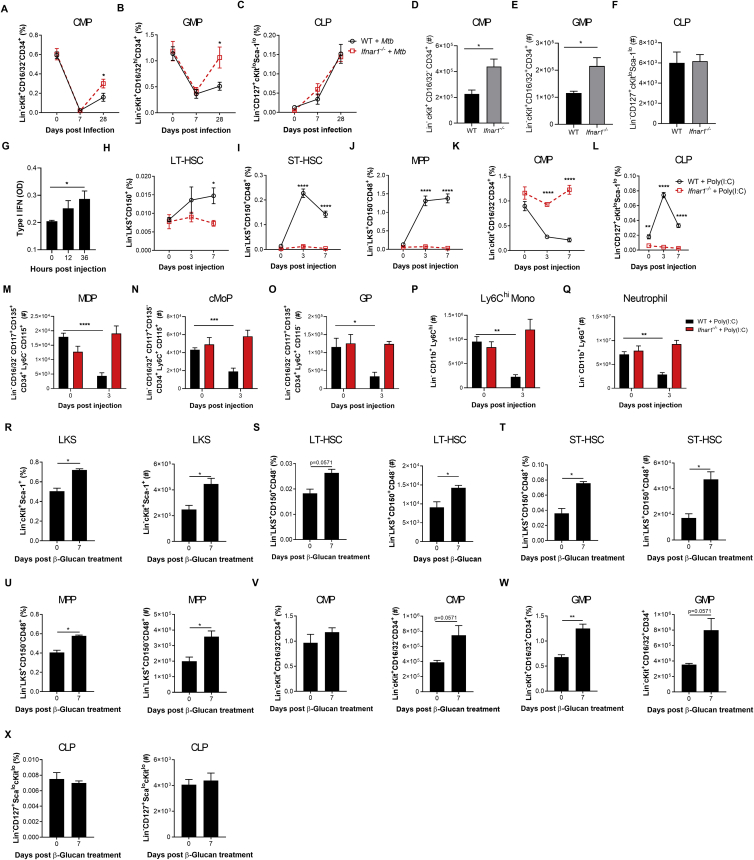
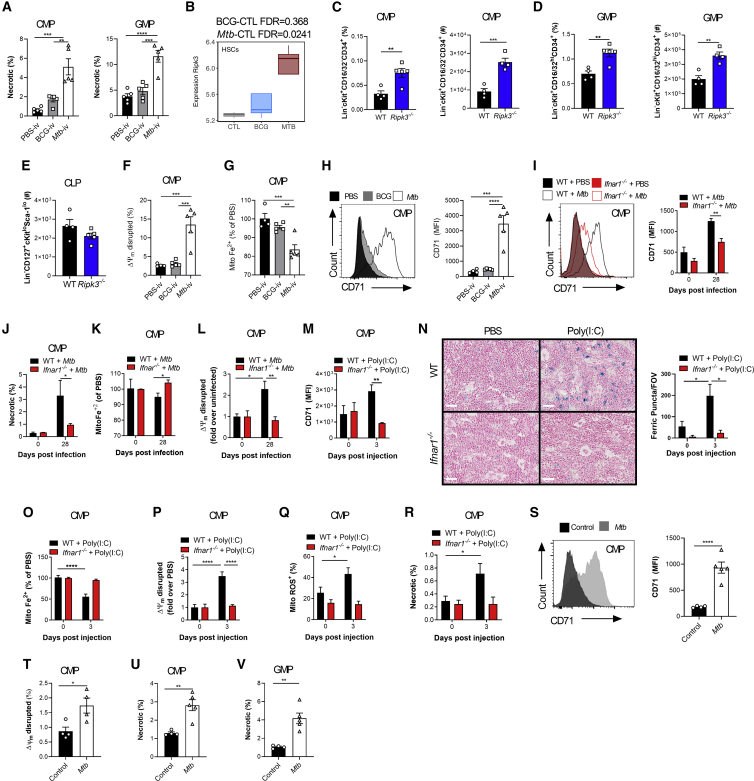
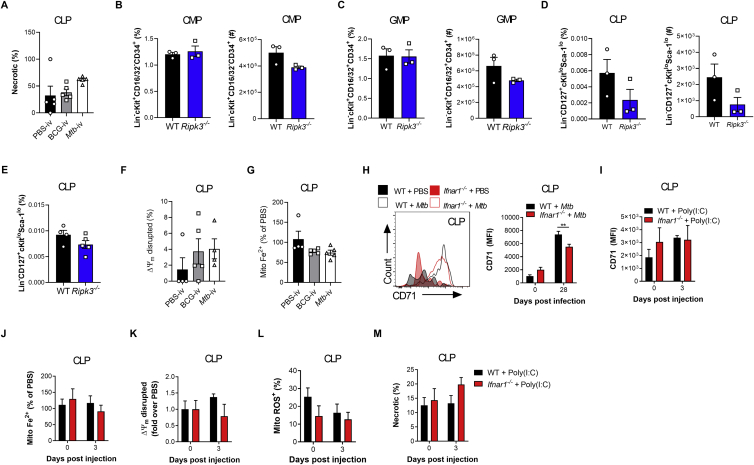
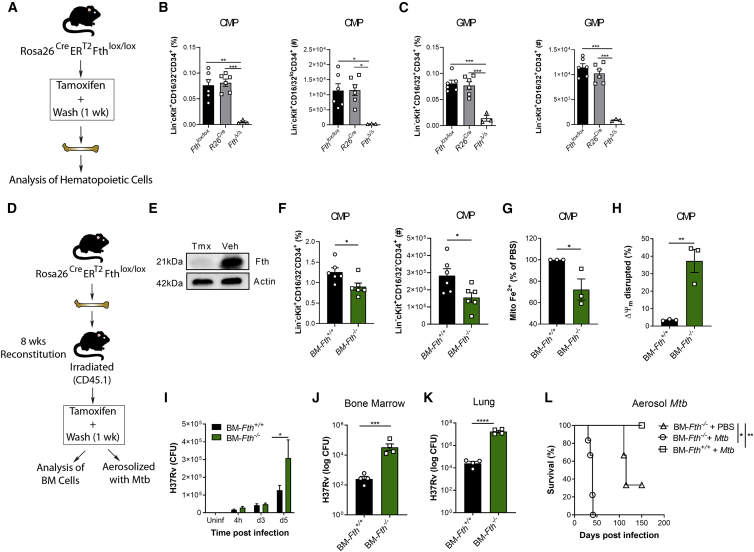
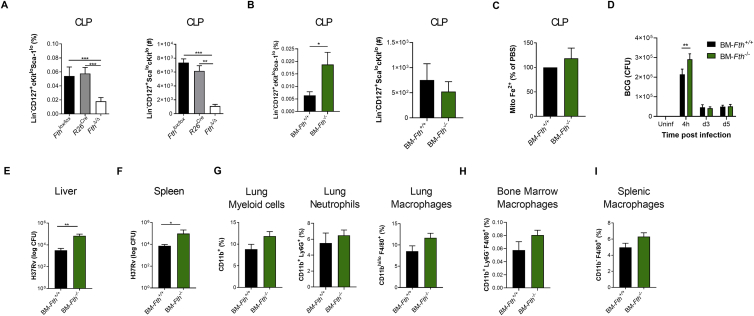
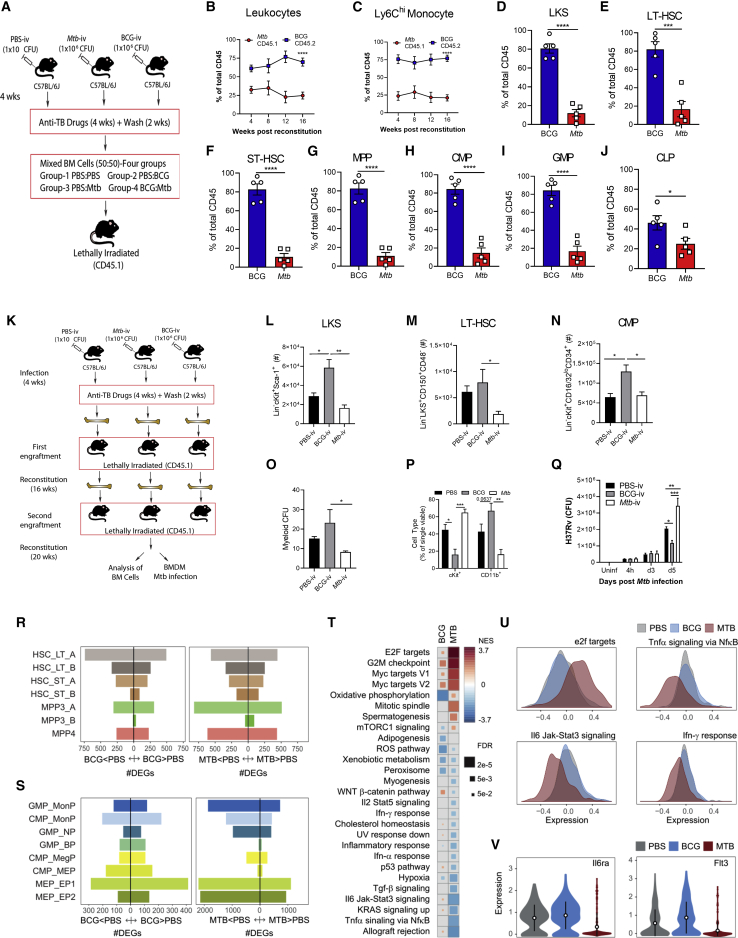
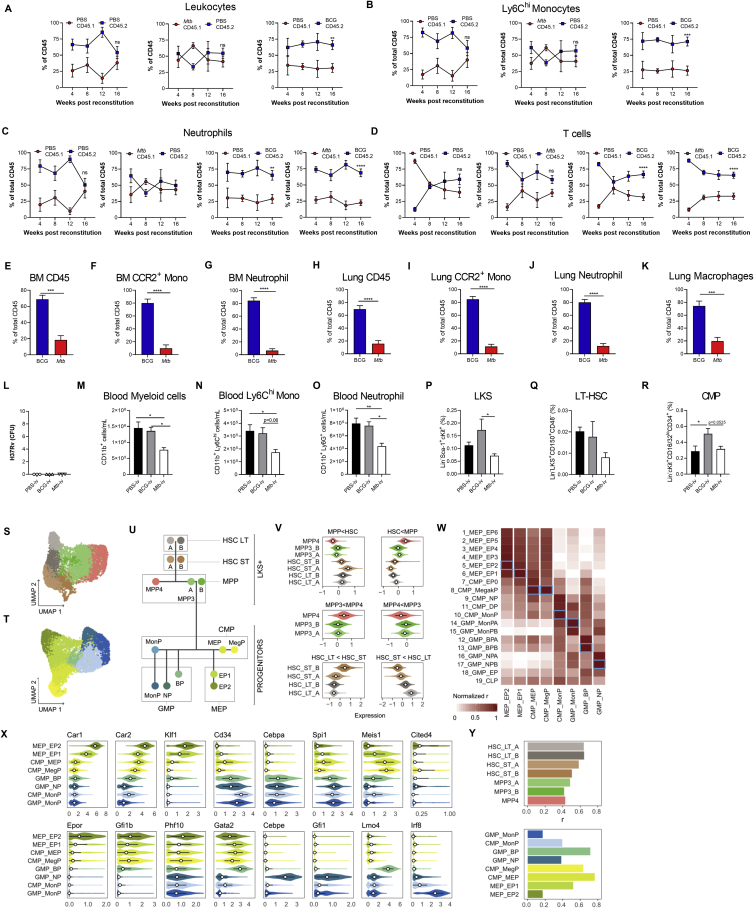
A greater understanding of hematopoietic stem cell (HSC) regulation is required for dissecting protective versus detrimental immunity to pathogens that cause chronic infections such as Mycobacterium tuberculosis (Mtb). We have shown that systemic administration of Bacille Calmette-Guérin (BCG) or β-glucan reprograms HSCs in the bone marrow (BM) via a type II interferon (IFN-II) or interleukin-1 (IL1) response, respectively, which confers protective trained immunity against Mtb. Here, we demonstrate that, unlike BCG or β-glucan, Mtb reprograms HSCs via an IFN-I response that suppresses myelopoiesis and impairs development of protective trained immunity to Mtb. Mechanistically, IFN-I signaling dysregulates iron metabolism, depolarizes mitochondrial membrane potential, and induces cell death specifically in myeloid progenitors. Additionally, activation of the IFN-I/iron axis in HSCs impairs trained immunity to Mtb infection. These results identify an unanticipated immune evasion strategy of Mtb in the BM that controls the magnitude and intrinsic anti-microbial capacity of innate immunity to infection.

Keywords: BCG; Mycobacterium tuberculosis; hematopoietic stem cells; iron metabolism; macrophages; monocytes; myelopoiesis; necroptosis; trained immunity; type I IFN.


Conflict of interest statement

Declaration of Interests The authors declare no competing interests.

Figures

None
Graphical abstract
Figure 1
Figure 1
Mtb-i.v. Induces HSC Expansion and Suppresses Myelopoiesis (A) The i.v. model. (B, C, and H–R) WT mice were challenged i.v. with Mtb, Mtb-ΔRD1, or BCG. (B) Survival (n = 6–8 mice/group). (C) BM CFUs (n = 4–10 mice/group). (D–G) In vitro infection of BM cells with H37Rv- or BCG-GFP (4 h, MOI 3). Shown are ImageStream (D) and flow cytometry (F) analysis of infected cells, as a percentage of parental cells in (E) and (G). (H) Fluorescence-activated cell sorting (FACS) plots and quantification of LKS cells (n = 4–8 mice/group). (I) Percentage of Ki67+ LKS cells on day 7. (J–L) Frequencies (top) and totals (bottom) of CMPs (J), GMPs (K), and CLPs (L) (n = 4–13 mice/group). (M–R) Total BM LKS cells (M); LT-HSCs, ST-HSCs, MPPs, CMPs, GMPs, and CLPs (N); MDPs (O); cMoPs (P); GPs (Q); and Ly6Chi monocytes (R) on day 28. Log-rank test (B), two-way ANOVA followed by Sidak’s multiple comparisons test (C, H, and J–L), one-way ANOVA followed by Tukey’s multiple comparisons test (I and M), and two-tailed Student’s t test (N–R) were used. Data are representative of two (C, I, and O–R) or three (H and J–N) independent experiments. See also Figure S1.
Figure S1
Figure S1
Gating Strategy for HSCs and Progenitors and Their Kinetics Post-infection, Related to Figure 1 (A) Cells were gated for FSC-A against SSC-A. Doublets were excluded using FSC-H against FSC-A. Viable cells were gated and lineage-committed cells were excluded. Within the lineage-negative population, cells were gated as LKS-defined as double positive for cKit and Sca-1. Gated on the LKS population, cells were divided into LT-HSC, ST-HSC and MPP based on CD150 and CD48 expression. MPPs were characterized as MPP3 or MPP4 by their surface expression of CD34 and Flt3. In a second strategy, lineage negative cells were gated based on CD127+ and CD127-. Lin- CD127- population was further defined by Sca-1 and c-Kit. c-Kit+ Sca-1- cells were further gated based on CD34 and CD16/32 to define CMP, GMP and MEP. Lineage- and CD127+ cells are defined as CLPs based on Sca-1lo and c-Kitlo expression. Finally, in another set of experiments, Lineage+ cells and then Sca-1+ cells were excluded. The remaining cells were further subdivided into cKit+ CD16/32+ and cKit+ CD16/32- groups. In the cKit+ CD16/32- group, CD34+ Flt3+ cells were denoted as MDP by being CD115+ but Ly6C-. cKit+CD16/32+ cells were further gated on CD34+ Flt3- cells. Within this fraction, Ly6C+ CD115- cells were the GP and Ly6C+ CD115+ were cMoP. (B-D) Kinetics of the frequency among single viable BM cells (top panel) and total cell counts (bottom panel) of LT-HSC, ST-HSC, MPP3/MPP4 in the BM of BCG-iv vaccinated or Mtb-iv infected mice. (E) BM cells from WT mice were infected with BCG-GFP or H37Rv-GFP for 4 hours in vitro (MOI 3). ImageStream analysis of H37Rv-GFP infection (top panel) and BCG-GFP (bottom panel) in Lin- cKit+ Sca-1- progenitors. (F-H) Mice were intravenously infected with 1x10⁶ CFU of BCG, Mtb or Mtb-ΔRD-1 for 28 days. Frequency of LKS in each group (F) and HSC/progenitor subsets of BCG versus Mtb-ΔRD-1 (G), or Mtb versus Mtb-ΔRD-1 (H; left panel frequency, right panel total cell counts). (I-O) 1x10⁶ CFU of BCG or Mtb were delivered intravenously for 28 days. Percentage of MDP (I), cMoP (J), GP (K) and Ly6Chi monocytes (L) and frequency and total numbers of neutrophils (M) in the BM. (N-O) Frequency and total LKS cells (N), as well as the frequency and total cell number of the HSC/progenitor fractions in BCG versus Mtb-infected mice in the spleen after 28 days (O). Differences assessed by Two-tailed Student’s T-Test for each individual cell population in B-D and G-O or One-way ANOVA followed by Tukey’s Multiple Comparisons Test in F.
Figure 2
Figure 2
Mtb-i.v. Imprints a Unique Transcriptional Signature in HSCs and Detrimentally Trains BMDMs (A) Principal-component analysis (PCA) of gene expression of HSCs and MPPs from the BM of PBS, BCG-i.v., and Mtb-i.v. mice after 28 days. (B) Number of genes differentially up- or downregulated in HSCs and MPPs (FDR < 0.01). (C) Scatterplots of genome-wide effect sizes in HSCs (top) and MPPs (bottom). (D) GSEA of DEGs (FDR < 0.1). (E) BMDM model. (F) Relative BMDM yield. (G) CFUs from in vitro Mtb-infected BMDMs (n = 7–10 mice/group). (H) Adoptive transfer model. (I) Lung CFUs post-transfer. In (F) and (I), one-way ANOVA followed by Tukey’s multiple comparisons test was used. In (G), two-way ANOVA followed by Sidak’s multiple comparisons test was used. In (E)–(I), data are pooled from 2–3 independent experiment. See also Figure S2.
Figure S2
Figure S2
HSC Imprinting by BCG and Mtb-i.v. and Subsequent Anti-mycobacterial Responses by Macrophages to Mtb Infection In Vitro, Related to Figure 2 (A) Scatterplot for significance levels (-log10(p value) of gene ontology enrichment analyses conducted among DE genes upon BCG versus Mtb infections in HSC (left) and MPP (right). (B) Gene ontology terms enriched among DEG in response to Mtb in MPP (at FDR < 0.01). (C-F) BMDM from PBS control, BCG-iv and Mtb-iv groups were generated. Purity of BMDM cultures as determined by flow cytometry using expression of BMDM markers CD11b and F4/80 (C). Activation of mature BMDM was assessed by flow cytometry via MFIs of CD80 (D), CD40 (E) and MHC-II (F) with representative histograms in the top panels. Model of in vivo antibiotic treatment (G). BMDM-derived from the BM cells of these mice were infected with Mtb (H37Rv; MOI 1) and the number of CFU was determined at different time points after infection (H). (I) BMDM CFU prior to intratracheal transfer, as detailed in Figures 2H and 2I. Differences determined by One-way ANOVA followed by Tukey’s Multiple Comparisons Test in C-F and I; Two-way ANOVA followed by Tukey’s Multiple Comparisons Test in H.
Figure 3
Figure 3
Aerosolized Mtb Disseminates to the BM and Expands LKS Cells (A) Aerosol model used in (B)–(U). (B) BM CFUs. (C and D) Representative FACS plots of LKS cells as quantified in (D) as frequency (left) and total number (right). (E–I) Representative FACS plots (E) of LT-HSCs (F), ST-HSCs (G), MPPs (H), and MPP3/4 (I) (n = 4–10 mice/group). (J–N) Total CMPs (J), GMPs (K), and CLPs (L) (n = 4–8 mice/group) and MDPs (M) and GPs (N) on day 120. (O and P) UMAP dimensionality reduction plots for LKS+ (O) and cKit+ (P) cells. (Q) Hematopoietic tree with approximate position of the different clusters identified (color code in common with O and P). (R) Number of genes up- and downregulated in each cluster (abs(logFC) > 0.1 and FDR < 0.05). (S) GSEA of genes ranked according to Mtb effects in each cluster. (T) Stat1 expression across clusters. (U) BMDMs from mice infected with Mtb for 120 days were infected in vitro and CFU quantified (n = 3 mice/group). One-way ANOVA followed by Tukey’s multiple comparisons test (B, D, and F–L), two-tailed Student’s t test (M and N), and two-way ANOVA followed by Sidak’s multiple comparisons test (U) were used. Data are representative of two (B and J–N) or three (C–I) independent experiments. See also Figure S3.
Figure S3
Figure S3
HSC and Progenitor Kinetics following Aerosolized Mtb Infection, Related to Figure 3 (A-M) WT mice were infected with aerosolized Mtb. (A) Day 1 lung CFU following aerosol infection. (B-H) Kinetics of the frequencies among BM cells of LT-HSC (B), ST-HSC (C), MPP (D), MPP3/MPP4 (E), CMP (F), GMP (G), CLP (H) in Mtb infected WT mice. (I) Total cell counts of cMoPs in the BM of WT mice at 120 days post-infection. Kinetics of the frequencies and total numbers of neutrophils and Ly6Chi monocytes in the BM (J-K) and lung (L-M) as well as the frequencies and total cell counts of adaptive CD8 and CD4 T cells in the lung (N). (O) Average expression of cell-type markers across clusters. (P) Correlations between genome-wide expression patterns of our myeloid progenitor data and results published by Paul et al. (2015). In each column, Spearman correlations are normalized to cover the range [0-1]. Blue boxes mark the best fit (i.e., candidate identity match) for each of our clusters. (Q) Expression patterns across clusters for some marker genes associated to commitment to the different lineages characterized in this study. (R) Proportion of cells per cluster in both sub-populations (LKS and myeloid progenitors), for cells coming from PBS versus Mtb treated mice. (S) Fisher exact test enrichments (log2 odds ratios) for the fraction of Mtb cells in each cluster. (T) Number of PBS versus Mtb cells in each cluster. (U) Genome wide correlation of Mtb effect sizes (logFC) across clusters. Statistics were (B-H, J-N) One-way ANOVA followed by Tukey’s Multiple Comparisons Test with significance shown compared to day 0 or day 1 post-infection mice for each cell type and Two-tailed Student’s t test (I).
Figure 4
Figure 4
Mtb Suppresses Myelopoiesis and Impairs Innate Training in an IFN-I-Dependent Manner (A and B) Survival following (A) aerosol (n = 6–7 mice/group) or (B) i.v. (n = 8–9 mice/group) infection. (C–E) Total CMPs (C), GMPs (D), and CLPs (E) after i.v. infection. (F) Relative BMDM yield. (G) In vitro BMDM CFUs with Abx in culture. (H) In vitro BMDM CFUs with Abx in vivo. (I) Poly(I:C) model. (J and K) Representative FACS plots of LKS cells as quantified in (K) with percentages (left) and totals (right). (L–P) Total LT-HSCs (L), ST-HSCs (M), MPPs (N), CMPs (O), and CLPs (P). (Q) In vitro BMDM CFUs. (R) β-Glucan model. (S) In vitro BMDM CFUs (n = 6–7 replicates/group). (T) Aerosol survival (7 mice/group). In (A), (B), and (T), log rank test was used. In (C)–(E), (G), (H), (K)–(Q), and (S), two-way ANOVA followed by Sidak’s multiple comparisons test was used. In (F), one-way ANOVA followed by Tukey’s multiple comparisons test was used. Data are representative of two (S) or three (C–Q) independent experiments. See also Figure S4.
Figure S4
Figure S4
IFN-I Signaling Impairs Myelopoiesis, Related to Figure 4 (A-C) WT and Ifnar1−/− mice were infected with 1x10⁶Mtb-iv. Kinetics of the frequencies among single viable BM cells of CMP (A), GMP (B) and CLP (C). (D-F) mice were infected with Mtb via the aerosol route. Percentages of CMP (D), GMP (E) and CLP (F) in the BM at day 60. (G) Active IFN-I was measured in the BM collected after 12, 24, and 36 hours after Poly (I:C) treatment. (H-Q) WT and Ifnar1−/− mice were treated with Poly (I:C), or PBS, at day 0, 2, 4, 6. Frequencies among single viable BM cells of LT-HSC (H), ST-HSC (I), MPP (J), CMP (K) and CLP (L) at days 0, 3 and 7, as well as the total number of MDP (M), cMoP (N), GP (O), Ly6Chi monocytes (P) and neutrophils (Q) at day 3 post-Poly-(I:C) treatment. (R-X) WT mice were treated with β-glucan at day 0 and day 3. Frequencies among BM cells (left panel) and total cell counts (right panel) of LKS (R), LT-HSC (S), ST-HSC (T), MPP (U), CMP (V), GMP (W) and CLP (X) in PBS (day 0) or β-glucan i.p. at day 7 post-treatment. Differences determined by Two-way ANOVA followed by Sidak’s Multiple Comparisons Test in A-C, H-Q, Two-Tailed Student’s T-Test in D-F, One-way ANOVA followed by Dunnett’s Multiple Comparisons Test in G and Non-Parametric Mann-Whitney Test R-X.
Figure 5
Figure 5
IFN-I Regulates Fe Metabolism in Myeloid Progenitors and Triggers Necrosis (A) Frequencies of necrotic (NucSpot+ AnnexinV) CMPs (left) and GMPs (right) on day 7. (B) Ripk3 expression in HSCs. (C–H) Mice were infected i.v. for 7 days. (C–E) Percentage (left) and total (right) of CMPs (C) and GMPs (D) and total CLPs (E). (F) CMPs with disrupted MMP. (G) Relative mitochondrial Fe2+ in CMPs. (H) Representative histograms (left) and quantification (right) of CMP CD71 expression. (I–L) WT and Ifnar1−/− mice were infected i.v. for 28 days. (I) Representative histograms (left) and quantification (right) of CMP CD71 expression. (J) Percentage of necrotic CMPs. (K) Relative mitochondrial Fe2+ in CMPs. (L) CMPs with disrupted MMP. (M–R) WT and Ifnar1−/− mice were treated with poly(I:C) for 3 days. (M) CMP CD71 expression. (N) Representative micrographs (left) and total puncta (right) of BM Perl’s Prussian Blue; the scale bar represents 50 μM. (O) Relative mitochondrial Fe2+ in CMPs. (P) CMPs with disrupted MMP. (Q and R) Frequency of ROS+ (Q) or necrotic (R) CMPs. (S–V) WT mice were infected with aerosolized Mtb for 120 days. (S) Representative histograms (left) and quantification (right) of CMP CD71 expression. (T) CMPs with disrupted MMP. (U and V) Percentage of necrotic CMPs (U) or GMPs (V). In (A) and (F)–(H), one-Way ANOVA followed by Tukey’s comparison test was used. In (C)–(E) and (S)–(V), two-tailed Student’s t test was used. In (I)–(R), two-way ANOVA followed by Sidak’s, Tukey’s, or Dunnett’s multiple comparisons test was used. Data are representative of two (A and F–I) independent experiments or are pooled from 2–3 individual experiments (M–R). See also Figure S5.
Figure S5
Figure S5
The IFN-I/Iron Axis Regulates Cell Death of Myeloid Progenitors, Related to Figure 5 Frequency of necrotic (NucSpot+ AnnexinV-) CLP (A) in the BM of BCG-iv and Mtb-iv infected mice at day 7. (B-D) Frequency among single viable BM cells (left panels) and total cell counts (right panels) of CMP (B), GMP (C), CLP (D) of naive WT and Ripk3−/− mice. (E) Frequency among BM cells of CLP in WT and Ripk3−/−Mtb-iv infected mice at day 7. (F) Frequency of CLP with disrupted mitochondria in the BM of BCG-iv and Mtb-iv infected mice at day 7. (G) Relative levels of mitochondrial iron (Fe2+) in CLP of BCG-iv and Mtb-iv infected mice at day 7. (H) Representative histogram of expression of CD71 (left panel) and quantification of CD71 expression (right panel) on CLPs in the BM of Mtb-iv infected WT and Ifnar1−/− mice at day 28. (I) Expression of CD71 on CLPs in the BM of WT and Poly (I:C)-treated WT and Ifnar1−/− mice. (J) Relative proportion of mitochondrial iron dye (Fe2+) in the CLP of Poly (I:C)-treated WT and Ifnar1−/− mice. Frequency of CLPs with a disrupted mitochondrial potential (K), high mitochondrial ROS (L), or those that are necrotic (M). Differences were assessed via One-way ANOVA followed by Tukey’s Multiple Comparison Test (A; F-G), Two-tailed Student’s T-Test (B-E), Two-way ANOVA followed by Sidak’s Multiple Comparisons Test (H-M).
Figure 6
Figure 6
Iron Dysregulation in the BM Promotes Susceptibility to TB (A) FthΔ/Δ model. (B and C) Percentages (left) and numbers (right) of CMPs (B) or GMPs (C). (D) BM-Fth−/− model. (E) BM ferritin immunoblot; actin = loading control. (F) Percentage (left) and total (right) of CMPs. (G and H) Relative mitochondrial Fe2+ (G) or disrupted MMP (H) in CMPs. (I) In vitro BMDM CFUs. (J and K) BM-Fth+/+ or BM-Fth−/− mice were infected with aerosolized Mtb for 28 days. Shown are BM (J) and lung (K) CFUs. (L) Aerosol survival (n = 5 mice/group). One-way ANOVA followed by Tukey’s multiple comparisons test was used in (B) and (C). Two-tailed Student’s t test was used in (F)–(H), (J), and (K). Two-way ANOVA followed by Sidak’s multiple comparisons test (I) or log rank test (L) was used. Data are pooled from two experiments (B and C) or representative of two independent experiments (E, F–H, and I). See also Figure S6.
Figure S6
Figure S6
Loss of Iron Homeostasis Disrupts Myelopoiesis, Related to Figure 6 (A) Frequency (left panel) and total cell count (right panel) of CLP in FthΔ/Δ, R26cre or Fthlox/lox mice as generated in Figure 6A. (B-G) BM-Fth+/+ or BM-Fth−/− chimeric mice were generated as described in Figure 6D. Frequency (left panel) and total cell count (right panel) of CLP in BM-Fth+/+ or BM-Fth−/− chimeric mice (B). (C) Relative percentage of iron (Fe2+) specific dye in the mitochondria of CLP in the BM of BM-Fth−/− compared to BM-Fth+/+ mice. (D) BCG CFU (infection at MOI 10) in BMDM from BM-Fth+/+ or BM-Fth−/− mice at the indicated time points. CFU in the liver (E) and spleen (F) following 28 days of aerosol Mtb infection. Frequency of myeloid cell populations in the lung (G), BM (H) and spleen (I) of naive BM-Fth+/+ and BM-Fth−/− mice. Differences assessed by One-way ANOVA followed by Tukey’s Multiple Comparisons Test (A), Two-tailed Student’s T-Test (B-C and E-I), or Two-way ANOVA followed by Sidak’s Multiple Comparisons Test (D).
Figure 7
Figure 7
Mtb-i.v. Causes BM Exhaustion and Has Long-Term Effects on BMDM Training (A) Mixed chimera model. (B and C) Percentage of CD45.1+ versus CD45.2+ leukocytes (B) or Ly6Chi monocytes (C) in the blood (n = 5–10/group). (D–J) In the BM, percentage of LKS cells (D), LT-HSCs (E), ST-HSCs (F), MPPs (G), CMPs (H), GMPs (I), and CLPs (J) after 16 weeks of reconstitution. (K) Secondary engraftment model. (L–N) Number of LKS cells (L), LT-HSCs (M), and CMPs (N). (O and P) Myeloid colonies (O) and cell type by flow cytometry (P) by BM methylcellulose CFU assay. (Q) In vitro BMDM CFUs. (R and S) Number of genes up- and downregulated by Mtb and BCG in each cluster (abs(logFC) > 0.1 and FDR < 0.05) of LKS cells (R) and cKit+ cells (S). (T) GSEA of genes ranked according to BCG (left) or Mtb (right) effects in the GMP_MonP cluster. (U) Distribution of expression levels in GMP_MonP for gene set average markers in four different hallmark gene sets. (V) Il6ra and Flt3 expression in the GMP_MonP cluster. Two-way ANOVA followed by Sidak’s multiple comparisons test was used in (B), (C), (P), and (Q). One-way ANOVA followed by Tukey’s multiple comparisons test was used in (L)–(O). In (D–J), two-tailed Student’s t test was used to assess differences. In (B) and (C), only significant differences at 16 weeks are depicted. See also Figure S7.
Figure S7
Figure S7
Mtb-Imprinted HSCs Have Impaired Engraftment for up to at Least 1 Year Post-exposure, Related to Figure 7 (A-K) Mixed chimeric mice were generated as described in Figure 7A. At 4-week intervals post-reconstitution, peripheral blood was sampled. Percentages of CD45.1+ versus CD45.2+ leukocytes (A), Ly6Chi monocytes (B), neutrophils (C) or T cells (D) in the blood. At 16 weeks post-reconstitution, BCG:Mtb mixed chimera mice were sacrificed. Frequency of total BM CD45 (E), CCR2+ monocytes (F), or neutrophils (G), as well as pulmonary leukocytes (H), CCR2+ monocytes (I), neutrophils (J) and macrophages (K). (L-R) Secondary engraftment experiments were performed as in Figure 7K. Mtb CFU in the BM cells prior to secondary engraftment (L). In the peripheral blood, total cell counts of CD11b+ cells (M), Ly6Chi monocytes (N) and neutrophils (O), as well as BM LKS (P), LT-HSC (Q) and CMP (R) frequencies. (S-T) UMAP dimensionality reduction plots for LKS and myeloid progenitor cells, respectively, for the serial engraftment experiment. (U) Schematic hematopoietic tree diagram showing the approximated position of the different clusters identified (cluster specific color code common to panels S-T). (V) Average expression of cell-type markers across clusters. (W) Correlations between genome-wide expression patterns of our myeloid progenitor data and results published by Paul et al. (2015). In each column, Spearman correlations are normalized to cover the range [0-1]. Blue boxes mark the best fit (i.e., candidate identity match) for each of our clusters. (X) Expression patterns across clusters for some marker genes associated to commitment to the different lineages characterized in this study. (Y) Genome wide correlation of Mtb versus BCG effect sizes (logFC) in each cluster. Differences measured via Two-Way ANOVA followed by Sidak’s Multiple Comparison Test (A-D), Student’s Two-tailed T-Test (E-K) and One-Way ANOVA followed by Tukey’s Multiple Comparisons Test in (M-R). In A-D, only significant differences at 16 weeks were labeled.

Comment in

References

    1. Akashi K., Kondo M., von Freeden-Jeffry U., Murray R., Weissman I.L. Bcl-2 rescues T lymphopoiesis in interleukin-7 receptor-deficient mice. Cell. 1997;89:1033–1041. - PubMed
    1. al-Rafaie F.N., Wilkes S., Wonke B., Hoffbrand A.V. The effect of deferiprone (L1) and desferrioxamine on myelopoiesis using a liquid culture system. Br. J. Haematol. 1994;87:196–198. - PubMed
    1. Altare F., Durandy A., Lammas D., Emile J.F., Lamhamedi S., Le Deist F., Drysdale P., Jouanguy E., Doffinger R., Bernaudin F. Impairment of mycobacterial immunity in human interleukin-12 receptor deficiency. Science. 1998;280:1432–1435. - PubMed
    1. Alter A., de Leseleuc L., Van Thuc N., Thai V.H., Huong N.T., Ba N.N., Cardoso C.C., Grant A.V., Abel L., Moraes M.O. Genetic and functional analysis of common MRC1 exon 7 polymorphisms in leprosy susceptibility. Hum. Genet. 2010;127:337–348. - PMC - PubMed
    1. Antonelli L.R., Gigliotti Rothfuchs A., Goncalves R., Roffe E., Cheever A.W., Bafica A., Salazar A.M., Feng C.G., Sher A. Intranasal Poly-IC treatment exacerbates tuberculosis in mice through the pulmonary recruitment of a pathogen-permissive monocyte/macrophage population. J. Clin. Invest. 2010;120:1674–1682. - PMC - PubMed

Publication types

MeSH terms