. 2020 Oct 29;183(3):771-785.e12.
doi: 10.1016/j.cell.2020.09.058.

Innate Immune Training of Granulopoiesis Promotes Anti-tumor Activity

Affiliations

Innate Immune Training of Granulopoiesis Promotes Anti-tumor Activity

Lydia Kalafati et al. Cell. .

Abstract

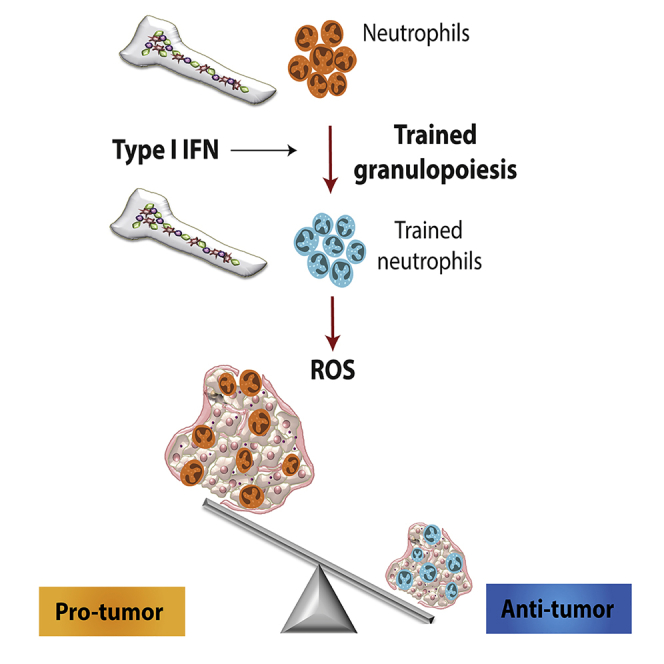
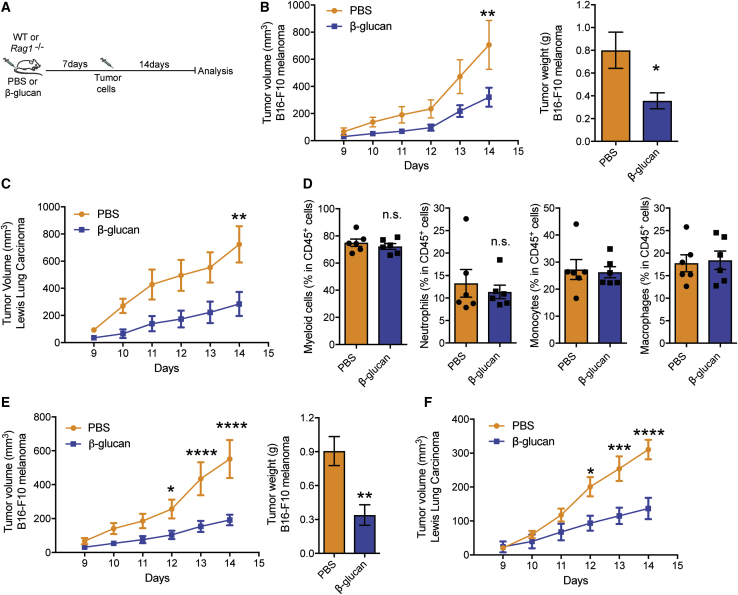
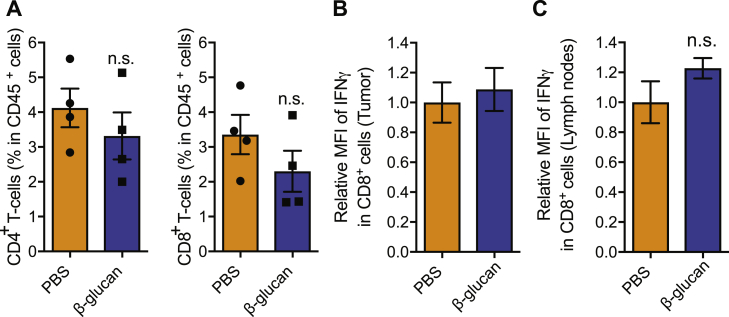
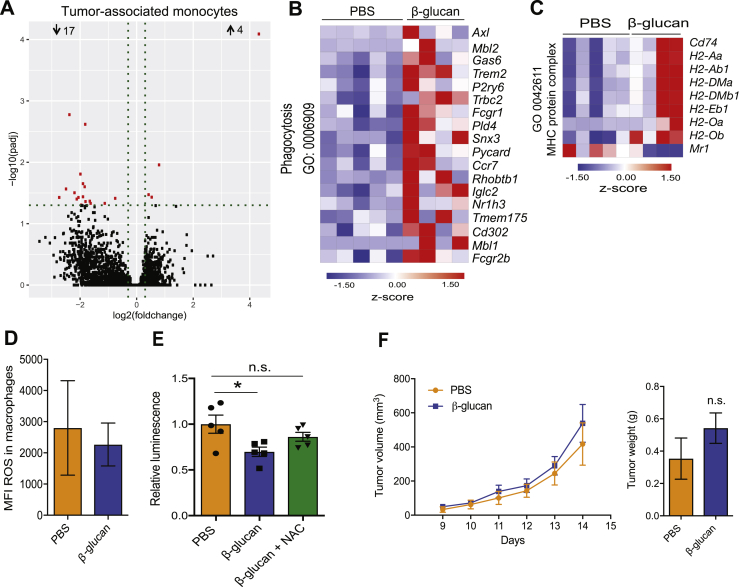
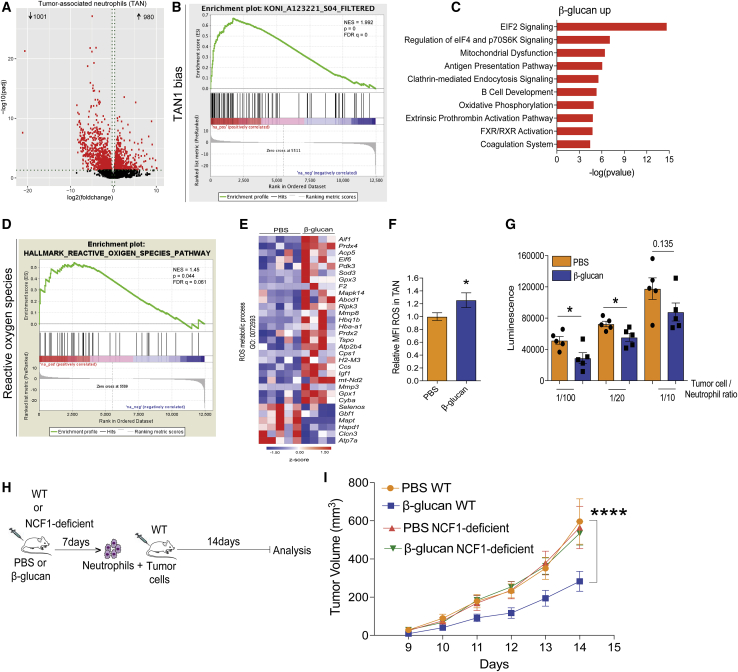
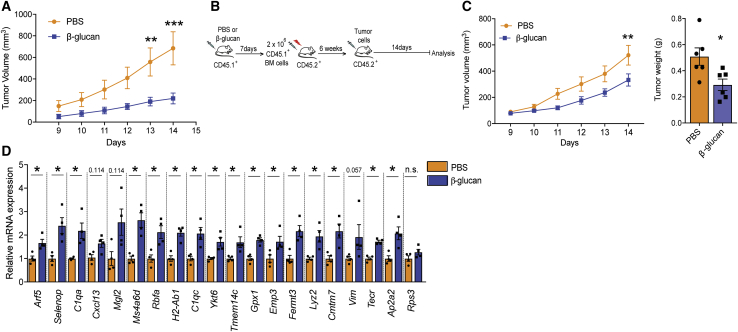
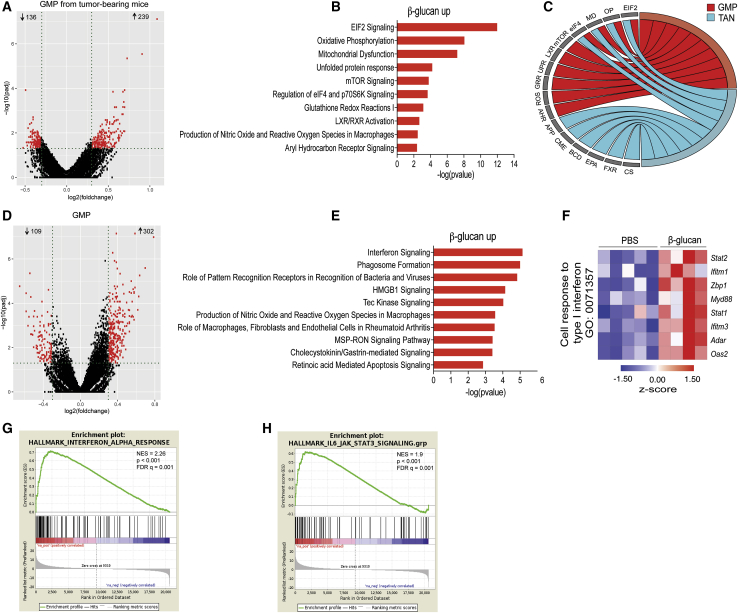
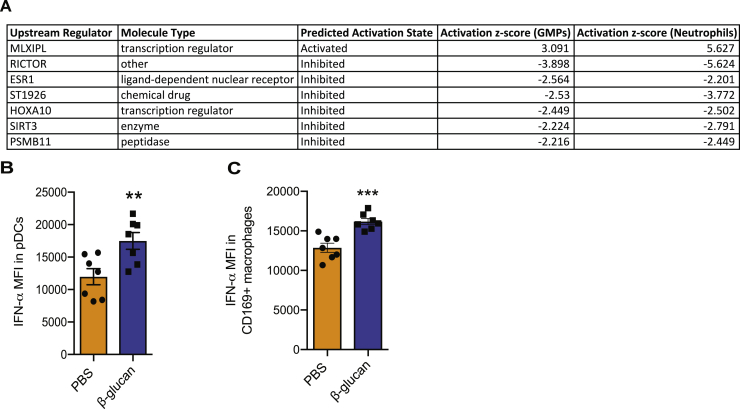
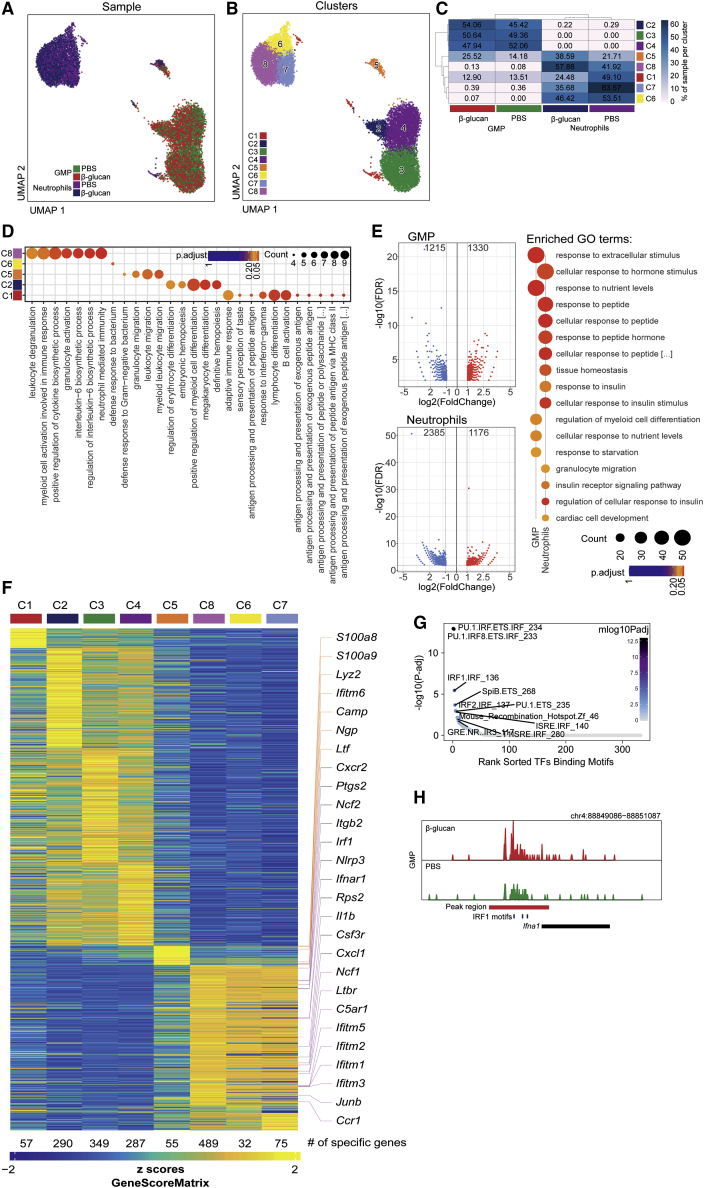
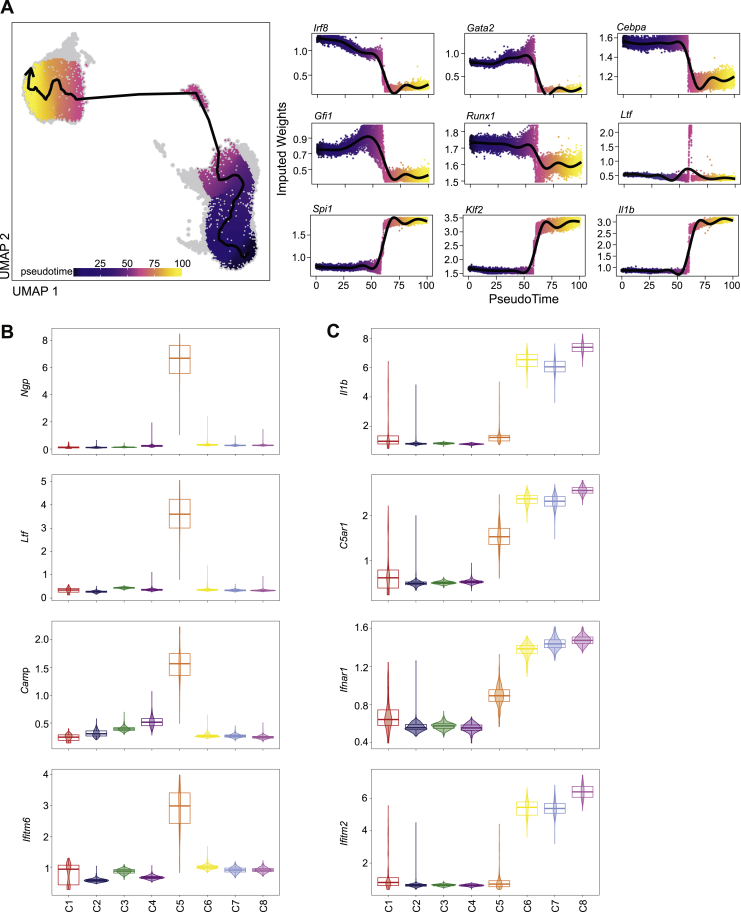
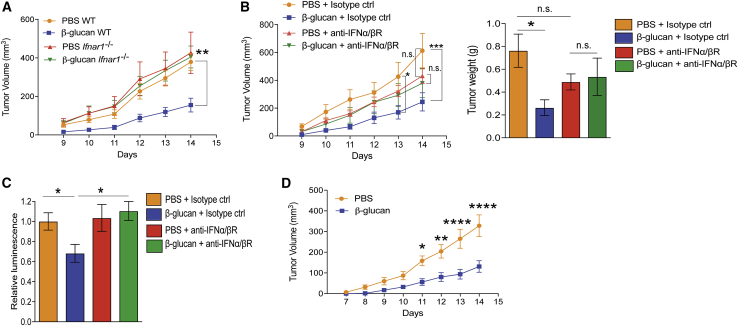
Trained innate immunity, induced via modulation of mature myeloid cells or their bone marrow progenitors, mediates sustained increased responsiveness to secondary challenges. Here, we investigated whether anti-tumor immunity can be enhanced through induction of trained immunity. Pre-treatment of mice with β-glucan, a fungal-derived prototypical agonist of trained immunity, resulted in diminished tumor growth. The anti-tumor effect of β-glucan-induced trained immunity was associated with transcriptomic and epigenetic rewiring of granulopoiesis and neutrophil reprogramming toward an anti-tumor phenotype; this process required type I interferon signaling irrespective of adaptive immunity in the host. Adoptive transfer of neutrophils from β-glucan-trained mice to naive recipients suppressed tumor growth in the latter in a ROS-dependent manner. Moreover, the anti-tumor effect of β-glucan-induced trained granulopoiesis was transmissible by bone marrow transplantation to recipient naive mice. Our findings identify a novel and therapeutically relevant anti-tumor facet of trained immunity involving appropriate rewiring of granulopoiesis.

Keywords: cancer immunotherapy; granulopoiesis; inflammation; innate immune memory; interferon; neutrophils; trained immunity; β-glucan.


Conflict of interest statement

Declaration of interests M.G.N. is scientific founder of Trained Therapeutics and Discovery (TTxD).

Figures

None
Graphical abstract
Figure 1
Figure 1
Induction of Trained Immunity Inhibits Tumor Growth (A) Experimental scheme. (B) C57BL/6 WT mice received a single i.p. injection of β-glucan or PBS and 7 days thereafter, mice were subcutaneously inoculated with B16-F10 melanoma cells. Shown on the left, tumor volume was monitored for another 14 days after tumor inoculation. Shown on the right, tumor weight at the end of the experiment (n = 6 mice in the PBS group; n = 7 mice in the β-glucan group). (C) C57BL/6 WT mice received a single i.p. injection of β-glucan or PBS and 7 days thereafter, mice were inoculated with LLC cells. Tumor volume is shown (n = 7 mice in the PBS group; n = 5 mice in the β-glucan group). (D) C57BL/6 WT mice received β-glucan or PBS and 7 days thereafter, mice were inoculated with B16-F10 melanoma cells. Flow-cytometric analysis for immune cells that are infiltrated in the B16-F10 melanoma tumors was performed at the end of the experiment. Frequencies of myeloid cells (CD45+CD11b+), neutrophils (CD45+CD11b+Ly6g+Ly6c), monocytes (CD45+CD11b+Ly6gLy6c+), and macrophages (CD45+CD11b+F4/80+) within leukocytes (CD45+) are shown (n = 6 mice per group). (E) Rag1−/− mice received a single i.p. injection of β-glucan or PBS and 7 days thereafter, mice were inoculated with B16-F10 melanoma cells. Shown on the left is tumor volume; on the right is tumor weight at the end of the experiment (n = 8 mice in the PBS group; n = 5 mice in the β-glucan group). (F) Rag1−/− mice received β-glucan or PBS and 7 days thereafter, mice were inoculated with LLC cells. Tumor volume is shown (n = 16 mice in the PBS group; n = 12 mice in the β-glucan group). Data are presented as mean ± SEM; n.s., non-significant; p < 0.05, ∗∗p < 0.01, ∗∗∗p < 0.001, ∗∗∗∗p < 0.0001. See also Figure S1.
Figure S1
Figure S1
The Effect of Trained Immunity on Immune Cell Composition in the Tumors and IFNγ Levels in CD8+ Cells of Tumor-Bearing Mice, Related to Figure 1 WT mice received a single intraperitoneal injection with β-glucan or control PBS, and 7 days later received subcutaneous injection of B16-F10 melanoma cells; mice were sacrificed 14 days after tumor inoculation. (A) Frequencies of CD4+ T cells (CD45+CD4+CD8) and CD8+ T cells (CD45+CD4CD8+) within leukocytes (CD45+) in the tumor. (B and C) Expression of interferon gamma (IFNγ) in CD8+ T cells from tumor tissue (B) and draining lymph nodes (C) was assessed by flow cytometry. Data are shown as relative Mean fluorescence intensity (MFI); the MFI of IFNγ in CD8+ T cells from PBS-treated mice was set as 1 in each case. Data are presented as mean ± SEM (A and C: n = 4 mice / group; B: n = 5 mice in the PBS group and n = 4 mice in the β-glucan group). n.s., non-significant.
Figure S2
Figure S2
The Effect of Trained Immunity on the Transcriptomic Profile of Tumor-Associated Monocytes and TAN, Related to Figure 2 (A) WT mice were treated with β-glucan or PBS, and 7 days later received B16-F10 melanoma cells. Mice were sacrificed 14 days after tumor inoculation and monocytes (CD45+CD11cCD11b+Ly6gLy6c+) were sorted from the tumor tissue for RNA sequencing analysis. Differential gene expression in monocytes. Volcano plot showing the distribution of the adjusted p values (−log10(padj)) and fold changes (log2 fold change). FDR ≤ 0.05 (n = 5 mice in the PBS group and n = 4 mice in the β-glucan group). (B and C) WT mice were treated with β-glucan or PBS, and 7 days later received B16-F10 melanoma cells. Mice were sacrificed 14 days after tumor inoculation and TAN (CD45+CD11cCD11b+Ly6cLy6g+) were sorted from the tumor tissue for RNA sequencing analysis. FDR ≤ 0.05. (B) Heatmap of genes involved in phagocytosis in TAN from β-glucan-treated mice as compared to PBS-treated mice (n = 5 mice in the PBS group and n = 4 mice in the β-glucan group). (C) Heatmap of genes involved in MHC-protein complex in TAN from β-glucan-treated mice as compared to PBS-treated mice (n = 5 mice in the PBS group and n = 4 mice in the β-glucan group). (D) WT mice were treated with β-glucan or PBS, and 7 days later received B16-F10 melanoma cells. Mice were sacrificed 14 days after tumor inoculation and staining for ROS in tumor-associated macrophages (CD45+CD11b+Ly6gF4/80+) was performed using flow cytometry. Median fluorescence intensity (MFI) is shown (n = 6 mice / group). (E) Splenic neutrophils were isolated from mice 7 days after injection with β-glucan or PBS. Neutrophils were co-cultured with luciferase expressing B16-F10 cells at 100:1 neutrophil/tumor cell ratio for 24 h. N-Acetyl-Cysteine (NAC; 5mM) was used to scavenge ROS. Tumor cell survival was assessed by measuring luminescence. Luminescence is expressed relative to the PBS-control group, set as 1 (n = 5 cell isolations per group). (F) WT mice were injected with β-glucan or PBS and after 7 days splenic monocytes were isolated and were adoptively transferred together with B16-F10 cells into WT mice. Tumor volume (left) and weight of the tumor tissue at the end of the experiment (right) are shown (n = 5 mice in the PBS group; n = 6 mice in the β-glucan group). Data are presented as mean ± SEM n.s.: non-significant; p < 0.05.
Figure 2
Figure 2
Trained Immunity Shapes the Transcriptional Profile of TANs and Neutrophils from β-Glucan-Trained Mice Suppress Tumor Growth via ROS Production (A–E) WT mice were treated with β-glucan or PBS and after 7 days were inoculated with B16-F10 melanoma cells. TANs (CD45+CD11cCD11b+Ly6cLy6g+) were sorted and RNA sequencing analysis was performed (n = 5 mice in the PBS group; n = 4 mice in the β-glucan group) 14 days after the tumor injection. In (A), (C) and (E), false discovery rate (FDR) ≤ 0.05. (A) Differential gene expression in TANs from mice pre-treated with β-glucan compared with TANs from PBS-treated mice. Volcano plot showing the distribution of the adjusted p values (−log10(padj)) and fold changes (log2 fold change). (B) GSEA for genes related to a gene set previously implicated in the TAN1 phenotype (Shaul et al., 2016) was used to analyze the transcriptomic effect induced in TANs by β-glucan administration in mice. Abbreviation is as follows: NES, normalized enrichment score. (C) Top 10 enriched canonical pathways identified by IPA in TANs from β-glucan-treated mice compared to PBS-treated mice. (D and E ) Shown in (D) is a GSEA for genes related to ROS pathway, and in (E) is a heatmap of genes involved in ROS metabolic process in TANs from β-glucan-treated mice as compared with TANs from PBS-treated mice. (F) WT mice were treated with β-glucan or PBS and after 7 days were inoculated with B16-F10 melanoma cells. Staining for ROS in TANs (CD45+CD11b+Ly6g+) was performed by flow cytometry 14 days after the tumor cell injection. Relative mean fluorescence intensity (MFI) is shown. MFI of ROS was measured and expressed in relation to the PBS group, set as 1. Data are presented as mean ± SEM (n = 15 per group). (G) Splenic neutrophils were isolated from mice 7 days after injection with β-glucan or PBS. Neutrophils were co-cultured with luciferase expressing B16-F10 cells for 24 h. Tumor cell survival was assessed by measuring luminescence (n = 5 per group). (H) Experimental scheme. (I) As indicated in (H), WT or NCF1-deficient mice were injected with β-glucan or PBS, and after 7 days splenic neutrophils were isolated and were adoptively transferred together with B16-F10 cells into WT recipients. Tumor volume is shown. Data are presented as mean ± SEM (n = 7 mice in the PBS WT group; n = 12 mice in the β-glucan WT group; n = 11 mice in the PBS NCF1-deficient group; n = 14 mice in the β-glucan NCF1-deficient group). p < 0.05, ∗∗∗∗p < 0.0001. See also Figure S2.
Figure 3
Figure 3
Long-Term Anti-tumor Effects of Trained Granulopoiesis (A) WT mice were treated with β-glucan or PBS, and after 28 days were subcutaneously inoculated with B16-F10 melanoma cells. Tumor volume was monitored for another 14 days after tumor inoculation (n = 5 mice in the PBS group; n = 6 mice in the β-glucan group). (B–D) As indicated in the experimental scheme (B), WT CD45.1+ mice were injected with β-glucan or PBS, and after 7 days BM cells were isolated and were transplanted into CD45.2+ mice. Six weeks after transplantation, recipient mice were inoculated with tumors. In (C), (left) tumor volume and (right) the weight of B16-F10 melanoma tumors at the end of the experiment are shown (n = 6 mice per group). Shown in (D), 14 days after the tumor injection in recipient mice, TANs (CD45+CD11cCD11b+Ly6cLy6g+) were sorted and relative mRNA expression of the “trained TAN1-like signature” was performed. Relative mRNA expression was normalized against 18S rRNA and was set as 1 in TANs from recipients that were transplanted with cells from PBS-treated donor mice (n = 4 mice per group). Data are presented as mean ± SEM; n.s.. non-significant; p < 0.05, ∗∗p < 0.01, ∗∗∗p < 0.001. See also Figure S3.
Figure S3
Figure S3
Adoptive Transfer of Neutrophils after Short-Term β-Glucan-Treatment in Mice, Related to Figure 3 WT mice were injected with β-glucan or PBS and after 1 day splenic neutrophils were isolated and were adoptively transferred together with B16-F10 cells into WT mice. Tumor volume (left) and weight of the tumor tissue at the end of the experiment (right) is shown (n = 7 mice in the PBS group; n = 6 mice in the β-glucan group). Data are presented as mean ± SEM. n.s., non-significant.
Figure 4
Figure 4
Transcriptomic Alterations in GMP Due to Trained Immunity (A–C) WT mice were treated with β-glucan or PBS and after 7 days were inoculated with B16-F10 melanoma cells. BM GMPs (Linc-Kit+Sca1CD16/32+CD34+) were sorted 14 days after tumor cell injection and RNA sequencing analysis was performed (n = 4 mice in the PBS group and n = 3 mice in the β-glucan group). (A) Differential gene expression in GMPs from tumor-bearing mice pre-treated with β-glucan as compared with GMPs from PBS-treated mice. Volcano plot showing the distribution of the adjusted p values (−log10(padj)) and fold changes (log2 fold change). FDR ≤ 0.05. (B) Top 10 enriched canonical pathways identified by IPA in GMPs from β-glucan-treated mice, compared with GMPs from PBS-treated mice. FDR ≤ 0.05. (C) Circos plot showing the commonly enriched pathways (within the top 10 enriched canonical pathways) between TANs and GMPs from tumor-bearing mice. Abbreviations are as follows: EIF2, EIF2 signaling; OP, oxidative phosphorylation; MD, mitochondrial dysfunction; eIF4, regulation of eIF4 and p70S6K signaling; mTOR, mTOR signaling; LXR, LXR/RXR activation; UPR, unfolded protein response; GRR, glutathione redox reactions I; ROS, production of nitric oxide and reactive oxygen species in macrophages; AHR, aryl hydrocarbon receptor signaling; APP, antigen presentation pathway; CME, clathrin-mediated endocytosis signaling; BCD, B cell development; EPA, extrinsic prothrombin activation pathway; FXR, FXR/RXR activation; CS, coagulation system. (D–H) WT mice were treated with β-glucan or PBS and after 7 days BM GMP were sorted for RNA sequencing analysis (n = 5 mice in the PBS group and n = 4 mice in the β-glucan group). In (D)–(F), FDR ≤ 0.05. (D) Differential gene expression in GMPs from mice pre-treated with β-glucan compared with GMPs from PBS-treated mice. Volcano plot showing the distribution of the adjusted p values (−log10(padj)) and fold changes (log2 fold change). (E) Top 10 enriched canonical pathways identified by IPA in GMPs from β-glucan-treated mice as compared with GMPs from PBS-treated mice. (F and G) In (F) is a heatmap of genes involved in the cell response to type I IFN, and in (G) is a GSEA for genes related to IFN-α response in GMPs from β-glucan-treated mice as compared with GMPs from PBS-treated mice. (H) GSEA for genes related to the IL6-Jak-Stat3 signaling pathway in GMPs from β-glucan-treated mice as compared with GMPs from PBS-treated mice. See also Figure S4.
Figure S4
Figure S4
The Effect of Trained Immunity on the Transcriptomic Profile of TAN and BM GMP and on IFNα Levels in BM pDCs and CD169+ Macrophages, Related to Figure 4 (A) WT mice were treated with β-glucan or PBS and after 7 days were inoculated with B16-F10 melanoma tumors. 14 days after the tumor injection, TAN and BM GMP were sorted and RNA sequencing analysis was performed (RNA sequencing analysis of TANs is shown in Figure 2). Upstream regulator analysis in transcriptomic data using IPA was performed. Common upstream regulators in the transcriptomic profile of TAN and BM GMPs from tumor-bearing mice are listed (TAN: n = 5 mice in the PBS group and n = 4 mice in the β-glucan group; GMP: n = 4 mice in the PBS group and n = 3 mice in the β-glucan group). (B) Intracellular staining for IFNα in pDCs from the BM of mice 7 days after β-glucan or PBS treatment was performed. Median fluorescence intensity (MFI) (n = 7 mice / group). (C) Intracellular staining for IFNα in CD169+ macrophages from the BM of mice 7 days after β-glucan or PBS treatment was performed. Median fluorescence intensity (MFI) (n = 7 mice / group). ∗∗p < 0.01; ∗∗∗p < 0.001.
Figure 5
Figure 5
Epigenetic Rewiring of Trained Granulopoiesis Splenic neutrophils and BM GMPs were sorted from mice that were treated with β-glucan or with PBS 7 days earlier and scATACseq was performed. (A and B) Two-dimensional UMAP representation of 13,383 cells, on the basis of genome-wide tile matrices of 500 bp bins colored, according to (A) sample origin and (B) results of Louvain clustering. (C) Heatmap visualization of the distribution of cells from the four different samples (GMPs and neutrophils from PBS-treated or β-glucan-treated mice) within each of the identified clusters, normalized for the number of cells per sample in the dataset. (D) GO enrichment results of cluster-specific marker genes determined on the basis of gene activity scores (Bonferroni-corrected p value cut-off = 0.1). (E) Volcano plots displaying differential accessibility analysis results based on MACS2-defined peak regions for GMP and neutrophils from β-glucan-treated mice as compared with the respective cells from PBS-treated mice (FDR ≤ 0.01 and abs(Log2FC) ≥ 1). Top 10 significantly enriched GO terms sorted by GeneRatio identified on the basis of genes annotated to regions more accessible due to β-glucan treatment are shown on the side (Bonferroni-corrected p value cut-off = 0.1). (F) Heatmap visualization of gene activity scores of cluster-specific marker genes (FDR ≤ 0.01, log2FC ≥ 1). Selected genes are indicated. (G) Visualization of transcription factor (TF) binding motif enrichment analysis results for the β-glucan specifically accessible regions in GMPs by using the homer TF motif database. (H) Genome browser track showing a DAR in proximity to the Ifna1 gene locus and the IRF1 binding motifs within this region. See also Figure S5.
Figure S5
Figure S5
scATACseq Analysis, Related to Figure 5 (A) Two-dimensional UMAP representation of 13383 cells, based on genome-wide tile matrices of 500 bp bins, colored by pseudo-time values, as determined by trajectory analysis (left). The arrow indicates the approximated differentiation path. Gene activity scores of selected key genes of granulopoiesis (‘GMP-genes’: Irf8, Gata2, Cebpa; ‘pre-neutrophils / immature neutrophils-genes’: Gfi1, Runx1, Ltf; ‘mature neutrophils-genes’: Spi1, Klf2, Il1b, as previously defined (Evrard et al., 2018) are visualized as a function of the pseudo-time as dot plots (right). (B) Violin plots showing gene activity scores of Ngp, Ltf, Camp, and Ifitm6 across the identified clusters. (C) Violin plots showing gene activity scores of Il1b, C5ar1, Ifnar1, and Ifitm2 across the identified clusters.
Figure 6
Figure 6
Type I IFN Signaling Promotes the Anti-tumor Activity of Trained Granulopoiesis (A) WT or Ifnar1−/− mice were injected with β-glucan or PBS, and after 7 days splenic neutrophils were isolated and adoptively transferred together with B16-F10 cells into WT recipients. Tumor volume was determined (n = 9–13 mice per group). (B and C) WT mice were injected with a monoclonal antibody against the receptor for IFNα/β (anti-IFNα/βR) or isotype control one day before and on the same day that β-glucan or PBS was administered. Seven days after the second injection, splenic neutrophils were isolated and were (B) adoptively transferred together with B16-F10 cells into WT recipients, or (C) were co-cultured with luciferase-expressing B16-F10 cells at 100/1 neutrophil/tumor cell ratio for 24 h. In (B), (left) tumor volume and (right) tumor weight at the end of the experiment are shown (n = 7–12 mice per group). In (C), survival of tumor cells was assessed by measuring luminescence. Luminescence is expressed in relation to the PBS + isotype control group, set as 1 (n = 10 per group). (D) WT mice were injected with β-glucan or PBS, and after 7 days splenic neutrophils were isolated and systemically administered to mice that were inoculated with B16-F10 tumors 5 days earlier. Tumor volume is shown (n = 10 mice per group). Data are presented as mean ± SEM. n.s., non-significant; p < 0.05, ∗∗p < 0.01, ∗∗∗p < 0.001, ∗∗∗∗p < 0.0001.

References

    1. Aachoui Y., Leaf I.A., Hagar J.A., Fontana M.F., Campos C.G., Zak D.E., Tan M.H., Cotter P.A., Vance R.E., Aderem A., Miao E.A. Caspase-11 protects against bacteria that escape the vacuole. Science. 2013;339:975–978. - PMC - PubMed
    1. Alexander M.P., Fiering S.N., Ostroff G.R., Cramer R.A., Mullins D.W. Beta-glucan-induced inflammatory monocytes mediate antitumor efficacy in the murine lung. Cancer Immunol. Immunother. 2018;67:1731–1742. - PMC - PubMed
    1. Alissafi T., Hatzioannou A., Mintzas K., Barouni R.M., Banos A., Sormendi S., Polyzos A., Xilouri M., Wielockx B., Gogas H., Verginis P. Autophagy orchestrates the regulatory program of tumor-associated myeloid-derived suppressor cells. J. Clin. Invest. 2018;128:3840–3852. - PMC - PubMed
    1. Andzinski L., Kasnitz N., Stahnke S., Wu C.F., Gereke M., von Köckritz-Blickwede M., Schilling B., Brandau S., Weiss S., Jablonska J. Type I IFNs induce anti-tumor polarization of tumor associated neutrophils in mice and human. Int. J. Cancer. 2016;138:1982–1993. - PubMed
    1. Arts R.J., Joosten L.A., Netea M.G. Immunometabolic circuits in trained immunity. Semin. Immunol. 2016;28:425–430. - PubMed

Publication types