. 2020 Oct 28;10(11):875.
doi: 10.3390/diagnostics10110875.

Early Detection of Coronary Artery Disease by Micro-RNA Analysis in Asymptomatic Patients Stratified by Coronary CT Angiography

Affiliations

Early Detection of Coronary Artery Disease by Micro-RNA Analysis in Asymptomatic Patients Stratified by Coronary CT Angiography

Andrew J Patterson et al. Diagnostics (Basel). .

Abstract

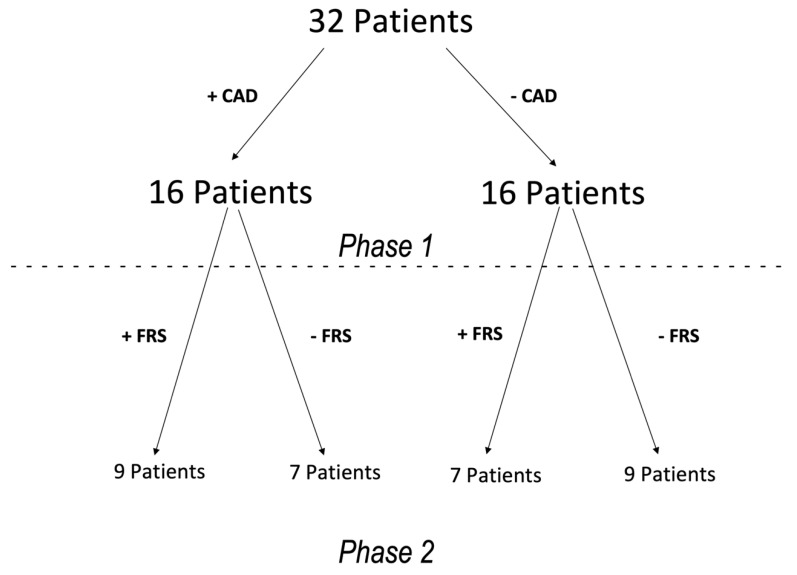
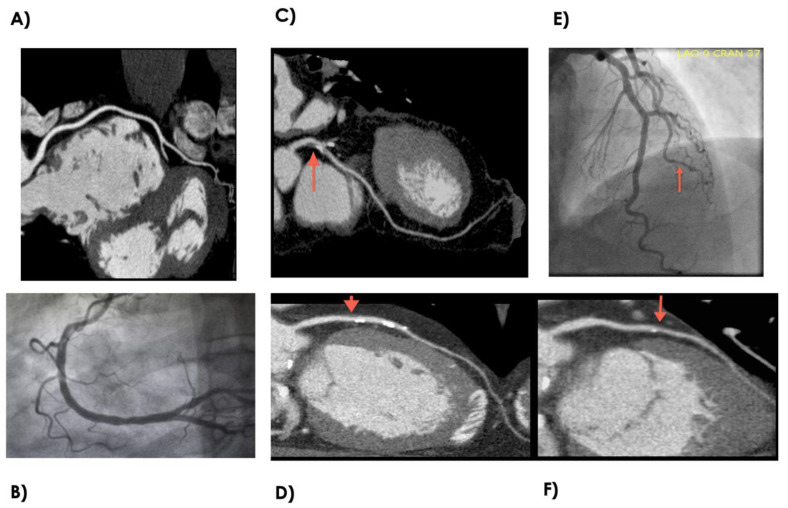
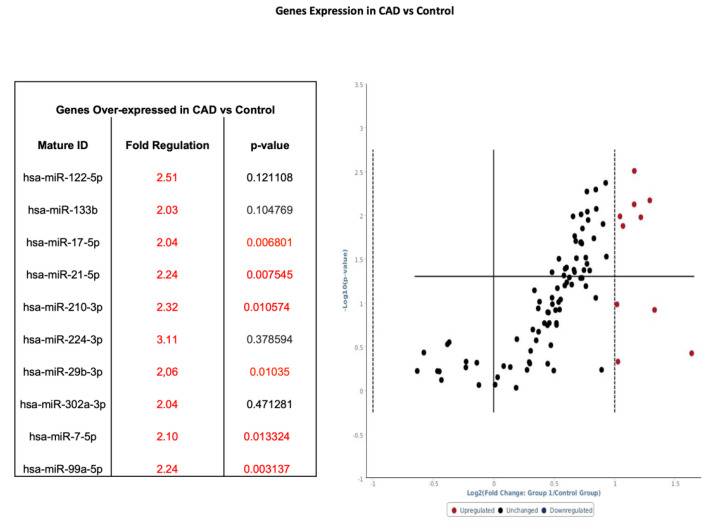
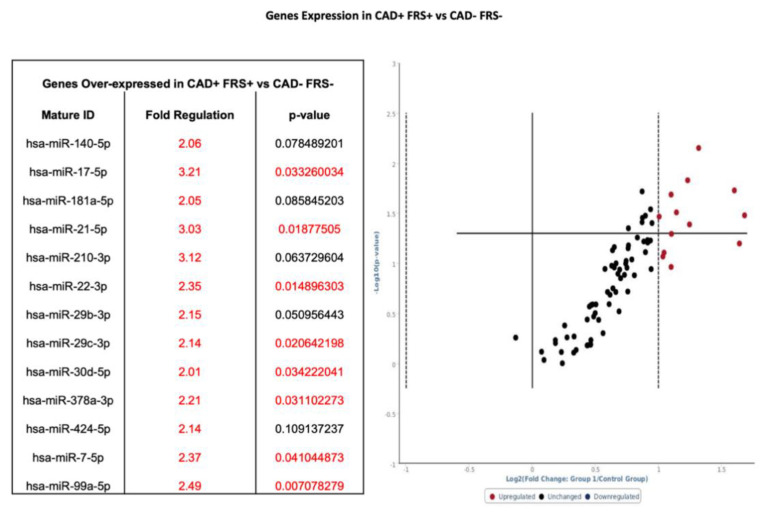
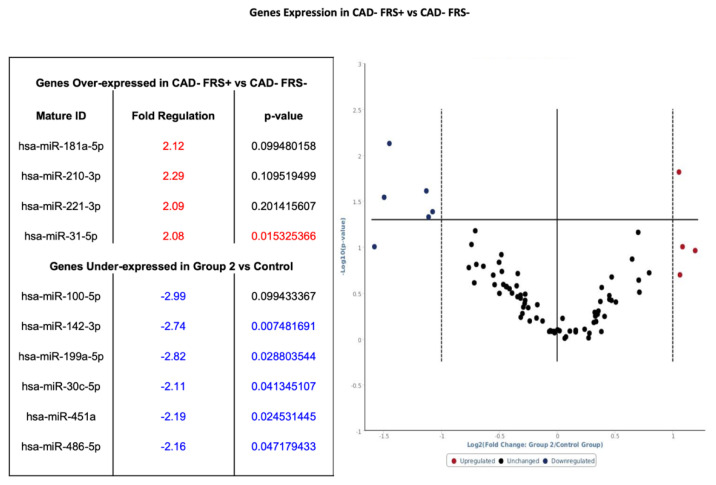
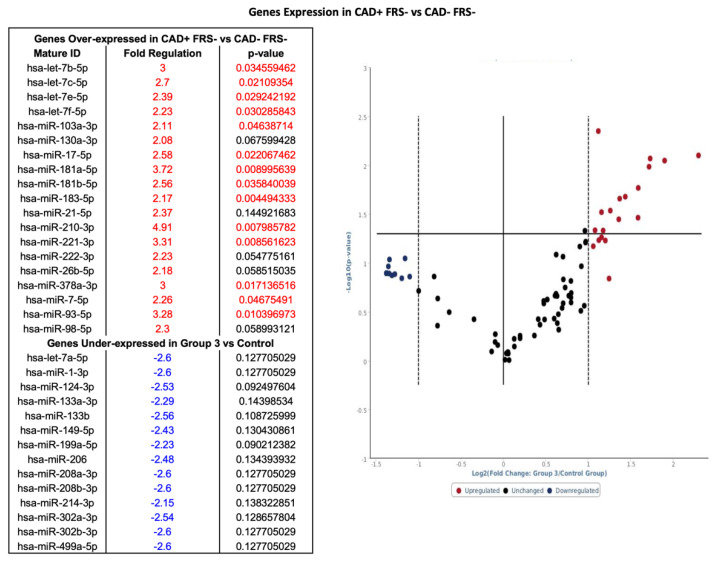
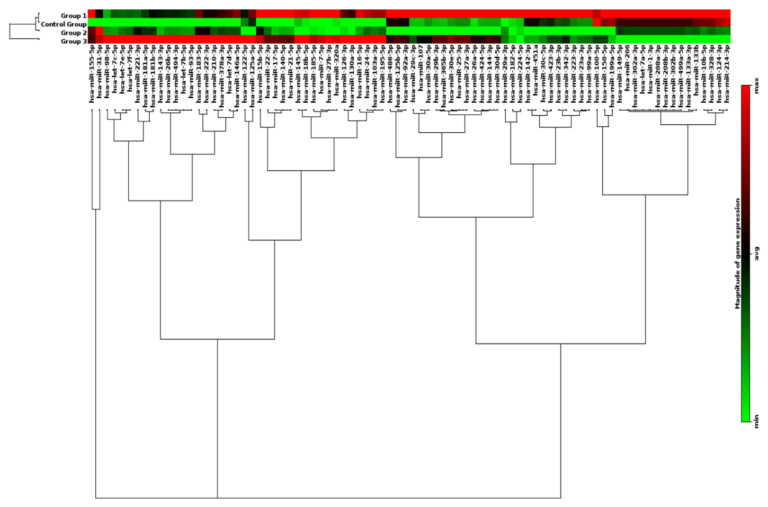
Early detection of asymptomatic coronary artery disease (CAD) is essential but underdeveloped. The aim of this study was to assess micro-RNA (miRNA) expression profiles in patients with or without CAD as selected by coronary CT angiography (CTA) and stratified by risk of CAD as determined by Framingham Risk Score (FRS). In this pilot study, patients were divided into two groups based on the presence or absence of CAD. Disease status was determined by Coronary CTA by identification of atherosclerosis and/or calcified plaque in coronary arteries. There were 16 control subjects and 16 subjects with documented CAD. Groups were then subdivided based on FRS. Pathway-specific microarray profiling of 86 genes using miRNAs isolated from whole peripheral blood was analyzed. MiRNA were differentially expressed in patients with and without CAD and who were stratified on the basis of FRS with miRNA associated with endothelial function, cardiomyocyte protection and inflammatory response (hsa-miR-17-5p, hsa-miR-21-5p, hsa-miR-210-3p, hsa-miR-29b-3p, hsa-miR-7-5p and hsa-miR-99a-5p) consistently upregulated by greater than twofold in groups with CAD. The present study reveals that miRNA expression patterns in whole blood as selected on the basis of coronary CTA and risk scores vary significantly depending on the subject phenotype. Thus, profiling miRNA may improve early detection of CAD.

Keywords: Framingham Risk Score; coronary CT angiography; coronary artery disease; early detection; micro RNA.


Conflict of interest statement

The authors declare no conflict of interest.

Figures

Figure 1
Figure 1
Diagram showing the 32 patients stratified on the basis of presence or absence of CAD (phase 1) and high or low FRS (Phase 2). CAD—Coronary Artery Disease. FRS—Framingham Risk Score.
Figure 2
Figure 2
Example of normal and disease coronary anatomy as depicted by coronary CTA and coronary angiogram. (A) Normal right coronary artery by coronary CTA. (B) Normal right coronary artery by coronary angiogram. (C) Focal Mixed calcified atherosclerotic plaque in the proximal left anterior descending artery as depicted by coronary CTA. (D) Sequential soft lipid and calcified plaque in the mid-to-proximal left anterior decending artery as depicted by coronary CTA. (E) Luminal irregularities involving the 2nd diagonal branch as depicted by coronary angiogram. (F) Focal luminal remodeling with mix soft lipid plaque and spotty calcifications. CTA—Computed Tomography Angiography.
Figure 3
Figure 3
Volcano plot with corresponding table showing the comparison of miRNA assessed by microarray (84 genes) isolated from patients with CAD (n = 16) versus healthy controls (n = 16). Designation of significance (RED) was given to samples with fold change >2. Samples with p values < 0.05 and fold change > 2 are found in the upper right quadrant. CAD—Coronary Artery Disease.
Figure 4
Figure 4
Volcano plot with corresponding table showing the comparison of miRNA assessed by microarray (84 genes) isolated from patients with CAD and FRS > 18 (n = 9) versus heathy controls without CAD and FRS < 5 (n = 9). Designation of significance (RED) was given to samples with fold change >2. Samples with p values < 0.05 and fold change >2 are found in the upper right quadrant. CAD—Coronary Artery Disease. FRS—Framingham Risk Score.
Figure 5
Figure 5
Volcano plot with corresponding table showing the comparison of miRNA assessed by microarray (84 genes) isolated from patients without CAD but FRS > 18 (n = 7) versus heathy controls without CAD and FRS < 5 (n = 9). Designation of significance (RED) was given to samples with fold increase >2 and (Blue) was given to samples with fold decrease >2. Samples with p values < 0.05 and fold change >2 are found in the upper right quadrant and upper left quadrant. CAD—Coronary Artery Disease. FRS—Framingham Risk Score.
Figure 6
Figure 6
Volcano plot with corresponding table showing the comparison of miRNA assessed by microarray (84 genes) isolated from patients with CAD and FRS < 5 (n = 7) versus heathy controls without CAD and FRS < 5 (n = 9). Designation of significance (RED) was given to samples with fold increase >2 and (Blue) was given to samples with fold decrease >2. Samples with p values < 0.05 and Figure 2. are found in the upper right quadrant and upper left quadrant. CAD—Coronary Artery Disease. FRS—Framingham Risk Score.
Figure 7
Figure 7
Profile of circulating miRNAs in CAD patients. MiRNA Heat Map illustrates differential expression between groups stratified by the presence or absence of CAD and risk assessment by FRS. Color intensity is scaled within each row such that the highest expression value corresponds to bright red, and lowest to bright green. CAD—Coronary Artery Disease. FRS—Framingham Risk Score.

References

    1. Roger V.L., Go A.S., Lloyd-Jones D.M., Benjamin E.J., Berry J.D., Borden W.B., Bravata D.M., Dai S., Ford E.S., Fox C.S., et al. Heart Disease and Stroke Statistics-2012 Update. A Report from the American Heart Association. Circulation. 2012;125:e2. - PMC - PubMed
    1. Celermajer D.S., Chow C.K., Marijon E., Anstey N.M., Woo K.S. Cardiovascular Disease in the Developing World. Prevalences, Patterns, and the Potential of Early Disease Detection. J. Am. Coll. Cardiol. 2012;60:1207–1216. doi: 10.1016/j.jacc.2012.03.074. - DOI - PubMed
    1. Faxon D.P., Fuster V., Libby P., Beckman J.A., Hiatt W.R., Thompson R.W., Topper J.N., Annex B.H., Rundback J.H., Fabunmi R.P., et al. Atherosclerotic Vascular Disease Conference. Writing Group III: Pathophysiology. Circulation. 2004;109:2617–2625. doi: 10.1161/01.CIR.0000128520.37674.EF. - DOI - PubMed
    1. Fihn S.D., Gardin J.M., Abrams J., Berra K., Blankenship J.C., Dallas A.P., Douglas P.S., Foody J.M., Gerber T.C., Hinderliter A.L., et al. 2012 ACCF/AHA/ACP/AATS/PCNA/SCAI/STS Guideline for the Diagnosis and Management of Patients with Stable Ischemic Heart Disease. J. Am. Coll. Cardiol. 2012;60:e44–e164. doi: 10.1016/j.jacc.2012.07.013. - DOI - PubMed
    1. Gibbons R.J. ACC/AHA 2002 Guideline Update for Exercise Testing: Summary Article: A Report of the American College of Cardiology/American Heart Association Task Force on Practice Guidelines (Committee to Update the 1997 Exercise Testing Guidelines) Circulation. 2002;106:1883–1892. - PubMed

LinkOut - more resources