. 2020 Oct 28;9(11):365.
doi: 10.3390/biology9110365.

Amino Acid k-mer Feature Extraction for Quantitative Antimicrobial Resistance (AMR) Prediction by Machine Learning and Model Interpretation for Biological Insights

Affiliations

Amino Acid k-mer Feature Extraction for Quantitative Antimicrobial Resistance (AMR) Prediction by Machine Learning and Model Interpretation for Biological Insights

Taha ValizadehAslani et al. Biology (Basel). .

Abstract

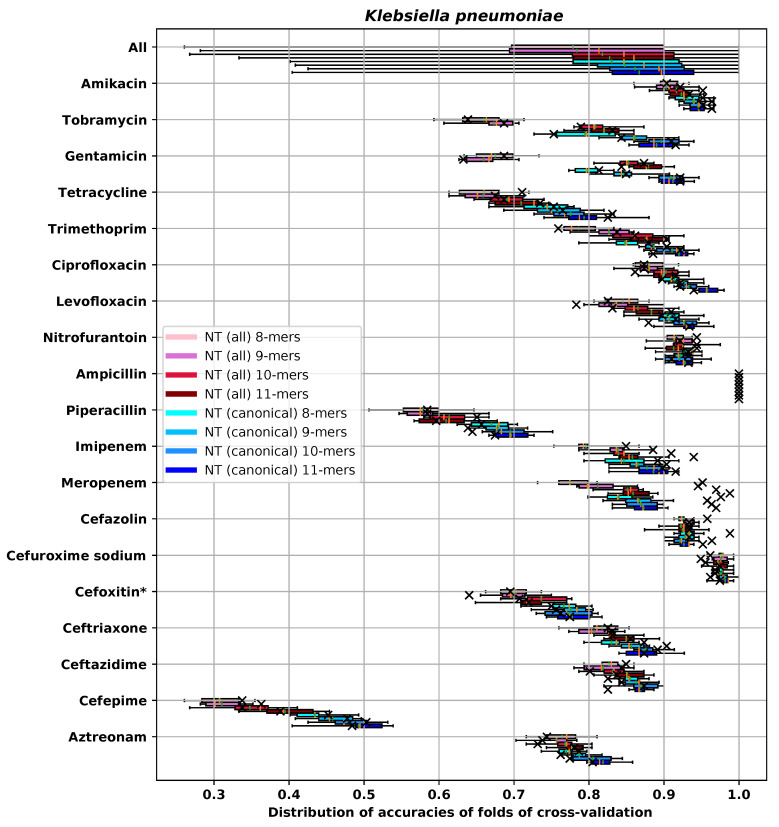
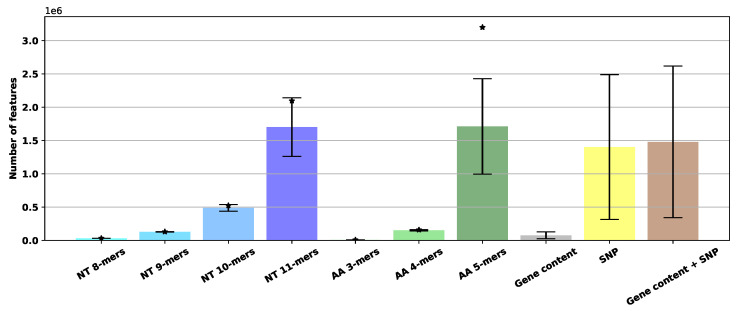
Machine learning algorithms can learn mechanisms of antimicrobial resistance from the data of DNA sequence without any a priori information. Interpreting a trained machine learning algorithm can be exploited for validating the model and obtaining new information about resistance mechanisms. Different feature extraction methods, such as SNP calling and counting nucleotide k-mers have been proposed for presenting DNA sequences to the model. However, there are trade-offs between interpretability, computational complexity and accuracy for different feature extraction methods. In this study, we have proposed a new feature extraction method, counting amino acid k-mers or oligopeptides, which provides easier model interpretation compared to counting nucleotide k-mers and reaches the same or even better accuracy in comparison with different methods. Additionally, we have trained machine learning algorithms using different feature extraction methods and compared the results in terms of accuracy, model interpretability and computational complexity. We have built a new feature selection pipeline for extraction of important features so that new AMR determinants can be discovered by analyzing these features. This pipeline allows the construction of models that only use a small number of features and can predict resistance accurately.

Keywords: SNP; amino acid; antimicrobial resistance; gene clustering; genome sequencing; k-mer counting; machine learning; nucleotide.


Conflict of interest statement

The authors declare no conflict of interest. The funders had no role in the design of the study; in the collection, analyses, or interpretation of data; in the writing of the manuscript, or in the decision to publish the results.

Figures

Figure A1
Figure A1
Distribution of C. jejuni MIC values for different antibiotics. These are the values after processing and conversion to log2 scale. The antibiotic’s name is printed on the title of each sub-figure. The number of genomes is presented in parentheses.
Figure A2
Figure A2
Distribution of N. gonorrhoeae MIC values for different antibiotics. These are the values after processing and conversion to log2 scale. The antibiotic’s name is printed on the title of each sub-figure. The number of genomes is presented in parentheses.
Figure A3
Figure A3
Distribution of K. pneumoniae MIC values for different antibiotics. These are the values after processing and conversion to log2 scale. The antibiotic’s name is printed on the title of each sub-figure. The number of genomes is presented in parentheses.
Figure A4
Figure A4
Distribution of S. enterica MIC values for different antibiotics. These are the values after processing and conversion to log2 scale. The antibiotic’s name is printed on the title of each sub-figure. The number of genomes is presented in parentheses.
Figure A5
Figure A5
Violin plots of performances of different methods in predicting MIC of tetracycline for C. jejuni. X-axis is the actual value and y-axis is the predicted value. Each violin shows the kernel density estimation distribution of predictions for one MIC actual target value. Below each violin, the ±1 two-fold dilution accuracy of that target value is mentioned, and below that, the number of strains with that target value is mentioned in parentheses. The green line represents the perfect prediction and the yellow line represents the first order regression between the actual values and predicted values. The red lines represent the limits of the perfect predictions’s ±1 two-fold dilution. (a) NT 11-mers, (b) AA-5mers, (c) gene content, (d) SNP, (e) gene content + SNP.
Figure A6
Figure A6
Violin plots of performances of different methods in predicting MIC of nalidixic acid for C. jejuni. X-axis is the actual value and y-axis is the predicted value. Each violin shows the kernel density estimation distribution of predictions for one target value. Below each violin, the ±1 two-fold dilution accuracy of that target value is mentioned, and below that, the number of strains with that target value is mentioned in parentheses. The green line represents the perfect prediction and the yellow line represents the first order regression between the actual values and predicted values. The red lines represent the limits of ±1 two-fold dilution. (a) NT 8-mers, (b) NT 11-mers, (c) AA-3mers, (d) AA-5mers, (e) gene content, (f) SNP, (g) gene content + SNP.
Figure A7
Figure A7
C. jejuni and nalidixic acid. Amino acid 5-mers. Violin plots of performance using only one 5-mer (“GDTAV”). X-axis is the actual value and y-axis is the predicted value. Each violin shows the kernel density estimation distribution of predictions for one target value. Below each violin, the ±1 two-fold dilution accuracy of that target value is mentioned, and below that, the number of strains with that target value is mentioned in parentheses. The green line represents the perfect prediction and the yellow line represents the first order regression between the actual values and predicted values. The red lines represent the limits of ±1 two-fold dilution.
Figure A8
Figure A8
Distribution of accuracies in different nucleotide k-mers for C. jejuni. Plots are similar to Figure 5.
Figure A9
Figure A9
Distribution of accuracies in different nucleotide k-mers for N. gonorrhoeae. Plots are similar to Figure 5.
Figure A10
Figure A10
Distribution of accuracies in different nucleotide k-mers for K. pneumoniae. Plots are similar to Figure 5.
Figure A11
Figure A11
Distribution of accuracies in different nucleotide k-mers for S. enterica. Plots are similar to Figure 5.
Figure A12
Figure A12
Distribution of correlation coefficient between the frequencies of canonical and non-canonical features, when both frequencies are counted separately across the genomes for different microbes and different k-mer lengths. In each box plot, the whiskers represents the maximum and minimum. The boxes represent the first and the third quartiles. The orange line represents the median and the green line represents the mean.
Figure 1
Figure 1
Overall pipeline for all feature extraction methods.
Figure 2
Figure 2
Overall pipeline: First, a hold-out set is separated for the final evaluation. Then for each microbe and each feature extraction method, hyper-parameter tuning is done on one antibiotic with 5 folds of cross-validation, which results in 5 different sets of hyper-parameters in the end. The parameter set that minimizes the RMSE is chosen for 2 experiments: Cross-validation using 10 folds, and a final evaluation on the hold-out set.
Figure 3
Figure 3
Average and standard deviation of number of features for each method across all species. An asterisk indicates the maximum theoretically possible number of k-mer features, where applicable.
Figure 4
Figure 4
Comparison of ±1 two-fold dilution accuracy of regressors in 10 folds of cross-validation on predicting MIC of ampicillin for Salmonella enterica with 4-mers of amino acid. In each box plot, the whiskers represent the maximum and minimum. The boxes represent the first and the third quartiles. The orange line represents the median and the green dashed line represents the mean.
Figure 5
Figure 5
Distribution of ±1 two-fold dilution accuracies in different methods for Campylobacter jejuni. The box plots are similar to Figure 4. The orange line represents the median and the green line represents the mean. The × marks represent the accuracy of the hold-out set. The antibiotic used for hyper-parameter tuning is indicated by an asterisk. For each method, the top boxes, labeled as “All,” were obtained by combining all ten folds for all antibiotics.
Figure 6
Figure 6
Distribution of ±1 two-fold dilution accuracies in different methods for Neisseria gonorrhoeae. Plots are similar to Figure 5.
Figure 7
Figure 7
Distribution of ±1 two-fold dilution accuracies in different methods for Klebsiella pneumoniae. Plots are similar to Figure 5.
Figure 8
Figure 8
Distribution of ±1 two-fold dilution accuracies in different methods for S. enterica. Plots are similar to Figure 5.
Figure 9
Figure 9
Change in average accuracy of cross-validation when different numbers of features are included in the selected-feature pipeline. (a): C. jejuni and nalidixic acid, amino acid 5-mers; (b): K. pneumoniae and imipenem, amino acid 5-mers; (c): S. enterica and trimethoprim–sulfamethoxazole, amino acid 5-mer; (d): S. enterica and trimethoprim–sulfamethoxazole, nucleotide 11-mers; (e): S. enterica and ampicillin, gene content; (f): S. enterica and amoxicillin clavulanic acid, gene content.

References

    1. Cassini A., Högberg L.D., Plachouras D., Quattrocchi A., Hoxha A., Simonsen G.S., Colomb-Cotinat M., Kretzschmar M.E., Devleesschauwer B., Cecchini M., et al. Attributable deaths and disability-adjusted life-years caused by infections with antibiotic-resistant bacteria in the EU and the European Economic Area in 2015: A population-level modelling analysis. Lancet Infect. Dis. 2019;19:56–66. doi: 10.1016/S1473-3099(18)30605-4. - DOI - PMC - PubMed
    1. Walker B., Barrett S., Polasky S., Galaz V., Folke C., Engstrom G., Ackerman F., Arrow K., Carpenter S., Chopra K., et al. Looming Global-Scale Failures and Missing Institutions. Science. 2009;325:1345–1346. doi: 10.1126/science.1175325. - DOI - PubMed
    1. Aslam B., Wang W., Arshad M.I., Khurshid M., Muzammil S., Rasool M.H., Nisar M.A., Alvi R.F., Aslam M.A., Qamar M.U., et al. Antibiotic resistance: A rundown of a global crisis. Infect. Drug Resist. 2018;11:1645–1658. doi: 10.2147/IDR.S173867. - DOI - PMC - PubMed
    1. Hoffman S.J., Caleo G.M., Daulaire N., Elbe S., Matsoso P., Mossialos E., Rizvi Z., Røttingen J.A. Strategies for achieving global collective action on antimicrobial resistance. Bull. World Health Organ. 2015;93:867–876. doi: 10.2471/BLT.15.153171. - DOI - PMC - PubMed
    1. Spellberg B., Srinivasan A., Chambers H.F. New Societal Approaches to Empowering Antibiotic Stewardship. JAMA. 2016;315:1229. doi: 10.1001/jama.2016.1346. - DOI - PMC - PubMed

LinkOut - more resources