. 2020 Oct 28;21(21):8033.
doi: 10.3390/ijms21218033.

Effect of Mechanical Shaking on the Physicochemical Properties of Aqueous Solutions

Affiliations

Effect of Mechanical Shaking on the Physicochemical Properties of Aqueous Solutions

Sergey V Gudkov et al. Int J Mol Sci. .

Abstract

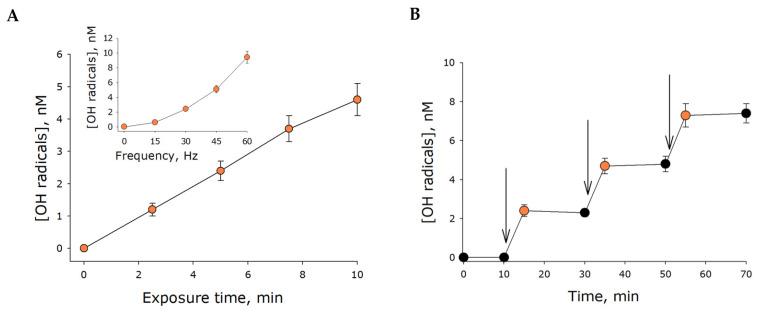
Long-lived luminescence in the blue region was found to occur in deionized water saturated with atmospheric gases following mechanical shaking. Luminescence intensity decreased exponentially after the cessation of stress. During vigorous mechanical shaking, we observed gas bubbles in solution, and the liquid-gas interface area increased noticeably. At the same time, the concentration of molecular oxygen decreased, which could not be attributed to the water warming up with exposure to mechanical stress. However, deaerated water rapidly became saturated with gases following mechanical stress. The recommendation that cell culture media should be mixed after they are removed from the fridge in order to allow saturation with oxygen is probably misleading. It was shown that gases existed in water both in the form of individual molecules and nanobubbles. Mechanical stress did not influence the number or size of nanobubbles. While gas nanobubbles were absent in freshly prepared deaerated water, they appeared following exposure to mechanical stress. In addition, in mechanically treated gas-saturated water, there was seemingly an equilibrium shift towards the decomposition of carbonic acid to water and carbon dioxide. At the same time, the pH of water tended to increase immediately after mechanical stress. It was demonstrated that reactive oxygen species (ROS) form in gas-saturated water under mechanical stress (30 Hz, amplitude of 5 mm). The relative generation rate of hydrogen peroxide and of the hydroxyl radical was 1 nM/min and 0.5 nM/min, respectively. It was found that with an increase in the frequency of mechanical action (f), the rate of ROS generation increased in proportion to f 2. The major pathways for hydrogen peroxide generation are probably associated with the formation of singlet oxygen and its further reduction, and the alternative pathway is the formation of hydrogen peroxide as a result of hydroxyl radical recombination.

Keywords: long-lived luminescence; molecular oxygen; nanobubbles; reactive oxygen species; shaking; water.


Conflict of interest statement

The authors declare no conflict of interest.

Figures

Figure 1
Figure 1
The effect of mechanical stress (30 Hz, amplitude of 5 mm, for 5 min) on intrinsic water luminescence (A) and gaseous phase distribution (B). The photograph was taken shortly after the mechanical treatment.
Figure 2
Figure 2
The effect of mechanical stress (30 Hz, amplitude of 5 mm) on molecular oxygen concentration in water (A) and water temperature (B). The insert to figure (A) displays the effect of frequency of mechanical stress on the test parameter (exposure time 5 min). The data are presented as the mean and standard error of the mean for six independent assays. Data differ significantly from control values (0 min) at p < 0.05 (*).
Figure 3
Figure 3
The effect of mechanical stress (30 Hz, 5 mm amplitude) on light scattering intensity (A) and hydrodynamic diameter (B) of nanosized gas bubbles. The shaded area represents the parameters of the control (gas-saturated water before mechanical treatment). The data are presented as the mean and standard error of the mean for six independent assays. Data differ significantly from control values at p < 0.05 (*).
Figure 4
Figure 4
The effect of mechanical stress (30 Hz, 5 mm amplitude) on water pH. (A) The effect of exposure time on pH. The insert displays the effect of frequency of mechanical stress on the test parameter (amplitude of 5 mm, exposure time of 5 min). The measurements were made immediately after stress exposure. (B) Changes of pH observed for several days post-exposure. The shaded area represents the parameters of water before mechanical treatment (control). The data are presented as the mean and standard error of the mean for six independent experiments. Data differ significantly from control values at p < 0.05 (*).
Figure 5
Figure 5
The effect of mechanical stress on hydrogen peroxide concentration in water. (A) The effect of frequency of mechanical stress on hydrogen peroxide concentration (amplitude of 5 mm, exposure time of 5 min). The insert displays the effect of exposure time on hydrogen peroxide concentration (30 Hz, amplitude of 5 mm). (B) Changes in hydrogen peroxide concentration following multiple mechanical stresses. The time of a single exposure was 5 min, with the frequency and amplitude of 30 Hz and 5 mm, respectively. The intervals during which mechanical stress was applied are indicated with vertical errors. The data are presented as the mean and standard error of the mean for six independent assays. Data differ significantly from control values at p < 0.05 (*).
Figure 6
Figure 6
Hydroxyl radical generation in water under mechanical stress (30 Hz, amplitude of 5 mm). (A) The effect of exposure time on hydroxyl radical concentration. The insert displays the effect of frequency of mechanical stress on hydroxyl radical concentration (amplitude of 5 mm, exposure time of 5 min). (B) Changes in hydrogen peroxide concentration following multiple mechanical stresses. The time of a single exposure was 5 min, with the frequency and amplitude of 30 Hz and 5 mm, respectively. The intervals during which mechanical stress was applied are indicated with vertical errors. The data are presented as the mean and standard error of the mean for six independent assays.

References

    1. Metreveli G., Philippe A., Schaumann G.E. Disaggregation of silver nanoparticle homoaggregates in a river water matrix. Sci. Total Environ. 2015;535:35–44. doi: 10.1016/j.scitotenv.2014.11.058. - DOI - PubMed
    1. Bunkin N.F., Shkirin A.V., Ninham B.W., Chirikov S.N., Chaikov L.L., Penkov N.V., Kozlov V.A., Gudkov S.V. Shaking-induced aggregation and flotation in immunoglobulin dispersions: Differences between water and water-ethanol mixtures. ACS Omega. 2020;5:14689–14701. doi: 10.1021/acsomega.0c01444. - DOI - PMC - PubMed
    1. Bull H.B. Protein denaturation. Cold Spring Harb. Symp. Quant. Biol. 1938;6:140–149. doi: 10.1101/SQB.1938.006.01.015. - DOI
    1. Basu S.N., Pal P.N. An Unfavourable Effect of Shaking on Fungal Cellulases. Nature. 1956;178:312–313. doi: 10.1038/178312b0. - DOI - PubMed
    1. Kiese S., Papppenberger A., Friess W., Mahler Shaken H.K. Mechanical stress testing of an IgG1 antibody. J. Pharm. Sci. 2008;97:4347–4366. doi: 10.1002/jps.21328. - DOI - PubMed

MeSH terms

LinkOut - more resources