

Comparison of spatiotemporal characteristics of the COVID-19 and SARS outbreaks in mainland China
- PMID: 33126857
- PMCID: PMC7598229
- DOI: 10.1186/s12879-020-05537-y
Comparison of spatiotemporal characteristics of the COVID-19 and SARS outbreaks in mainland China
Abstract
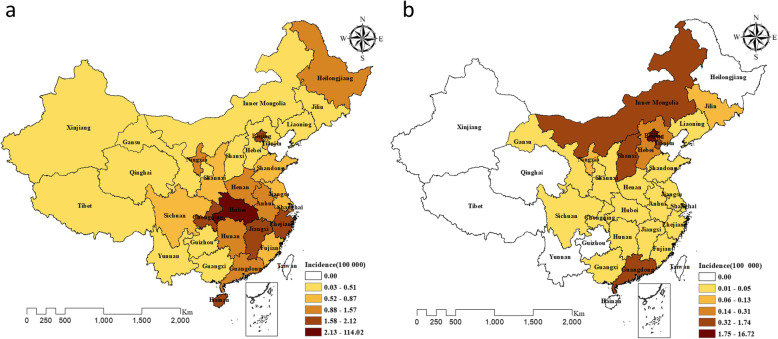
Background: Both coronavirus disease 2019 (COVID-19) and severe acute respiratory syndrome (SARS) are caused by coronaviruses and have infected people in China and worldwide. We aimed to investigate whether COVID-19 and SARS exhibited similar spatial and temporal features at provincial level in mainland China.
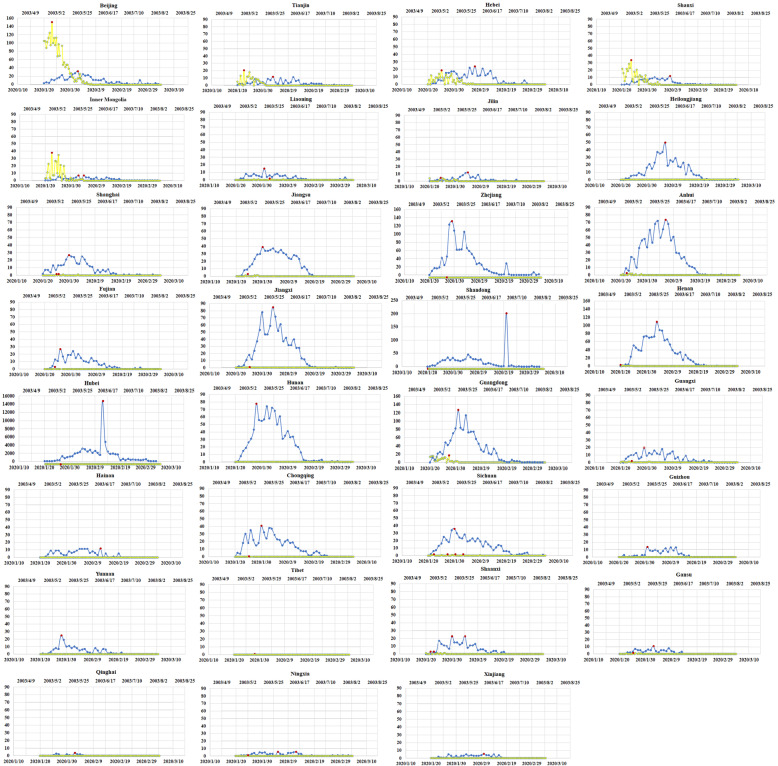
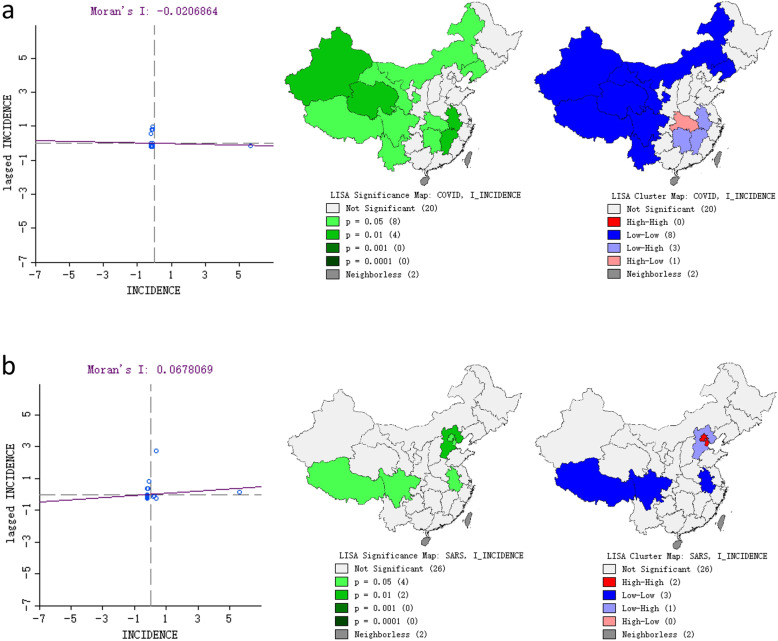
Methods: The number of people infected by COVID-19 and SARS were extracted from daily briefings on newly confirmed cases during the epidemics, as of Mar. 4, 2020 and Aug. 3, 2003, respectively. We depicted spatiotemporal patterns of the COVID-19 and SARS epidemics using spatial statistics such as Moran's I and the local indicators of spatial association (LISA).
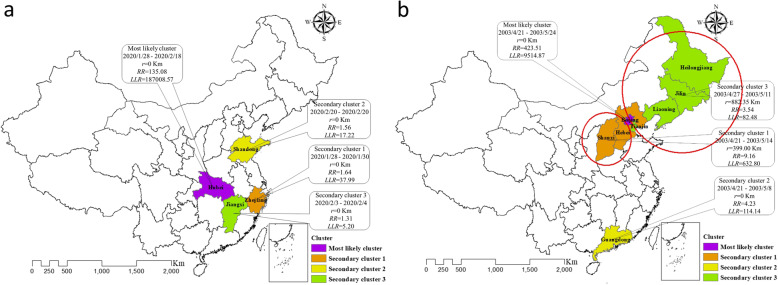
Results: Compared to SARS, COVID-19 had a higher overall incidence. We identified 3 clusters (predominantly located in south-central China; the highest RR = 135.08, 95% CI: 128.36-142.08) for COVID-19 and 4 clusters (mainly in Northern China; the highest RR = 423.51, 95% CI: 240.96-722.32) for SARS. Fewer secondary clusters were identified after the "Wuhan lockdown". The LISA cluster map detected a significantly high-low (Hubei) and low-high spatial clustering (Anhui, Hunan, and Jiangxi, in Central China) for COVID-19. Two significant high-high (Beijing and Tianjin) and low-high (Hebei) clusters were detected for SARS.
Conclusions: COVID-19 and SARS outbreaks exhibited distinct spatiotemporal clustering patterns at the provincial levels in mainland China, which may be attributable to changes in social and demographic factors, local government containment strategies or differences in transmission mechanisms.
Keywords: COVID-19; Coronavirus; Epidemic; SARS; Spatial clustering.
Conflict of interest statement
The authors declare that they have no conflicts of interest.
Figures
References
-
- Daily briefing on novel coronavirus cases in China. http://en.nhc.gov.cn/2020-03/05/c_77309.htm. (Accessed 20 Mar 2020).
-
- Wu Z, McGoogan JM. Characteristics of and Important Lessons From the Coronavirus Disease 2019 (COVID-19) Outbreak in China: Summary of a Report of 72314 Cases From the Chinese Center for Disease Control and Prevention. [published online ahead of print, 2020 Feb 24. JAMA. 2020. - PubMed
-
- Natsuko Imai, Anne Cori, Ilaria Dorigatti, et al. Report 3: Transmissibility of 2019-nCoV. https://www.imperial.ac.uk/mrc-global-infectious-disease-analysis/news%2.... (Accessed 10 Mar 2020).
-
- Daily briefings. National Health Commission of the People's Republic of China. http://wwsw.nhc.gov.cn/xcs/yqtb/list_gzbd.shtml. (Accessed 20 Mar 2020). - PMC - PubMed
Publication types
MeSH terms
LinkOut - more resources
Full Text Sources
Miscellaneous
