. 2020 Oct 30;13(1):64.
doi: 10.1186/s13047-020-00431-x.

Correlations between weight-bearing 3D bone architecture and dynamic plantar pressure measurements in the diabetic foot

Affiliations

Correlations between weight-bearing 3D bone architecture and dynamic plantar pressure measurements in the diabetic foot

Claudio Belvedere et al. J Foot Ankle Res. .

Abstract

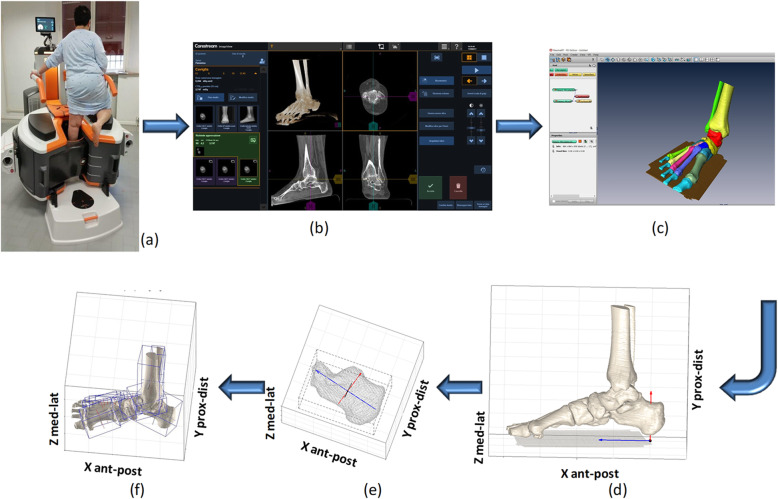
Background: Measurements of plantar loading reveal foot-to-floor interaction during activity, but information on bone architecture cannot be derived. Recently, cone-beam computer tomography (CBCT) has given visual access to skeletal structures in weight-bearing. The combination of the two measures has the potential to improve clinical understanding and prevention of diabetic foot ulcers. This study explores the correlations between static 3D bone alignment and dynamic plantar loading.

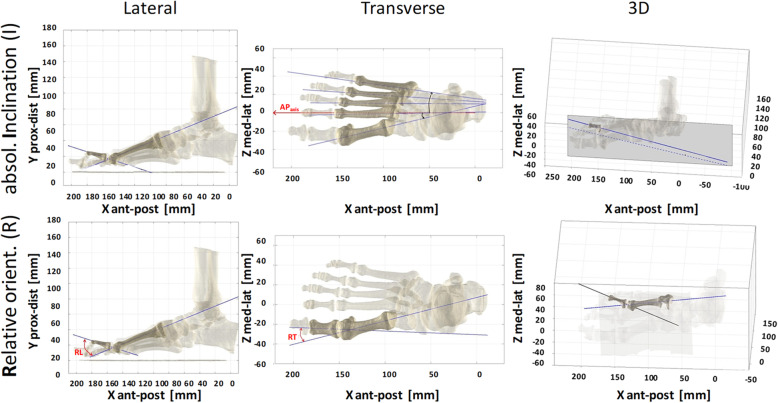
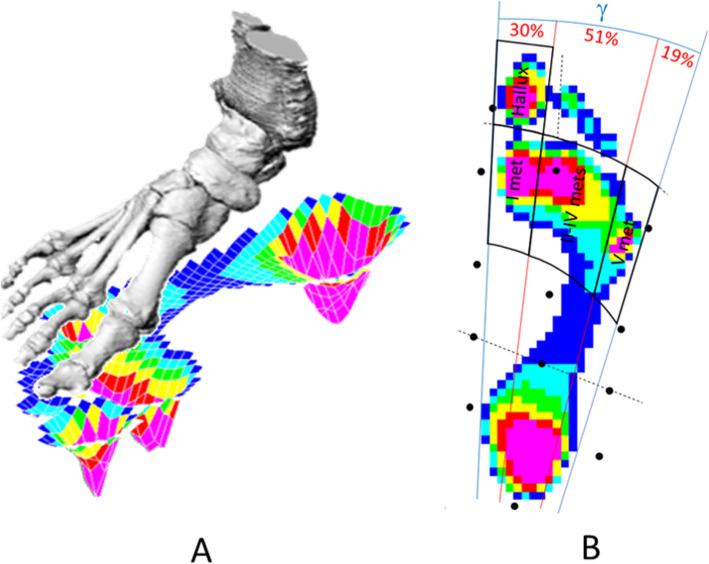
Methods: Sixteen patients with diabetes were enrolled (group ALL): 15 type 1 with (N, 7) and without (D, 8) diabetic neuropathy, and 1 with latent autoimmune diabetes. CBCT foot scans were taken in single-leg upright posture. 3D bone models were obtained by image segmentation and aligned in a foot anatomical reference frame. Absolute inclination and relative orientation angles and heights of the bones were calculated. Pressure patterns were also acquired during barefoot level walking at self-selected speed, from which regional peak pressure and absolute and normalised pressure-time integral were worked out at hallux and at first, central and fifth metatarsals (LOAD variables) as averaged over five trials. Correlations with 3D alignments were searched also with arch index, contact time, age, BMI, years of disease and a neuropathy-related variable.

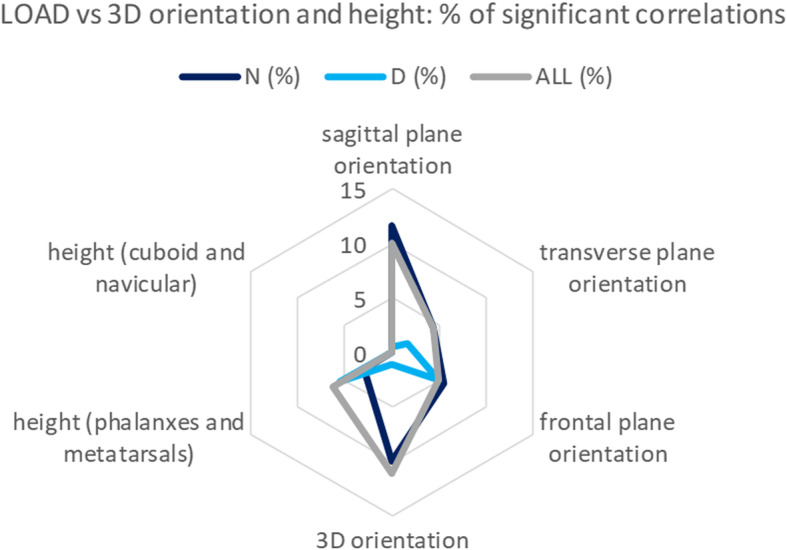
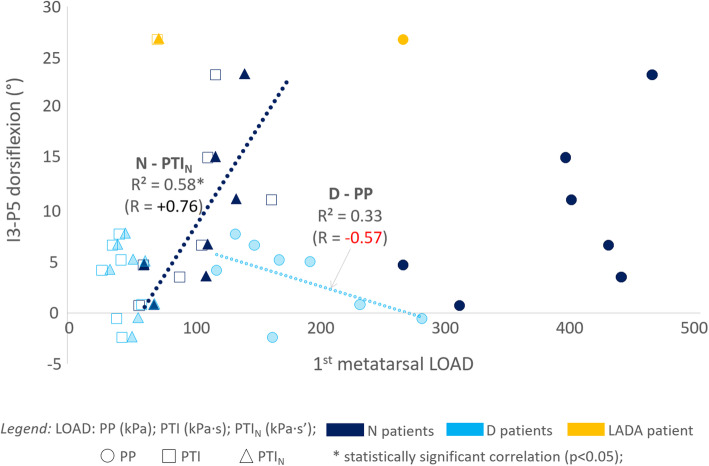
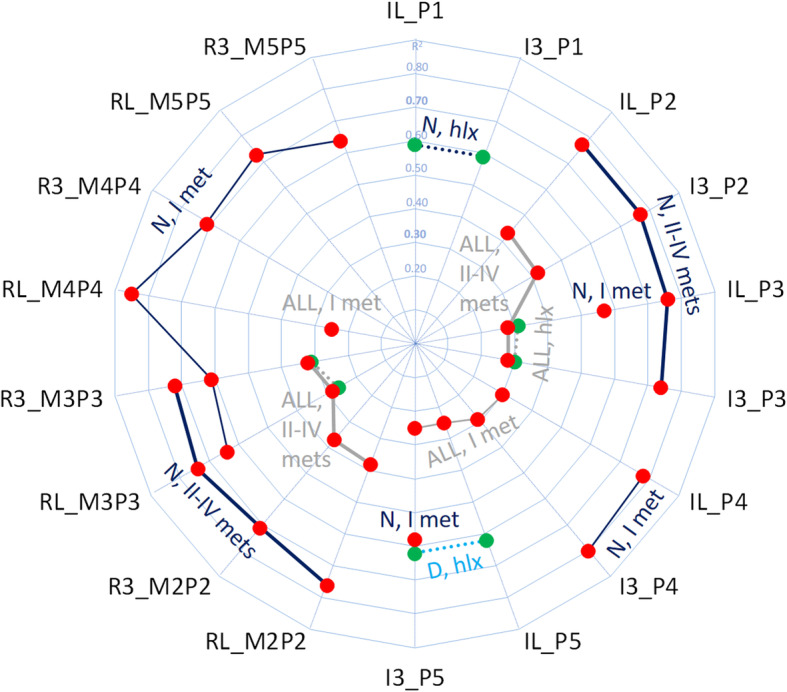
Results: Lateral and 3D angles showed the highest percentage of significant (p < 0.05) correlations with LOAD. These were weak-to-moderate in the ALL group, moderate-to-strong in N and D. LOAD under the central metatarsals showed moderate-to-strong correlation with plantarflexion of the 2nd and 3rd phalanxes in ALL and N. LOAD at the hallux increased with plantarflexion at the 3rd phalanx in ALL, at 1st phalanx in N and at 5th phalanx in D. Arch index correlated with 1st phalanx plantarflexion in ALL and D; contact time showed strong correlation with 2nd and 3rd metatarsals and with 4th phalanx dorsiflexion in D.

Conclusion: These preliminary original measures reveal that alteration of plantar dynamic loading patterns can be accounted for peculiar structural changes of foot bones. Load under the central metatarsal heads were correlated more with inclination of the corresponding phalanxes than metatarsals. Further analyses shall detect to which extent variables play a role in the many group-specific correlations.

Keywords: Bone positions and orientations; Cone-beam weight-bearing computed tomography; Diabetic foot; Dynamic plantar loading; Foot bone models; Principal component analysis.


Conflict of interest statement

All authors declare that there are no personal or commercial relationships related to this work that would lead to a conflict of interest.

Figures

Fig. 1
Fig. 1
Pictures representing the process from CBCT scans to the embedded bone reference frames. Pictures representing the process from CBCT scans to the embedded bone reference frames, through the definitions of 3D models of the bone surface. The patient in single-leg weight-bearing during the CBCT scan (a). The 3D data-set including volume rendering available at the interactive screen (b). The result of the process of bone segmentation (Amira): all foot and ankle bone segments were modeled separately (different colors), and the ground segment is also identified and depicted (c). The overall bone models in the foot anatomical reference frame, here in a nearly lateral view (d). Construction of the three anatomical axes by means of the PCA technique, an exemplary application to the calcaneus model; the origin at the centroid of the bone model and the three corresponding co-ordinate axes are depicted (e). The same, for all foot bone models (f)
Fig. 2
Fig. 2
Diagrams from an exemplary foot model. Diagrams from an exemplary foot model of the absolute inclination (top row) and relative orientation (bottom), in the lateral (left column) and transverse (central) projections, and in 3D (right), according to the foot anatomical reference frame (see also Fig. 1d). Longitudinal axes of a few exemplary bones and their inclination and orientation angles are depicted
Fig. 3
Fig. 3
Diagrams representing the present measurements. a Diagrammatic representation in 3D of the combination of the full foot bone model (above) registered on the corresponding pressure footprint (below). b Subdivision of the footprint (from the same patient) in the four forefoot regions (thicker black lines); the overall angle of the footprint (γ) is divided in three arcs (red lines), and the projection of the anatomical markers of the foot are also shown (black points)
Fig. 4
Fig. 4
Radar plot of the number of significant correlations. Radar plot of the number of significant correlations (%) between dynamic plantar loading (the LOAD variables PP, PTI and PTIN) at the four forefoot regions (HLX, I MET, II-IV METs and V MET) and all the 3D variables. The latter are grouped as angles in the lateral (180 correlations per patients’ group), transverse (180 correlations), and frontal (180 correlations) planes, and in 3D (180 correlations), height of forefoot (phalanxes and metatarsals, 240 correlations) and of midfoot (cuboid and navicular, 48 correlations) bones. Correlations are plotted for the group of all patients (ALL) and for the neuropathic (N) and non-neuropathic (D) type 1 subgroups
Fig. 5
Fig. 5
Scatter plot for a phalanx 3D inclination with respect to LOAD changes. Scatter plot for the 3D inclination angle, i.e. dorsiflexion of the 5th phalanx (I3-P5), with respect to changes of the LOAD variables (PP, PTI and PTIN) at the I metatarsal region for N (dark blue) and D (light blue) sub-groups separately, and for the LADA patient (orange). Within each group, the regression line is drawn for the LOAD variable with the highest correlation, i.e. PTIN in N and PP in D
Fig. 6
Fig. 6
Radar plot of correlations between LOAD and 3D variables. Radar plot of the Pearson coefficients (R2) between LOAD and those 3D variables found significantly (p < 0.05) correlated. Corresponding lateral and 3D angles are reported sequentially to better detect relevant similar figures. LOAD correlations with dorsiflexion are marked in red, with plantarflexion in green. Correlations are referred to either the whole sample of patients (ALL, in grey), or to N (dark blue) or D (light blue) sub-groups. Line segments are used to highlight adjacent relevant results for the same variable of the same group: dotted lines represent the HLX region, thin solid lines represent the I MET region, and thick solid lines represent the II-IV METs region (V MET region did not show significant correlations). Correlations with R2 up to 0.30 were interpreted as weak, in between 0.30 and 0.70 as moderate, above 0.70 as strong

Similar articles

Cited by

References

    1. The International Diabetes Federation (IDF) IDF diabetes atlas. 9 2019. - PubMed
    1. Zhang P, Lu J, Jing Y, Tang S, Zhu D, Bi Y. Global epidemiology of diabetic foot ulceration: a systematic review and meta-analysis (dagger) Ann Med. 2017;49(2):106–116. doi: 10.1080/07853890.2016.1231932. - DOI - PubMed
    1. Carro GV, Saurral R, Saguez FS, Witman EL. Diabetic foot among hospitalized patients in Latin America. Medicina (B Aires) 2018;78(4):243–251. - PubMed
    1. Cavanagh P, Attinger C, Abbas Z, Bal A, Rojas N, Xu ZR. Cost of treating diabetic foot ulcers in five different countries. Diabetes Metab Res Rev. 2012;28(Suppl 1):107–111. doi: 10.1002/dmrr.2245. - DOI - PubMed
    1. Sawacha Z, Cristoferi G, Guarneri G, Corazza S, Dona G, Denti P, et al. Characterizing multisegment foot kinematics during gait in diabetic foot patients. J Neuroeng Rehabil. 2009;6:37. doi: 10.1186/1743-0003-6-37. - DOI - PMC - PubMed

MeSH terms