. 2020 Oct 30;6(44):eabb9200.
doi: 10.1126/sciadv.abb9200. Print 2020 Oct.

ACSL3-PAI-1 signaling axis mediates tumor-stroma cross-talk promoting pancreatic cancer progression

Affiliations

ACSL3-PAI-1 signaling axis mediates tumor-stroma cross-talk promoting pancreatic cancer progression

Matteo Rossi Sebastiano et al. Sci Adv. .

Abstract

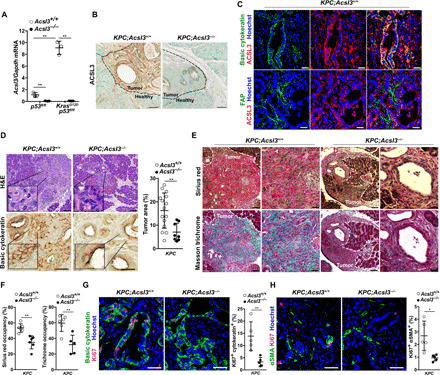
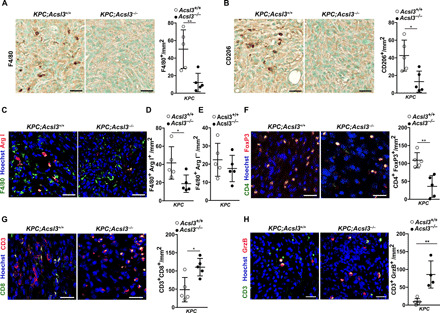
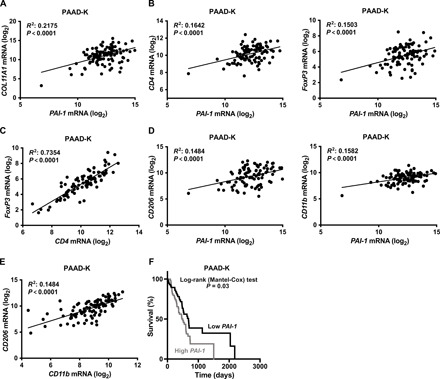
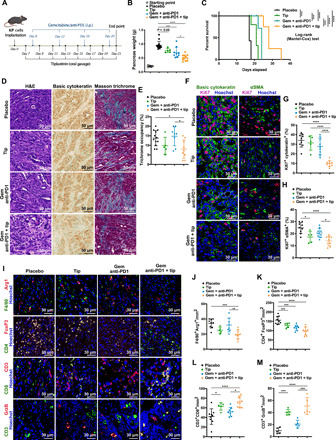
Pancreatic ductal adenocarcinoma (PDAC) is characterized by marked fibrosis and low immunogenicity, features that are linked to treatment resistance and poor clinical outcomes. Therefore, understanding how PDAC regulates the desmoplastic and immune stromal components is of great clinical importance. We found that acyl-CoA synthetase long-chain 3 (ACSL3) is up-regulated in PDAC and correlates with increased fibrosis. Our in vivo results show that Acsl3 knockout hinders PDAC progression, markedly reduces tumor fibrosis and tumor-infiltrating immunosuppressive cells, and increases cytotoxic T cell infiltration. This effect is, at least in part, due to decreased plasminogen activator inhibitor-1 (PAI-1) secretion from tumor cells. Accordingly, PAI-1 expression in PDAC positively correlates with markers of fibrosis and immunosuppression and predicts poor patient survival. We found that PAI-1 pharmacological inhibition strongly enhances chemo- and immunotherapeutic response against PDAC, increasing survival of mice. Thus, our results unveil ACSL3-PAI-1 signaling as a requirement for PDAC progression with druggable attributes.


Figures

Fig. 1
Fig. 1. ACSL3 is overexpressed in human PDAC.
(A) mRNA levels of ACSL3 in patient healthy tissue, primary PDAC, and PDAC metastasis from the subset GSE71729. Healthy pancreatic tissue: n = 46 patients, primary PDAC: n = 145 patients, and PDAC metastasis: n = 61 patients. Data are represented as box (Whisker’s) plot. Dots evidence outliers according to Tukey’s method. (B) mRNA levels of ACSL3 in patient primary PDAC and matched adjacent healthy tissue from the subset GSE62452 (n = 60). Data are expressed as entire numbers normalized by global average. (C) Representative IHC staining for ACSL3 (top) and extracellular matrix deposition marker with Masson trichrome (blue, bottom) of a human TMA showing primary healthy tissue, PanIN, and primary PDAC. Scale bars, 50 μm. (D) ACSL3 IHC quantification (H-score) of TMA comparing PDAC and adjacent healthy tissue (n = 50 samples). We considered an H-score of less than 100, from 100 to 200, and above 201 having a low, intermediate, or high staining intensity, respectively. (E) Stratification of the patients by tumor grade from (D). Healthy tissue, n = 50 samples; grade I, n = 5 samples; grade II, n = 23 samples; grade III, n = 22 samples. (F) Immunoblot for ACSL3, total RAS, and glyceraldehyde-3-phosphate dehydrogenase (GAPDH) of five human patient-derived tumor samples and matched adjacent healthy tissue. (G) Correlation between ACSL3 and Masson trichrome staining of TMA from (C) and (D). Samples are divided in low, intermediate, and high ACSL3 staining. We considered an H-score of less than 100, from 100 to 200, and above 201 having a low, intermediate, or high staining intensity, respectively. Error bars represent mean ± SD; statistical analysis was performed using one-way ANOVA. *P < 0.05, **P < 0.01, ***P < 0.001, and ****P < 0.0001.
Fig. 2
Fig. 2. Acsl3 knockout reduces tumor fibrosis and suppresses tumor progression.
(A) Acsl3 mRNA levels from healthy tissue (Kras+/+;p53flox/flox) either Acsl3+/+ or Acsl3−/− and dissected tumors from LSL-KrasG12D/+;p53flox/flox;Pdx1-CreERT2;Acsl3+/+ (KPC;Acsl3+/+) and KrasG12D/+;p53flox/flox;Pdx1-CreERT2;Acsl3−/− (KPC;Acsl3−/−) (n = 3 mice per group). (B) Representative IHC staining images of ACSL3 from KPC;Acsl3+/+ and KPC;Acsl3−/− pancreas sections representing healthy and tumor tissue. Scale bars, 50 μm. (C) Representative images of immunofluorescent staining for basic cytokeratin (top, green), ACSL3 (red), nuclei (blue), and FAP (bottom, green) of KPC;Acsl3+/+ tumor-bearing pancreas sections. Scale bars, 70 μm. (D) Representative images of H&E-stained (top, left) and basic cytokeratin–stained (bottom, left) tumor-bearing pancreas sections and pancreas tumor area quantification (right) reported as percentage of tumor area per total pancreas area from H&E-stained mouse pancreas sections of KPC;Acsl3+/+ (n = 15) and KPC;Acsl3−/− (n = 8) mice. Scale bars, 70 μm (top) and 50 μm (bottom). (E) Representative images of Sirius red–stained (top) and Masson trichrome–stained (bottom) mouse pancreatic cancer sections of KPC;Acsl3+/+ and KPC;Acsl3−/− mice. Scale bars, 70 μm (left) and 30 μm (right). (F) Quantification of fibrosis based on Sirius red and Masson trichrome staining, respectively, reported as % of area occupancy over tumor area assessed on a representative pancreas section per mouse (n = 5 to 6 mice per group). (G) Representative immunofluorescence staining for basic cytokeratin, Ki67, and nuclei (Hoechst) (left) and relative quantification (right) of KPC;Acsl3+/+ and KPC;Acsl3−/− tumor-bearing pancreas sections. The quantifications are the average of 15 pictures per mouse (n = 5 mice per group). Scale bars, 50 μm. (H) Representative immunofluorescence staining for αSMA, Ki67, and nuclei (Hoechst) (left) and relative quantification (right) of KPC;Acsl3+/+ and KPC;Acsl3−/− pancreatic cancer tissue sections. The quantifications are the average of 15 pictures per mouse; n = 5 mice per group. Scale bars, 50 μm. Error bars represent mean ± SD; statistical analysis was performed using Student’s t test or one-way ANOVA. *P < 0.05 and **P < 0.01.
Fig. 3
Fig. 3. ACSL3 drives tumor microenvironment toward immunosuppression.
(A and B) Representative images of IHC staining (left) and quantification (right) of F4/80 and CD206, respectively, in PDAC lesions of KPC;Acsl3+/+ and KPC;Acsl3−/− tumor-bearing pancreas sections; n = 5 mice per group. Scale bars, 50 μm. (C) Representative images of immunofluorescence costaining of the pan-macrophage marker F4/80 with the M2 macrophage marker Arg1 of KPC;Acsl3+/+ and KPC;Acsl3−/− tumor-bearing pancreas sections; n = 5 mice per group. Scale bars, 30 μm. (D and E) Quantifications from (C) expressed as double-positive (F4/80+/Arg1+) and single-positive (F4/80+/Arg1) cells per mm2, respectively. The quantifications are the average of 15 pictures per mouse; n = 5 mice per group. (F) Representative images of immunofluorescence staining (left) and quantification (right) of CD4 (green), FoxP3 (red), and nuclei (blue) of KPC;Acsl3+/+ and KPC;Acsl3−/− tumor-bearing pancreas sections. The quantifications are the average of 15 pictures per mouse; n = 5 mice per group. Scale bars, 50 μm. (G) Representative images of immunofluorescence staining (left) and quantification (right) of CD3 and CD8, reported as positive cells per mm2 of KPC;Acsl3+/+ and KPC;Acsl3−/− tumor-bearing pancreas sections; n = 5 mice per group. Scale bars, 50 μm. (H) Representative images of immunofluorescence staining (left) and quantification (right) of CD3 and granzyme B (GrzB) reported as positive cells per mm2 of KPC;Acsl3+/+ (n = 5 mice per group) and KPC;Acsl3−/− (n = 4 mice per group) tumor-bearing pancreas sections. Scale bars, 50 μm. Error bars represent mean ± SD; statistical analysis was performed using unpaired Student’s t test. *P < 0.05 and **P < 0.01.
Fig. 4
Fig. 4. ACSL3 controls PAI-1 levels in PDAC.
(A) ACSL activity of HPDE cells transduced with a pLKO empty vector or shRNAs against ACSL3 and treated as indicated; n = 4 per group. (B and C) PAI-1 mRNA levels (B) and immunoblot (C) of HPDEK cells transduced as in (A). (D) Pai-1 mRNA levels from tumors of KPC;Acsl3+/+ and KPC;Acsl3−/− mice; n = 4 mice per group. (E and F) PAI-1 mRNA levels (E) and immunoblot (F) of HPDEK cells treated as indicated; n = 3. A pEGFP-C1-ACSL3HA plasmid was used to rescue ACSL3 upon knockdown. (G and H) Representative immunofluorescence staining images of basic cytokeratin, PAI-1, and Hoechst (nuclei) (G) and PAI-1 quantification (H) of KPC;Acsl3+/+ and KPC;Acsl3−/− tumor tissue sections; n = 5 mice per group. (I) PAI-1 mRNA levels from human healthy tissue (n = 4) and primary PDAC (n = 124) from subset PAAD-K (KRAS mutant). In the Whisker’s plot, dots represent 5 to 95 percentile. (J) Immunoblot for PAI-1 and RAS of four human patient-derived matched healthy per tumor tissue. (K) Correlation between ACSL3 and PAI-1 mRNA levels in PDAC human samples (subset PAAD-K); n = 94. (L to O) Representative immunofluorescence staining images (left) and quantifications (right) of the indicated targets from pancreas sections of KP orthotopic PDAC tumors with or without Pai-1 knockdown; n = 5 mice per group. The quantifications are the average of 15 pictures per mouse. Error bars represent mean ± SD; statistical analysis was performed using unpaired Student’s t test or one-way ANOVA. *P < 0.05, **P < 0.01, ***P < 0.001, and ****P < 0.0001.
Fig. 5
Fig. 5. PAI-1 correlates with immunosuppression and PDAC patient survival.
(A and B) Correlation between the expression level of fibrosis marker COL11A1 (A) or Treg markers CD4, FoxP3 (B), and PAI-1 expression level in subset PAAD-K from TCGA (only KRAS-mutant samples); n = 94. (C) Correlation between FoxP3 and CD4 expression level in human subset PAAD-K samples as in (A); n = 94. (D) Correlation between the expression level of macrophage markers CD206 (M2 macrophages marker) or CD11b and PAI-1 expression in subset PAAD-K samples as in (A); n = 94. (E) Correlation between the expression level of CD206 and CD11b in human subset PAAD-K samples as in (A); n = 94. (F) Kaplan-Meier plot showing survival of human PDAC patient stratified in high (n = 62) and low (n = 62) PAI-1 mRNA level from subset PAAD-K (only KRAS-mutant samples). Correlations were performed using the Pearson’s correlation analysis.
Fig. 6
Fig. 6. PAI-1 inhibition enhances the responsiveness of PDAC tumors to chemo- and immunotherapy.
(A) Treatment scheme of mice bearing established orthotopic KP tumors treated as indicated. i.p., intraperitoneally. (B) Pancreas weight at the study end point of mice treated as in (A). Starting point: Weight of the pancreas 7 days after KP cell injection; n per group = 5/14/5/9/12. (C) Kaplan-Meier plot showing survival of mice treated as in (A); n per group = 7/7/5/5. (D and E) Representative images of H&E, IHC for basic cytokeratin and trichrome staining (D), and trichrome quantification reported as % of area occupancy over tumor area (E) of pancreatic tissue sections of mice treated as in (A); n per group = 12/5/8/9. (F to H) Representative immunofluorescence costaining (F) and quantification (G and H) of basic cytokeratin/Ki67, αSMA/Ki67, and Hoechst (nuclei) from KP orthotopic tumor sections of mice treated as in (A); n per group = 9/5/9/9. (I to M) Representative images of immunofluorescence costaining (I) and quantifications of F4/80+, arginase I+ (Arg1) (J), FoxP3+ and CD4+ (K), CD3+ and CD8+ T cells (L), and CD3+/granzyme B+ cells (M) from KP orthotopic PDAC mouse model sections treated as in (A); n per group = 9/5/9/9. In (E), (G), (H), and (J) to (M), quantifications are the average of 15 pictures per mouse. Gem, gemcitabine; Tip, tiplaxtinin. Error bars represent mean ± SD; statistical analysis was performed using one-way ANOVA. *P < 0.05, **P < 0.01, ***P < 0.001, and ****P < 0.0001.

Similar articles

Cited by

References

    1. Siegel R. L., Miller K. D., Jemal A., Cancer statistics, 2019. CA Cancer J. Clin. 69, 7–34 (2019). - PubMed
    1. Neoptolemos J. P., Kleeff J., Michl P., Costello E., Greenhalf W., Palmer D. H., Therapeutic developments in pancreatic cancer: Current and future perspectives. Nat. Rev. Gastroenterol. Hepatol. 15, 333–348 (2018). - PubMed
    1. Kleeff J., Korc M., Apte M., La Vecchia C., Johnson C. D., Biankin A. V., Neale R. E., Tempero M., Tuveson D. A., Hruban R. H., Neoptolemos J. P., Pancreatic cancer. Nat. Rev. Dis. Primers. 2, 16022 (2016). - PubMed
    1. Mantovani A., Sozzani S., Locati M., Allavena P., Sica A., Macrophage polarization: Tumor-associated macrophages as a paradigm for polarized M2 mononuclear phagocytes. Trends Immunol. 23, 549–555 (2002). - PubMed
    1. Sica A., Bronte V., Altered macrophage differentiation and immune dysfunction in tumor development. J. Clin. Invest. 117, 1155–1166 (2007). - PMC - PubMed

Publication types