. 2020 Dec 1;205(11):3107-3121.
doi: 10.4049/jimmunol.2000882. Epub 2020 Oct 30.

Pregnancy Alters Innate and Adaptive Immune Responses to Zika Virus Infection in the Reproductive Tract

Affiliations

Pregnancy Alters Innate and Adaptive Immune Responses to Zika Virus Infection in the Reproductive Tract

Kelsey E Lesteberg et al. J Immunol. .

Abstract

Recent outbreaks of Zika virus (ZIKV) have been associated with birth defects, including microcephaly and neurologic impairment. However, the mechanisms that confer potential susceptibility to ZIKV during pregnancy remain unclear. We hypothesized that poor outcomes from ZIKV infection during pregnancy are due in part to pregnancy-induced alteration of innate immune cell frequencies and cytokine expression. To examine the impact of pregnancy on innate immune responses, we inoculated immunocompetent pregnant and nonpregnant female C57BL/6 mice with 5 × 10⁵ focus-forming units of ZIKV intravaginally. Innate immune cell frequencies and cytokine expression were measured by flow cytometry at day 3 postinfection. Compared with nonpregnant mice, pregnant mice exhibited higher frequencies of uterine macrophages (CD68+) and CD11c+ CD103+ and CD11c+ CD11b+ dendritic cells. Additionally, ZIKV-infected pregnant mice had lower frequencies of CD45+ IL-12+ and CD11b+ IL-12+ cells in the uterus and spleen. Next, we measured the frequencies of Ag-experienced CD4 (CD4+ CD11a+ CD49d+) and CD8 (CD8lo CD11ahi) T cells at day 10 postinfection to determine the impact of pregnancy-associated changes in innate cellular IL-12 responses on the adaptive immune response. We found that pregnant mice had lower frequencies of uterine Ag-experienced CD4 T cells and ZIKV-infected pregnant mice had lower frequencies of uterine Ag-experienced CD8 T cells compared with ZIKV-infected nonpregnant mice. These data show that pregnancy results in altered innate and adaptive immune responses to ZIKV infection in the reproductive tract of mice and that pregnancy-associated immune modulation may play an important role in the severity of acute ZIKV infection.


Figures

Fig 1.
Fig 1.. Intravaginal ZIKV infection in C57BL/6 mice.
a) Experimental methodology: female C57BL/6 mice were treated with gonadotropins, mated, and then infected intravaginally with ZIKV at embryonic day 4.5 (E4.5). Spleen and uterine tissues were harvested at day 3 post infection (E7.5) or day 10 post-infection (E14.5). b) Vaginal lavages were performed at 24, 48, and 72 hours post-infection, and ZIKV RNA was detected by qPCR. N=80 (4 independent experiments of 20 mice each, only samples with a Cq <36 are shown (N=42 total, N=7 Day 1, N=28 Day 2, N=7 Day 3)) c) Mice in each experimental group were weighed every other day from E4.5 (day of infection) to E12.5 (day 8 post-infection). Average weights for each group are shown. N=39 (2 independent experiments with 10 or 19 mice, N=8 mock non-pregnant, N=12 mock pregnant, N=7 ZIKV non-pregnant, N=12 ZIKV pregnant). *p<0.05 Two-way ANOVA with Tukey’s multiple comparisons. d) Whole fetuses from pregnant ZIKV-infected (red triangles) and mock-infected (blue circles) mice were dissected and counted. Each symbol (triangle or circle) represents one mouse. N=25 mice (12 mock pregnant, 13 ZIKV pregnant, taken from 2 independent experiments). Error bars represent the mean ± standard deviation in all the graphs.
Fig 2.
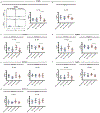
Fig 2.. Changes to the immune response in the uterus and spleen during pregnancy and ZIKV infection.
Flow cytometry was performed on immune cells from the uteruses and spleens of ZIKV-infected (red triangles) and mock-infected (blue circles) pregnant and non-pregnant mice at day 3 post infection, and the frequencies of CD68+ (a-b), CD11b+ (c), and CD11c+ (d) cells were measured. Representative pseudocolor plots of CD68 gating are shown for the (a) (uterus) and (b) (spleen). *p<0.05, **p <0.01, ***p<0.001; one-way ANOVA and Tukey’s multiple comparisons test. N=39 (2 independent experiments of 19–20 mice, N=8 mock non-pregnant, N=11 mock pregnant, N=10 ZIKV non-pregnant, N=10 ZIKV pregnant). Error bars represent the mean ± standard deviation.
Fig 3.
Fig 3.. Pregnant mice have higher frequencies of CD11b+ CD11c+ dendritic cells in the uterus.
Flow cytometry was performed on the uterine (a-b, e-f) and splenic (c-d, g-h) immune cells of ZIKV-infected (red triangles) and mock-infected (blue circles) pregnant and non-pregnant mice at day 3 post infection. Frequencies of CD11b+ CD11c+ cells (a,c), CD11b+ CD11c+ MHCII+ cells (b,d) CD86+ CD11b+ CD11c+ MHCII+ cells (e,g), and IL-10+ CD11b+ CD11c+ MHCII+ (f,h) cells were measured. Representative flow cytometry plots are also shown in (a) (CD11b+ CD11c+ gating) and (e) (CD86+ gating). *p<0.05, **p<0.01, ***p<0.001; one-way ANOVA and Tukey’s multiple comparisons test. N=40 (2 independent experiments of 20 mice, N=7 mock non-pregnant, N=13 mock pregnant, N=7 ZIKV non-pregnant, N=13 ZIKV pregnant). Error bars represent the mean ± standard deviation.
Fig 4.
Fig 4.. Pregnant mice have higher frequencies of CD11c+ CD103+ dendritic cells in the uterus.
Flow cytometry was performed on the uterine (a-c) and splenic (d-f) immune cells of ZIKV-infected (red triangles) and mock-infected (blue circles) pregnant and non-pregnant mice at day 3 post infection. Frequencies of CD11c+ CD103+ cells (a,d), CD11c+ CD103+ CD86+ cells (b,e), and CD11c+ CD103+ IL-10+ (c,f) cells were measured. A representative flow cytometry plot (CD11c+ CD103+ gating) is shown in (a). *p<0.05, ***p<0.001; one-way ANOVA and Tukey’s multiple comparisons test. N=39 (2 independent experiments of 20 mice, N=8 mock non-pregnant, N=11 mock pregnant, N=10 ZIKV non-pregnant, N=10 ZIKV pregnant). Error bars represent the mean ± standard deviation.
Fig 5.
Fig 5.. Pregnant mice have lessened IL-12 responses during Zika virus infection.
Flow cytometry was performed on the uterine and splenic immune cells of ZIKV-infected (red triangles) and mock-infected (blue circles) pregnant and non-pregnant mice at day 3 post infection. Frequencies of IL-12-expressing cells were measured within the CD45+ (a-b), CD11b+ (c), CD68+ (d), CD103+ (e), Ly6C+ (f), and CD11c+ (g) populations. Representative flow cytometry plots depicting IL-12+ gating are shown in (a). *p<0.05, **p<0.01; one-way ANOVA and Tukey’s multiple comparisons test. N=39 (2 independent experiments of 20 mice, N=8 mock non-pregnant, N=11 mock pregnant, N=10 ZIKV non-pregnant, N=10 ZIKV pregnant). Error bars represent the mean ± standard deviation.
Fig 6.
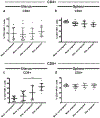
Fig 6.. Frequencies of uterine and splenic CD4+ and CD8+ T cells during pregnancy and ZIKV-infection.
Flow cytometry was performed on the uterine (a,c) and splenic (b,d) immune cells of ZIKV-infected (red triangles) and mock-infected (blue circles) pregnant and non-pregnant mice at day 10 post infection. Frequencies of CD4+ (a-b) and CD8+ (c-d) T cells were measured. *p<0.05, one-way ANOVA and Tukey’s multiple comparisons test; ++p<0.01, Kruskal-Wallis test and Dunn’s multiple comparisons test. N=40 (3 independent experiments of 10 or 20 mice, N=8 mock non-pregnant, N=12 mock pregnant, N=8 ZIKV non-pregnant, N=12 ZIKV pregnant). Error bars represent the mean ± standard deviation.
Fig 7.
Fig 7.. Pregnancy alters the frequencies of antigen-experienced T cells.
Flow cytometry was performed on the uterine (a-b) and splenic (c-d) immune cells of ZIKV-infected (red triangles) and mock-infected (blue circles) pregnant and non-pregnant mice at day 10 post infection. Frequencies of CD4+ CD11a+ CD49d+ (a,c) and CD8lo CD11ahi (b,d) T cells were measured. Representative flow plots of CD4+ CD11a+ CD49d+ and CD8lo CD11ahi cells are shown in (a) and (b), respectively. *p<0.05 one-way ANOVA and Tukey’s multiple comparisons test; +p<0.05 Kruskal-Wallis with Dunn’s multiple comparisons test. N=40 (3 independent experiments of 10 or 20 mice, N=8 mock non-pregnant, N=12 mock pregnant, N=8 ZIKV non-pregnant, N=12 ZIKV pregnant). Error bars represent the mean ± standard deviation.
Fig 8.
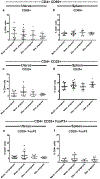
Fig 8.. Frequencies of activated T cells and Tregs in ZIKV-infected pregnant and non-pregnant mice.
Flow cytometry was performed on the uterine (a,c,e) and splenic (b,d,f) immune cells of ZIKV-infected (red triangles) and mock-infected (blue circles) pregnant and non-pregnant mice. Frequencies of CD4+ CD69+ (a-b), CD4+ CD25+ (c-d) CD4 T cells, and CD4+ CD25+ FoxP3+ Tregs (e-f) were measured. N=40 (3 independent experiments of 10 or 20 mice, N=8 mock non-pregnant, N=12 mock pregnant, N=8 ZIKV non-pregnant, N=12 ZIKV pregnant). Error bars represent the mean ± standard deviation.

Similar articles

Cited by

References

    1. Dick GW, Kitchen SF, and Haddow AJ. 1952. Zika virus. I. Isolations and serological specificity. Trans R Soc Trop Med Hyg 46: 509–520. - PubMed
    1. Kindhauser MK, Allen T, Frank V, Santhana RS, and Dye C. 2016. Zika: the origin and spread of a mosquito-borne virus. Bull World Health Organ 94: 675–686C. - PMC - PubMed
    1. Musso D, Roche C, Robin E, Nhan T, Teissier A, and Cao-Lormeau VM. 2015. Potential sexual transmission of Zika virus. Emerg Infect Dis 21: 359–361. - PMC - PubMed
    1. Barjas-Castro ML, Angerami RN, Cunha MS, Suzuki A, Nogueira JS, Rocco IM, Maeda AY, Vasami FG, Katz G, Boin IF, Stucchi RS, Resende MR, Esposito DL, de Souza RP, da Fonseca BA, and Addas-Carvalho M. 2016. Probable transfusion-transmitted Zika virus in Brazil. Transfusion 56: 1684–1688. - PubMed
    1. Meltzer E, Leshem E, Lustig Y, Gottesman G, and Schwartz E. 2016. The Clinical Spectrum of Zika Virus in Returning Travelers. The American journal of medicine 129: 1126–1130. - PubMed

Publication types

MeSH terms