. 2021 Jan 21;59(2):e01731-20.
doi: 10.1128/JCM.01731-20. Print 2021 Jan 21.

Highly Sensitive and Specific Multiplex Antibody Assays To Quantify Immunoglobulins M, A, and G against SARS-CoV-2 Antigens

Affiliations

Highly Sensitive and Specific Multiplex Antibody Assays To Quantify Immunoglobulins M, A, and G against SARS-CoV-2 Antigens

Carlota Dobaño et al. J Clin Microbiol. .

Abstract

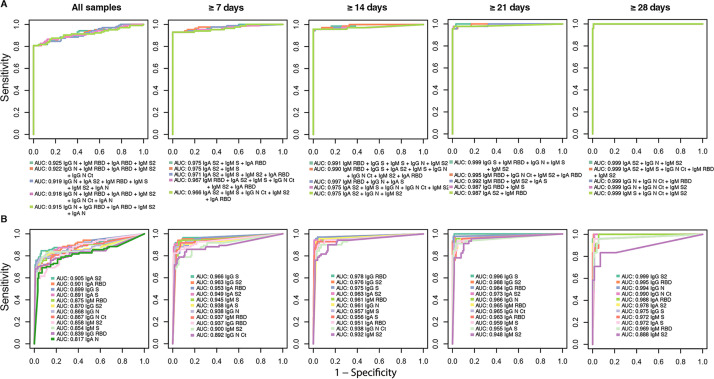
Reliable serological tests are required to determine the prevalence of antibodies against severe acute respiratory syndrome coronavirus 2 (SARS-CoV-2) and to characterize immunity to the disease in order to address key knowledge gaps in the coronavirus disease 2019 (COVID-19) pandemic. Quantitative suspension array technology (qSAT) assays based on the xMAP Luminex platform overcome the limitations of rapid diagnostic tests and enzyme-linked immunosorbent assays (ELISAs) with their higher precision, dynamic range, throughput, miniaturization, cost-efficiency, and multiplexing capacity. We developed three qSAT assays for IgM, IgA, and IgG against a panel of eight SARS-CoV-2 antigens, including spike protein (S), nucleocapsid protein (N), and membrane protein (M) constructs. The assays were optimized to minimize the processing time and maximize the signal-to-noise ratio. We evaluated their performances using 128 prepandemic plasma samples (negative controls) and 104 plasma samples from individuals with SARS-CoV-2 diagnosis (positive controls), of whom 5 were asymptomatic, 51 had mild symptoms, and 48 were hospitalized. Preexisting IgG antibodies recognizing N, M, and S proteins were detected in negative controls, which is suggestive of cross-reactivity to common-cold coronaviruses. The best-performing antibody/antigen signatures had specificities of 100% and sensitivities of 95.78% at ≥14 days and 95.65% at ≥21 days since the onset of symptoms, with areas under the curve (AUCs) of 0.977 and 0.999, respectively. Combining multiple markers as assessed by qSAT assays has the highest efficiency, breadth, and versatility to accurately detect low-level antibody responses for obtaining reliable data on the prevalence of exposure to novel pathogens in a population. Our assays will allow gaining insights into antibody correlates of immunity and their kinetics, required for vaccine development to combat the COVID-19 pandemic.

Keywords: COVID-19; IgA; IgG; IgM; Luminex; RBD; SARS-CoV-2; antibody; coronavirus; immunity; immunoassay; multiplex; nucleocapsid; performance; quantitative suspension array technology; sensitivity; specificity; spike.


Figures

FIG 1
FIG 1
Levels (median fluorescence intensity [MFI]) of IgM, IgA, and IgG antibodies to our primary SARS-CoV-2 antigen (RBD) in singleplex using samples from positive and negative individuals at different dilutions (1/100, 1/500, 1/2,000, and 1/5,000) after overnight incubation at 4°C. This served to establish the optimal range of plasma dilutions and to choose the 1/500 dilution for the subsequent assay optimization experiments.
FIG 2
FIG 2
Levels of IgM, IgA, and IgG antibodies (MFI) to RBD antigen of SARS-CoV-2 in positive and negative plasma samples (1/500 dilution) comparing incubation overnight (ON) at 4°C versus 2 h at room temperature (RT) (A) and 2 h versus 1 h at RT with two different secondary antibodies (B). In panel A, the dashed lines indicate cutoff values; the numbers and percentages of seropositive samples among rRT-PCR-positive samples are shown at the top of the dot plots. In panel B, the blue fitting curve was calculated using the LOESS (locally estimated scatterplot smoothing) method, and the black line was calculated by linear regression. The Spearman test was used to assess the correlations. Biotin-SAPE refers to secondary antibodies conjugated to biotin and streptavidin-phycoerythrin (SAPE), and PE refers to secondary antibodies conjugated with phycoerythrin. NC, negative controls; TS, test samples.
FIG 3
FIG 3
Levels of plasma IgM, IgA, and IgG antibodies to the SARS-CoV-2 spike (S) and receptor-binding domain (RBD) primary antigens at different dilutions (1/100, 1/500, 1/2,000, and 1/5,000). (A) Comparison of antibody levels (MFI) in singleplex versus multiplex. The first 10 samples from left to right are from individuals who were positive by rRT-PCR at different times since diagnosis, and the last two samples on the right are from individuals before the COVID-19 pandemic. (B) Correlation of IgG, IgM, and IgA antibody levels against the RBD versus S at different dilutions (1/500 and 1/3,500) showing the benefit of including multiple antigens in the panel to maximize the detection of seropositives. Cutoff values are indicated by dashed lines. The Spearman test was used to assess the correlations. NC, negative controls; TS, test samples.
FIG 4
FIG 4
Antibody levels to the RBD using different secondary antibodies and sample incubation times. (A) Levels of IgM, IgA, and IgG antibodies (median fluorescence intensity [MFI]) and percent seropositivity to the RBD among positive controls (burgundy), comparing secondary antibodies conjugated to biotin and streptavidin-phycoerythrin (SAPE) versus PE. Negative controls are in orange. (B) Correlations between antibody levels measured using secondary antibodies conjugated to biotin and SAPE versus PE, for 1-h and 2-h sample incubations. Seropositivity cutoff values are indicated by dashed lines. The numbers and percentages of seropositive samples among the rRT-PCR-positive samples are shown at the top of the dot plots. In panel B, the blue fitting curve was calculated using the LOESS method, and the black line was calculated by linear regression. The Spearman test was used to assess the correlations.
FIG 5
FIG 5
Antibody Luminex assay performance. Shown are receiver operating characteristic (ROC) curves and areas under the curve (AUCs) using samples from prepandemic negative controls plus either all participants with a positive COVID-19 diagnosis or participants with a positive diagnosis at different times since the onset of symptoms. ROC curves and AUCs from different combinations of multiple immunoglobulin isotypes to different antigens with top performances are included in panel A, whereas those of single isotype/antibody markers are included in panel B.

Similar articles

Cited by

References

    1. Zhu N, Zhang D, Wang W, Li X, Yang B, Song J, Zhao X, Huang B, Shi W, Lu R, Niu P, Zhan F, Ma X, Wang D, Xu W, Wu G, Gao GF, Tan W, China Novel Coronavirus Investigating and Research Team. 2020. A novel coronavirus from patients with pneumonia in China, 2019. N Engl J Med 382:727–733. doi:10.1056/NEJMoa2001017. - DOI - PMC - PubMed
    1. Day M. 2020. Covid-19: four fifths of cases are asymptomatic, China figures indicate. BMJ 369:m1375. doi:10.1136/bmj.m1375. - DOI - PubMed
    1. Wilder-Smith A, Teleman MD, Heng BH, Earnest A, Ling AE, Leo YS. 2005. Asymptomatic SARS coronavirus infection among healthcare workers, Singapore. Emerg Infect Dis 11:1142–1145. doi:10.3201/eid1107.041165. - DOI - PMC - PubMed
    1. Winter AL, Hegde ST. 2020. The important role of serology for COVID-19 control. Lancet Infect Dis 20:758–759. doi:10.1016/S1473-3099(20)30322-4. - DOI - PMC - PubMed
    1. Altmann DM, Douek DC, Boyton RJ. 2020. What policy makers need to know about COVID-19 protective immunity. Lancet 395:1527–1529. doi:10.1016/S0140-6736(20)30985-5. - DOI - PMC - PubMed

Publication types