. 2021 Feb;11(2):446-479.
doi: 10.1158/2159-8290.CD-20-0775. Epub 2020 Oct 30.

Netrin G1 Promotes Pancreatic Tumorigenesis through Cancer-Associated Fibroblast-Driven Nutritional Support and Immunosuppression

Affiliations

Netrin G1 Promotes Pancreatic Tumorigenesis through Cancer-Associated Fibroblast-Driven Nutritional Support and Immunosuppression

Ralph Francescone et al. Cancer Discov. 2021 Feb.

Abstract

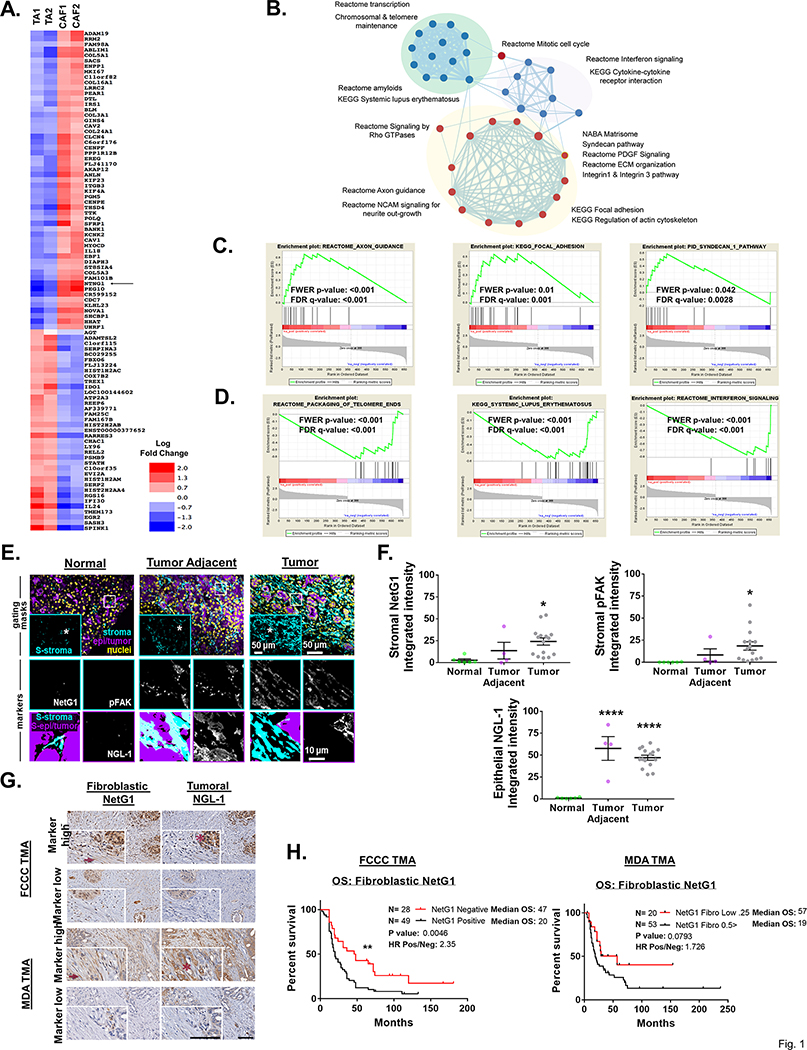
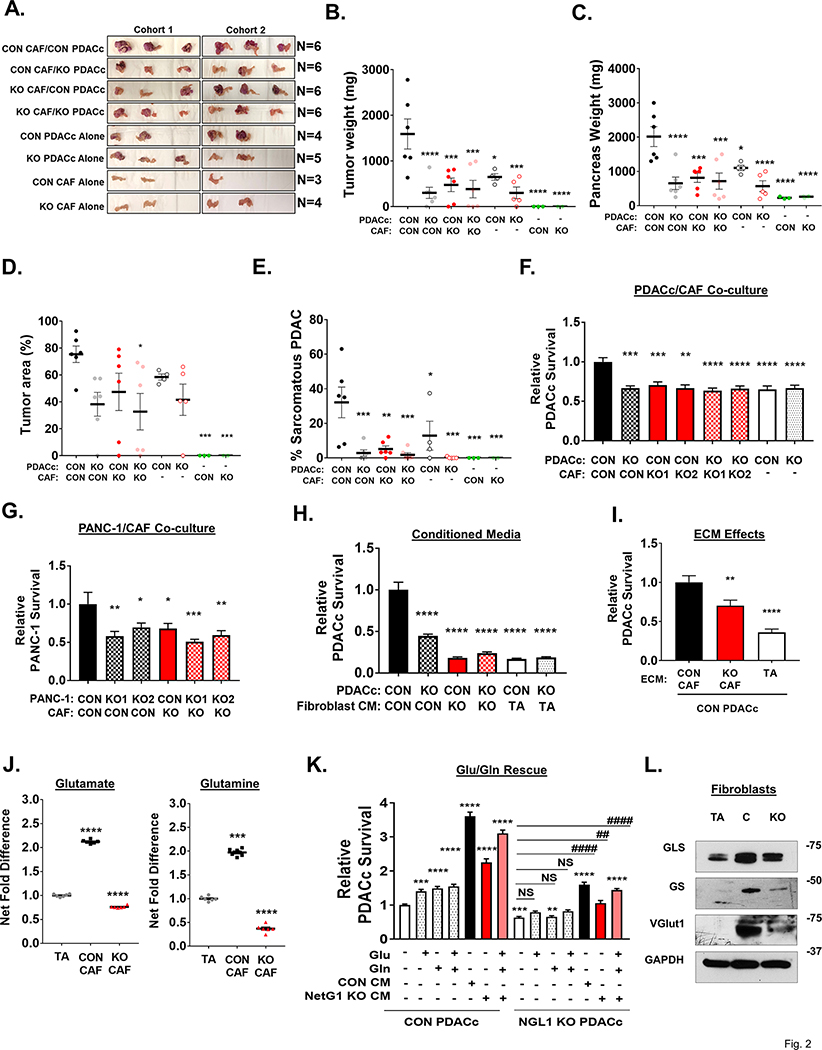
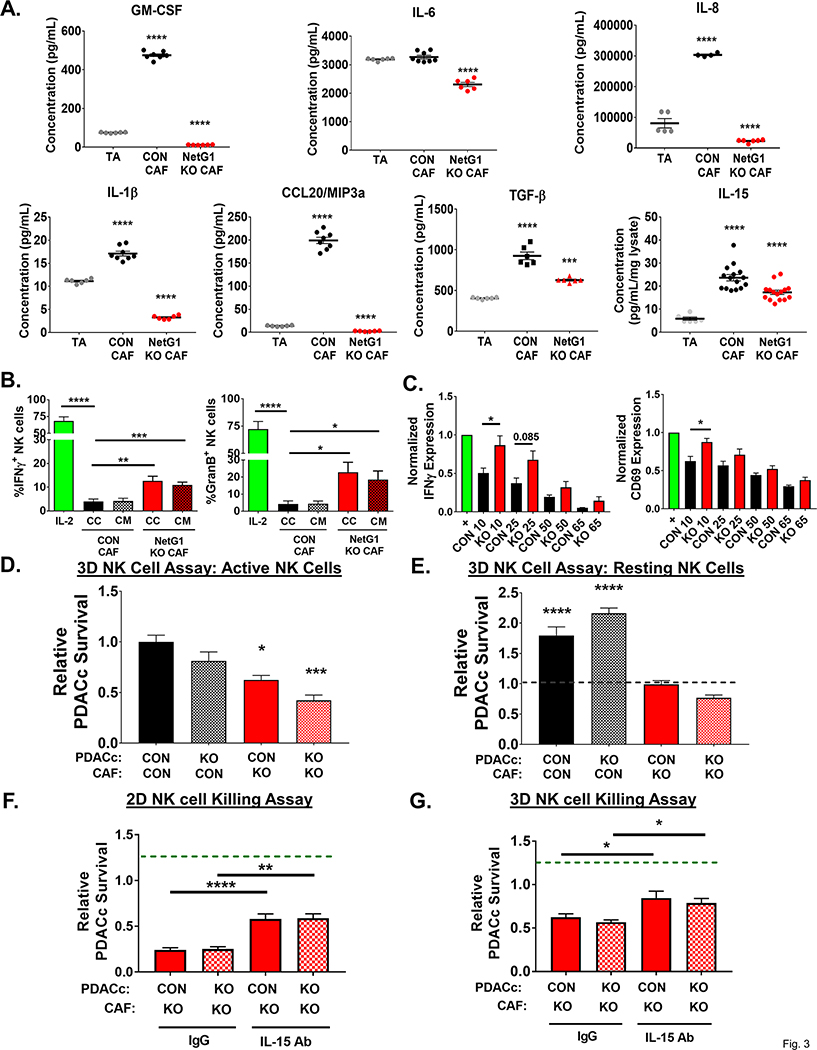
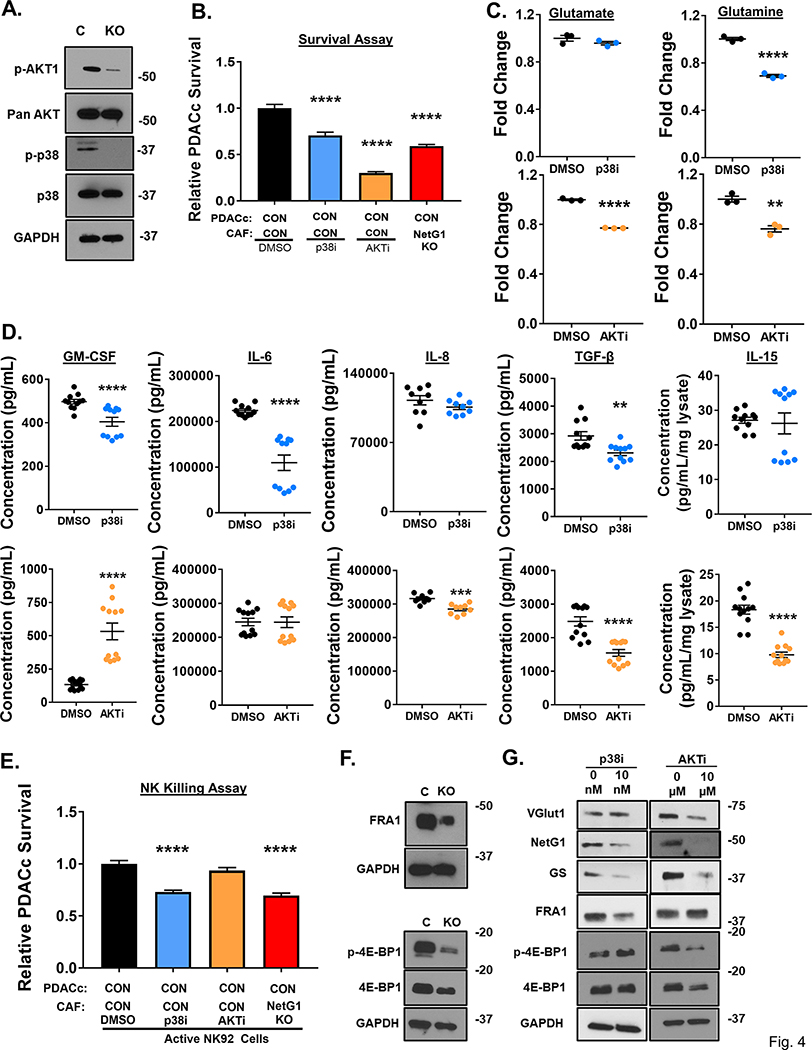
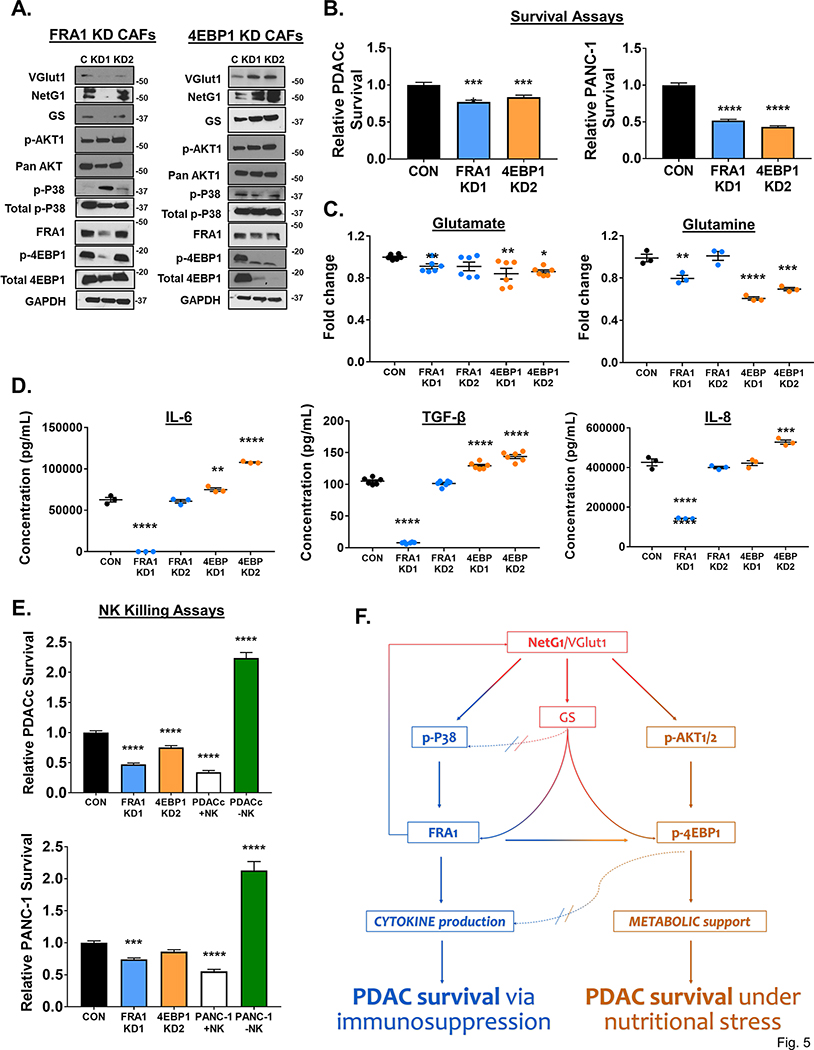
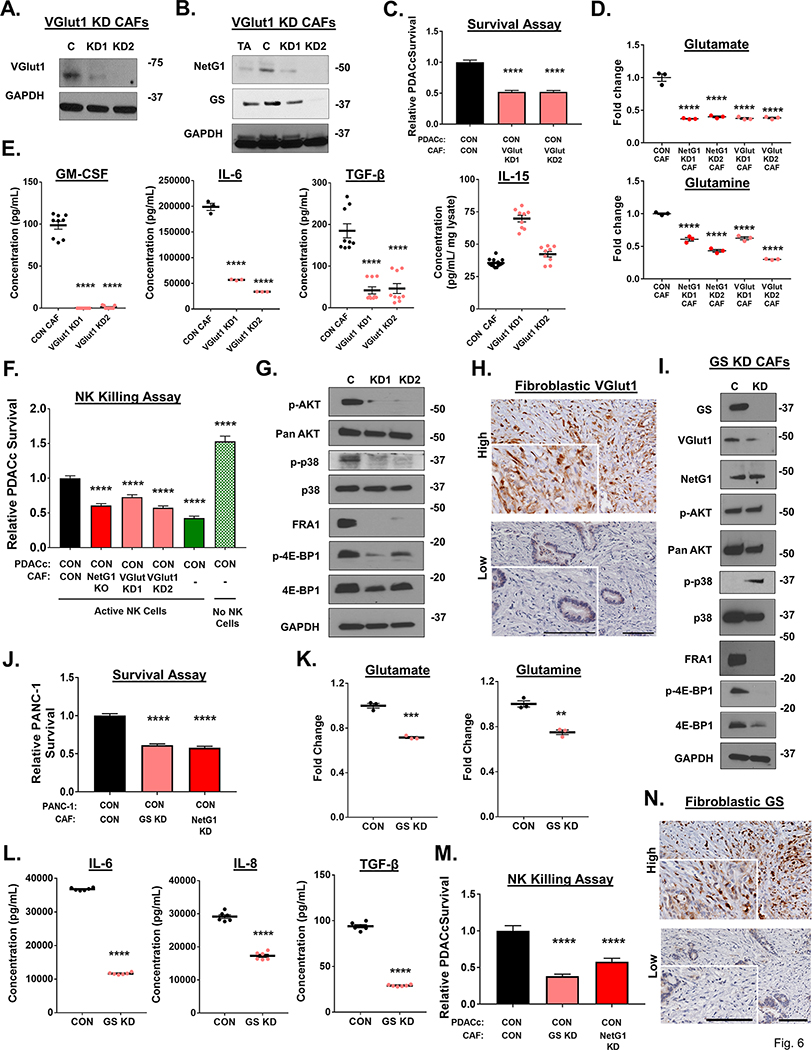
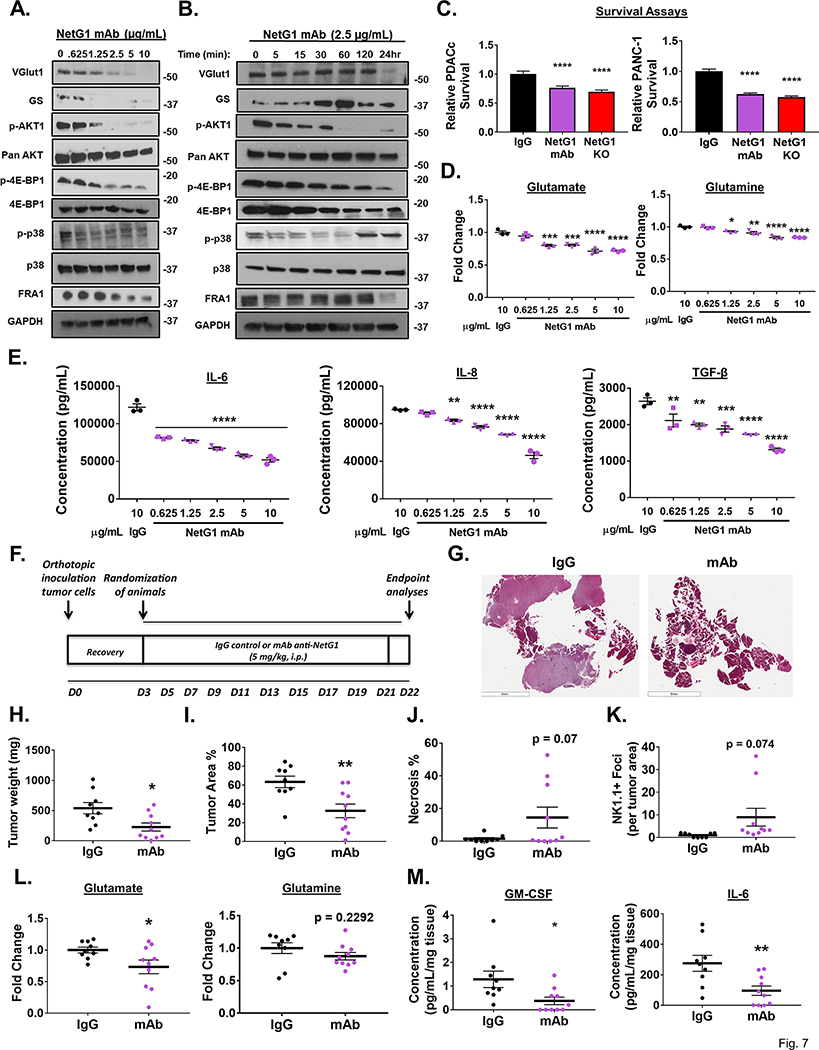
Pancreatic ductal adenocarcinoma (PDAC) has a poor 5-year survival rate and lacks effective therapeutics. Therefore, it is of paramount importance to identify new targets. Using multiplex data from patient tissue, three-dimensional coculturing in vitro assays, and orthotopic murine models, we identified Netrin G1 (NetG1) as a promoter of PDAC tumorigenesis. We found that NetG1+ cancer-associated fibroblasts (CAF) support PDAC survival, through a NetG1-mediated effect on glutamate/glutamine metabolism. Also, NetG1+ CAFs are intrinsically immunosuppressive and inhibit natural killer cell-mediated killing of tumor cells. These protumor functions are controlled by a signaling circuit downstream of NetG1, which is comprised of AKT/4E-BP1, p38/FRA1, vesicular glutamate transporter 1, and glutamine synthetase. Finally, blocking NetG1 with a neutralizing antibody stunts in vivo tumorigenesis, suggesting NetG1 as potential target in PDAC. SIGNIFICANCE: This study demonstrates the feasibility of targeting a fibroblastic protein, NetG1, which can limit PDAC tumorigenesis in vivo by reverting the protumorigenic properties of CAFs. Moreover, inhibition of metabolic proteins in CAFs altered their immunosuppressive capacity, linking metabolism with immunomodulatory function.See related commentary by Sherman, p. 230.This article is highlighted in the In This Issue feature, p. 211.


Conflict of interest statement

Declaration of Interests: M.G.V.H. discloses that he is a consultant and SAB member for Agios Pharmaceuticals, Aeglea Biotherapeutics and Auron Therapeutics. E.C. discloses that she is a consultant and SAB member for Phenomic AI. The rest of the authors declare no competing interests.

Figures

Figure 1.
Figure 1.. High NetG1 expression in CAFs inversely correlates with patient survival.
A. Heatmap representing increased (red) or decreased (blue) gene expression levels (log fold change) between patient derived tumor adjacent fibroblasts (TA) and CAFs that were maintained in 3D. Position of NetG1 (NTNG1) in the heatmap is highlighted with a black arrow. Top 117 differentially expressed genes were chosen by p-value (<0.01). B. Pathways that are significantly enriched between these two cell types are represented as network map. Each node (circle) represent a pathway while the edges (lines) connecting nodes show shared genes between pathways with thickness of edge corresponds to degree of sharing. Color of node indicate positive (red) or negative (blue) enrichment in CAF cells. Enrichment of select pathways are shown as GSEA enrichment plots with positive (C) and negative (D) enrichment in CAFs. E. Representative images of simultaneous multi-channel immunofluorescent (SMI) approach, performed on formalin fixed paraffin embedded tissue samples corresponding either to normal pancreatic tissue (normal human pancreas), normal tissue adjacent to PDAC tumor (tumor adjacent), or PDAC tumor tissue (tumor) from patient/donor surgical samples. Upper row panels show merged and pseudo-colored images corresponding to the three locations used as “gating masks.” These masks correspond to pan-cytokeratins positive areas in purple demarking epithelial/tumoral compartment, vimentin regions in cyan and DRAQ5 for nuclei in yellow. The SMIA-CUKIE algorithm (described in Material and Methods) was instructed to render an intersection “mask” image corresponding to vimentin positive epithelial/tumoral negative areas (S-stroma in upper panels inserts), whereas epi/tumor positive masks omitted all vimentin positive pixels. The two above-mentioned masks were used as areas to generate the images shown in the medium and lower rows, which are magnified images corresponding to the regions of interest highlighted in upper row images within white squares and asterisks. Medium row show “markers” in stromal areas corresponding to NetG1 and pFAK, while lower row shows NGL-1 at tumor areas. Lower left corner panels indicate the algorithm generated area “masks” used (S-epi/tumor; S/stroma). Representative scale bars are provided for each magnification F. Graphs depict integrated intensities of stromal NetG1, stromal pFAK, or epithelial NGL-1 staining in normal (N= 6), tumor adjacent (N= 4), or tumor (N= 15) pancreatic tissue. *Compared to normal tissue. One-Way ANOVA, Dunnett’s multiple comparison test. *p<0.05, ****p<0.0001. G. Representative images of patient-matched pancreatic cancer tissue evaluated in TMAs obtained from FCCC and MDA. Top row panels show high stromal NG1 and tumoral NGL-1 expression in patients with poor survival, while bottom row images illustrate tissue examples with low levels of mentioned markers, corresponding with patients with extended survival. Inserts in each image show magnified regions with examples of stromal cells pointed by dark red arrows; tumor areas are highlighted by dark red asterisks. Scale bars represent 100 μm. H. Kaplan-Meier plots depicting overall survival (OS) of PDAC patients from two independent TMAs (LEFT: FCCC; N= 80) and (RIGHT: MDA; N=143), stratified by immunohistological scores of fibroblastic NetG1. Log rank test was used to determine statistical significance. **p<0.01.
Figure 2.
Figure 2.. Ablation of NetG1 in CAFs stunts tumorigenesis in vivo and regulates Glu/Gln driven support of nutrient deprived PDAC cells.
7.5×10⁵ CON or NetG1 KO CAFs were orthotopically injected into the pancreas of SCID mice with RFP+ CON or NGL-1 KO PDACc cells (2.5×10⁵), at a 3:1 ratio. CAFs or PDACc cells injected alone served as controls. Mice were sacrificed 1 month after injection and tumorigenesis was assessed. A. Images of the isolated pancreata. B. Graph depicting relative tumor weight from each experimental group. C. Quantification of pancreas weights from each experimental group. D. Graph displaying the quantification of the % area of the pancreas that was classified as a tumor. E. Graph showing quantification of the % area of the tumors that display a sarcomatous phenotype. F. RFP+ CON or NGL-1 KO PDACc (2×10⁴) were co-cultured in 3D with GFP+ CON or NetG1 KO CAFs (2×10⁴) (2 clones, KO1 and KO2) or alone in the absence of serum and Gln for 4 days followed by cell survival assessments. * compared to CON PDACc/CON CAF. G. Same assay as in (F), but with RFP+ CON or NGL-1 KO PANC-1 cells. * compared to CON PANC-1/CON CAF. H. RFP+ CON or NGL-1 KO PDACc (2×10⁴) were co-cultured in 3D with CM from CON, NetG1 KO CAFs, or tumor adjacent fibroblasts (TA) in SF/Gln free media, and PDACc survival was measured after 4 days. * compared to CON PDACc/CON CAF. I. RFP+ CON PDACc (2×10⁴) were grown in 3D in the indicated fibroblast derived ECMs alone in the absence of serum and Gln for 4 days and PDAC cell survival was measured. * compared to CON PDACc/CON CAF. J. Relative glutamate and glutamine levels in the CM of TA, CON or NetG1 KO CAFs. N= 6 biological replicates, all groups were compared to TA condition. K. RFP+ CON or NGL-1 KO PDACc (2×10⁴) were cultured alone in 3D under serum and Gln deprivation (−). Graph depicts relative PDACc survival after exposure to media alone, Glu, Gln, or CAF CM. Treatment groups consisted of Glu (150 μM) and Gln (25 μM) addbacks to determine if those amino acids alone could rescue PDAC cell survival in the absence of CAFs. CM from CON CAFs was used as a positive control for rescue. Note how amino acids alone partially rescue CON PDACc but not NGL-1 KO PDACc, which also benefit from CM media to a lesser extent than their CON counterparts. * compared to CON PDACc alone; # compared to KO PDACc alone. All Graphs: One-Way ANOVA, Dunnett’s multiple comparison test. *p<0.05, **p<0.01, ***p<0.001; ****p<0.0001. L. Representative western blots of glutaminase (GLS), glutamine synthetase (GS) and vesicular glutamate transporter 1 (VGlut1) in TA, CON CAFs (C), and NetG1 KO CAFs (KO). GAPDH was used as a loading control. N= 5.
Figure 3.
Figure 3.. NetG1+ CAFs create an immunosuppressive microenvironment that protects PDAC cells from NK cell induced death.
A. Quantification of U-Plex (multiplex ELISA; GM-CSF, IL-1β, CCL20, IL-6, IL-8) and ELISAs (IL-15, TGF-β) of assorted cytokines with immunomodulatory or immunoattractive potentials, detected in the CM of TA, CON CAFs, or NetG1 KO CAFs, growing in 3D. N= 6 biological replicates. * compared to TA. B. Quantification of the % of NK-92 cells positive for markers of activation (IFNγ and Granzyme B) determined by flow cytometry after IL-2 pre-activated NK-92 cells (8×10⁴) were in direct co-culture (CC) with CON or NetG1 KO CAFs (2×10⁴) or treated with their conditioned media (CM) for 16 hours. * compared to CON CAF CC. C. Primary NK cells (105) were isolated from healthy human donors, pre-activated with IL-2/IL-12, incubated with CM from CON or NetG1 KO CAFs for 16 hours, and their activation status was determined by flow cytometry, using IFNγ and CD69 as markers. Expression of markers was normalized to the positive control (IL-2 alone = 1.0). * comparison between the CON and KO at each % of CM. D-E. RFP+ CON or NGL-1 KO PDACc (2×10⁴) were co-cultured in 3D with GFP+ CON or NetG1 KO CAFs (2×10⁴) and with active (D) or resting (E) NK-92 cells (8×10⁴) for 48 hours and PDAC survival was quantified. Groups were normalized to CON PDACc/CON CAF with active NK cells. Dotted line in the resting graph (RIGHT) denotes PDACc survival with CON PDACc/CON CAF with active NK cells. * compared to CON PDACc/CON CAF with active NK cells. F. NK cell killing assay in 2D, where RFP+ CON or NGL-1 KO PDACc (2×10⁴) were co-cultured with CON or NetG1 KO CAFs (2×10⁴) and 8×10⁴ active NK-92 cells (IL-2 preactivated) for 6 hours in the presence of isotype control IgG or IL-15 neutralizing antibody. Graphs depict PDACc survival, relative to the CON PDACc/CON CAF condition treated with IgG (dotted green line). * compared to IgG treated CON PDACc/CON CAF with NK cells. G. Same assay as in (F), but the co-culture is performed in 3D for 48 hours. * compared to IgG treated CON PDACc/CON CAF with NK cells. One-Way ANOVA, Dunnett’s multiple comparison test (A, B, D, E, F, G) or T-test (C). *p<0.05, **p<0.01, ***p<0.001; ****p<0.0001.
Figure 4.
Figure 4.. NetG1 functions are mediated through AKT and p38 pathways.
A. Representative western blots demonstrating downregulation of p-AKT and p-p38 in NetG1 KO CAFs compared to CON (N=3). GAPDH was used as a loading control. B. RFP+ PDACc (2×10⁴) were co-cultured with CON CAFs pre-treated for 24 hours with DMSO, 10 nM p38 inhibitor (p38i), or 10 μM AKT inhibitor (AKTi) and PDACc survival was assessed 96 hours later. * compared to DMSO. C. Graphs depicting relative Glu and Gln levels measured from CAFs treated with p38i or AKTi in serum/Gln free media for 48 hours. DMSO was used as a treatment control. * Compared to DMSO. D. ELISAs for GM-CSF, IL-6, IL-8, TGF-β, and IL-15 were performed on CM or lysates of CAFs treated for 48 hours with DMSO or p38i (TOP panel) and DMSO or AKTi (BOTTOM panel). * compared to DMSO. E. Quantification of PDACc survival after co-culture with CON CAFs pre-treated for 24 hours with DMSO, p38i, or AKTi in the presence of active NK cells (8*104). F. Representative western blots demonstrating a reduction in FRA-1, p-4E-BP1, and 4E-BP1 protein expression in NetG1 KO CAFs compared with CON CAFs (N=3). GAPDH was used as a loading control. G. Representative western blots of VGlut1, NetG1, GS, FRA1, p-4E-BP1, and 4E-BP1 from the lysates of DMSO or p38i CAFs (LEFT) and DMSO or AKTi CAFs 48 hour treated CAFs (RIGHT). One-Way ANOVA, Dunnett’s multiple comparison test (B, E) and Student’s T-test (C, D). *p<0.05, **p<0.01, ***p<0.001; ****p<0.0001.
Figure 5.
Figure 5.. Downstream mediators of p38 and AKT signaling, FRA1 and 4E-BP1, regulate metabolic and immunosuppressive properties of CAFs.
A. Representative blots of VGlut1, NetG1, GS, p-AKT, AKT, p-p38, p38, FRA1, p-4E-BP1, and 4E-BP1 in (LEFT) CON (C) or FRA1 KD1/KD2 (KD) CAFs and (RIGHT) in CON or 4E-BP1 KD CAFs (N=3). GAPDH was used as a loading control. B. Graphs depicting PDAC survival after assays were performed with PDACc cells (TOP) or PANC-1 cells (BOTTOM) co-cultured in 3D, under serum/Gln free conditions, with the most effective KD CAFs (FRA1 KD1 and 4E-BP1 KD2) from (A), *compared with co-culture with CON CAFs. C. Relative Glu and Gln levels detected in the CM of CON, FRA1 KD, or 4E-BP1 KD CAFs after culture for 48 hours in serum/Gln free media in 3D. D. Measurement of indicated cytokine production in the CM of CON, FRA1 or 4E-BP1 KD CAFs after culture for 48 hours in serum/Gln free media in 3D, as determined by ELISA. E. Quantification of PDAC cell survival after co-culture with CON, FRA1 KD1, or 4E-BP1 KD2 KD CAFs in the presence of active NK cells (8*104). PDAC cells cultured alone with or without active NK cells served as controls. LEFT: PDACc; RIGHT: PANC-1. *Compared to CON. One-Way ANOVA, Dunnett’s multiple comparison test. *p<0.05, **p<0.01, ***p<0.001; ****p<0.0001. F. NetG1 Signaling Circuit in CAFs. There are two major arms of the signaling circuit regulated by NetG1, the cytokine arm (LEFT, blue) and the metabolic arm (RIGHT, orange). NetG1 and VGlut1 (see justification for VGlut1 claims in results referring to Figure 6) sit atop the signaling network, and increase levels of GS (see justification for GS claims in results referring to Figures 6 and S17), p-p38, and p-AKT (red arrows). GS, p38, and AKT are further downstream, and regulate FRA1 and 4E-BP1 levels, which begin to diverge in what CAF functions they control. FRA-1 regulates cytokine production in CAFs (blue path), as well as mediates partial effects on CAF generated metabolism (blue to orange arrow), through Gln production. 4E-BP1 has an inhibitory effect on cytokine production (orange to blue dotted / blocked, arrow), while directly controlling CAF generated Glu/Gln (orange path). There is also positive feedback to the top of the circuit (blue to red feedback arrow), and crosstalk to the AKT/4E-BP1 arm, all originating at FRA1 (blue to orange arrow). Thus, NetG1 controls pro-tumor CAF functions, through a complex signaling network, leading to PDAC survival through immunosuppression (blue arm) and metabolic support (orange arm).
Figure 6.
Figure 6.. VGlut1 and GS regulate pro-tumor CAFs functions, in a manner similar to NetG1.
A. Representative western blots of VGlut1 in CAFs, demonstrating effective knockdown (KD) by CRISPRi (N=3). B. Representative western blot of NetG1 and GS in TA, CON, or VGlut1 KD CAFs. GAPDH was used as a loading control. N=3 C. RFP+ CON PDACc cells (2×10⁴) were cultured in 3D with CON or VGlut1 KD CAFs (2×10⁴) for 96 hours in SF/Gln Free media and PDACc cell survival was assessed. D. Relative Glu and Gln levels in the CM of NetG1 and VGlut1 KD CAFs compared to CON CAF. Note that both NetG1 KD and VGlut1 KD CAFs have a reduction in Glu/Gln levels. * Compared to CON CAF. E. Measurement of indicated cytokine production in the CM of CON or VGlut1 KD CAFs after culture for 48 hours in serum/Gln free media in 3D, as determined by ELISA. * Compared to CON CAF. F. Quantification of PDACc survival after co-culture with CON or VGlut1 KD CAFs in the presence of active NK cells (8*104). One-Way ANOVA, Dunnett’s multiple comparison test. *p<0.05, **p<0.01, ***p<0.001; ****p<0.0001. G. Representative western blots of p-AKT1, AKT, p-p38, p38, FRA1, p-4E-BP1, and 4E-BP1 comparing protein expression in CON and VGlut1 KD CAFs N=2. GAPDH was used as a loading control. H. Representative images of the immunohistochemical staining of VGlut1 in patient tissue, segregated into high or low fibroblastic VGlut1 expression. Inserts correspond to magnified regions, in which is stromal cells are more evident. Scale bars represent 100 μm. I. Representative blots of GS, VGlut1, NetG1, p-AKT, AKT, p-p38, p38, FRA1, p-4E-BP1, and 4E-BP1 in CON (C) or GS KD (KD) CAFs. GAPDH was used as a loading control. N=3. J. RFP+ CON or NGL-1 KO PDACc (2×10⁴) were cultured in 3D with CON or GS KD CAFs (2×10⁴) for 96 hours in SF/Gln Free media and PDACc cell survival was assessed. K. Relative Glu and Gln levels in the CM of GS KD CAFs compared to CON CAF. L. Measurement of indicated cytokine production in the CM of CON or GS KD CAFs after culture for 48 hours in serum/Gln free media in 3D, as determined by ELISA. M. Quantification of PDACc survival after co-culture with CON, GS KD, or NetG1 KD CAFs in the presence of active NK cells (8*104). *Compared to CON. One-Way ANOVA, Dunnett’s multiple comparison test. *p<0.05, **p<0.01, ***p<0.001; ****p<0.0001. N. Representative images of the immunohistochemical staining of GS in patient tissue, segregated into high or low fibroblastic GS expression. Inserts correspond to magnified regions, in which is stromal cells are more evident. Scale bars represent 100 μm.
Figure 7.
Figure 7.. A neutralizing monoclonal antibody targeting NetG1 inhibits pro-tumor properties of CAFs and decreases tumor burden in vivo.
A+B. Representative western blots demonstrating a dose (A) and time (B) dependent decrease in proteins associated with pro-tumorigenic pathways in CAFs after anti-NetG1 monoclonal antibody (mAb) treatment in serum and glutamine free media, with 48 hour treatment for CAFs in (A) and indicated timepoints for CAFs in (B). N=3. C. Quantification of PDAC cell survival (PDACc or PANC-1) under serum and glutamine starvation after 48 hour co-culture with CON (10 μg/mL IgG or mAb treated) or NetG1 KO CAFs, demonstrating the efficacy of NetG1 mAb in a key functional assay. D. Graphs depict amounts of secreted Glu and Gln detected in the conditioned media of CAFs treated with IgG or increasing doses of mAb for 48 hours, as determined by ELISA. E. Graphs depict amounts of secreted pro-tumor cytokines detected in the conditioned media of CAFs treated with IgG or increasing doses of mAb for 48 hours, as determined by ELISA. Note the dose dependent decrease in these key secreted factors in (D) and (E), important for PDAC tumorigenesis. * Compared to IgG. One-way ANOVA: * p <.05, ** p<.01, *** p<.001, **** p<.0001. F. Treatment Strategy: C57/BL6 mice were injected orthotopically with 106 murine pancreatic cancer cells and mice were allowed to heal for 3 days. Starting on day 4, mice were separated into two groups, IgG (n=9) and mAb (n=10), and received either 5mg/kg IgG or mAb against NetG1. Mice were treated 3 times per week until the completion of the model, at day 22. Pancreata were isolated from the mice and H+E sections were developed from a cut of the entire pancreas. G. Representative images of the H+E sections of the pancreas from each treatment group. Scale bar: 6 mm. H. Graph depicting relative tumor weights. I. Quantification of % area of the pancreas that was classified as tumor. J. Quantification of the % area of the pancreas that was classified as necrotic. K. Graph displaying the number of NK1.1 positive Foci, normalized to tumor area per tissue, and these values were subsequently normalized to IgG treated tumors to compute fold changes. L+M. A small piece of tumor tissue (30–60 mg) was excised from the pancreas of each mouse and was cultured overnight in DMEM lacking serum, glutamate (Glu) and glutamine (Gln). The resultant media was collected and the amount of Glu and Gln (L) or cytokines (M) were measured by ELISA and normalized to the weight of tumor tissue cultured. Student’s T-Test was used to determine if samples were significantly different from IgG. * p <.05, ** p<.01, *** p<.001, **** p<.0001. n=9 for IgG, n=10 for mAb.

Comment in

References

    1. Rahib L, Smith BD, Aizenberg R, Rosenzweig AB, Fleshman JM, and Matrisian LM, Projecting cancer incidence and deaths to 2030: The unexpected burden of thyroid, liver, and pancreas cancers in the united states. Cancer Res, 2014; 74: p. 2913–21. - PubMed
    1. Siegel RL, Miller KD, and Jemal A, Cancer statistics, 2020. CA Cancer J Clin, 2020; 70: p. 7–30. - PubMed
    1. Ryan DP, Hong TS, and Bardeesy N, Pancreatic adenocarcinoma. N Engl J Med, 2014; 371: p. 2140–1. - PubMed
    1. Hidalgo M, Pancreatic cancer. N Engl J Med, 2010; 362: p. 1605–17. - PubMed
    1. Sahai E, Astsaturov I, Cukierman E, DeNardo DG, Egeblad M, Evans RM, et al., A framework for advancing our understanding of cancer-associated fibroblasts. Nat Rev Cancer, 2020; 20: p. 174–186. - PMC - PubMed

Publication types

MeSH terms