. 2020 Oct 30;11(1):5499.
doi: 10.1038/s41467-020-19353-0.

Wnt/Beta-catenin/Esrrb signalling controls the tissue-scale reorganization and maintenance of the pluripotent lineage during murine embryonic diapause

Affiliations

Wnt/Beta-catenin/Esrrb signalling controls the tissue-scale reorganization and maintenance of the pluripotent lineage during murine embryonic diapause

Rui Fan et al. Nat Commun. .

Abstract

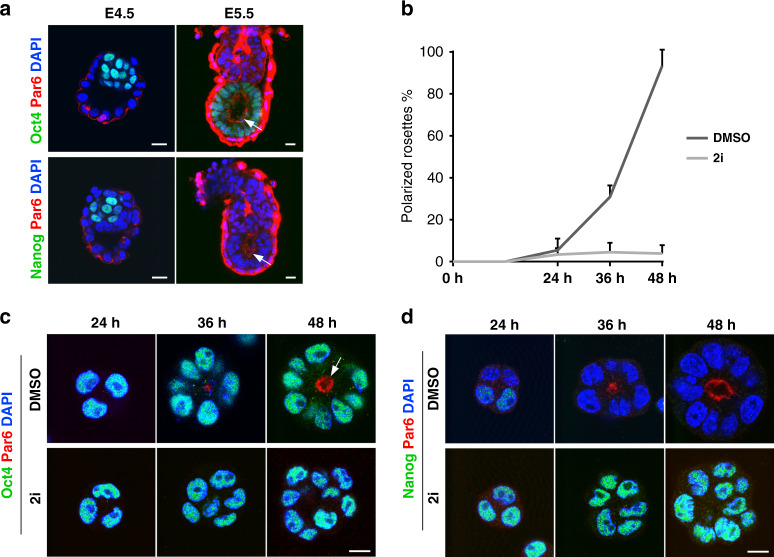
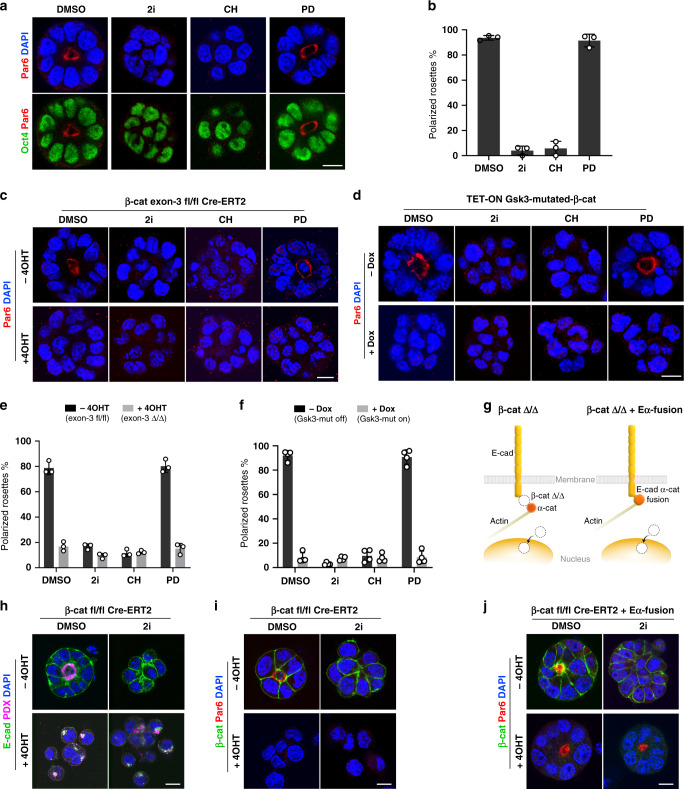
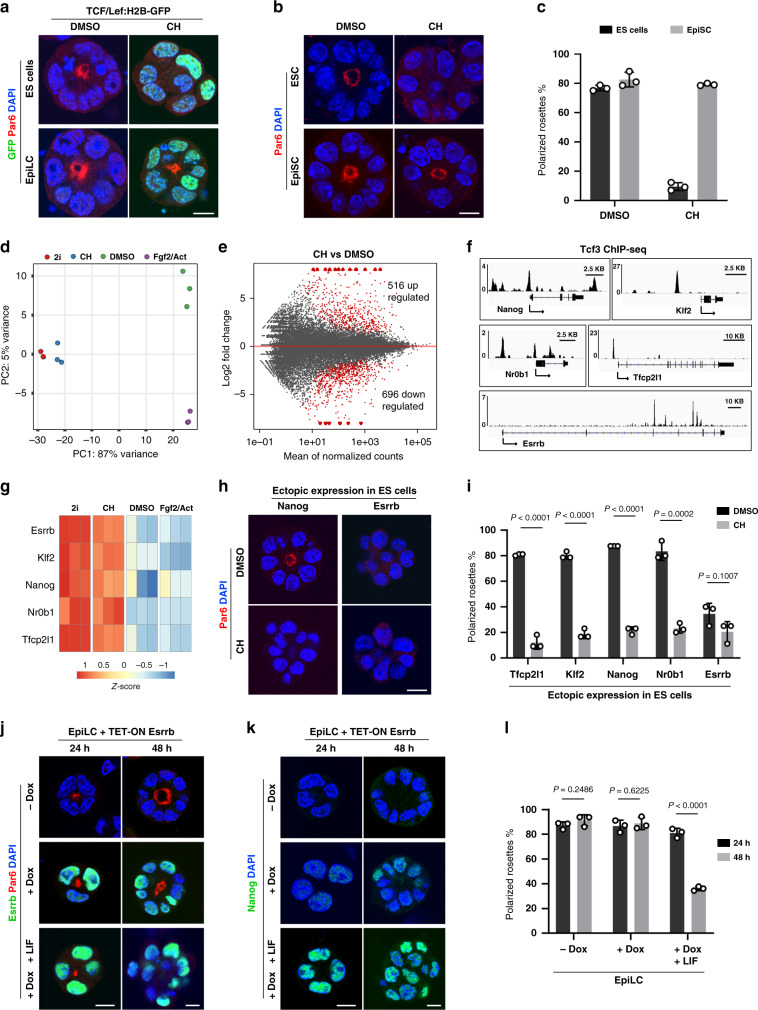
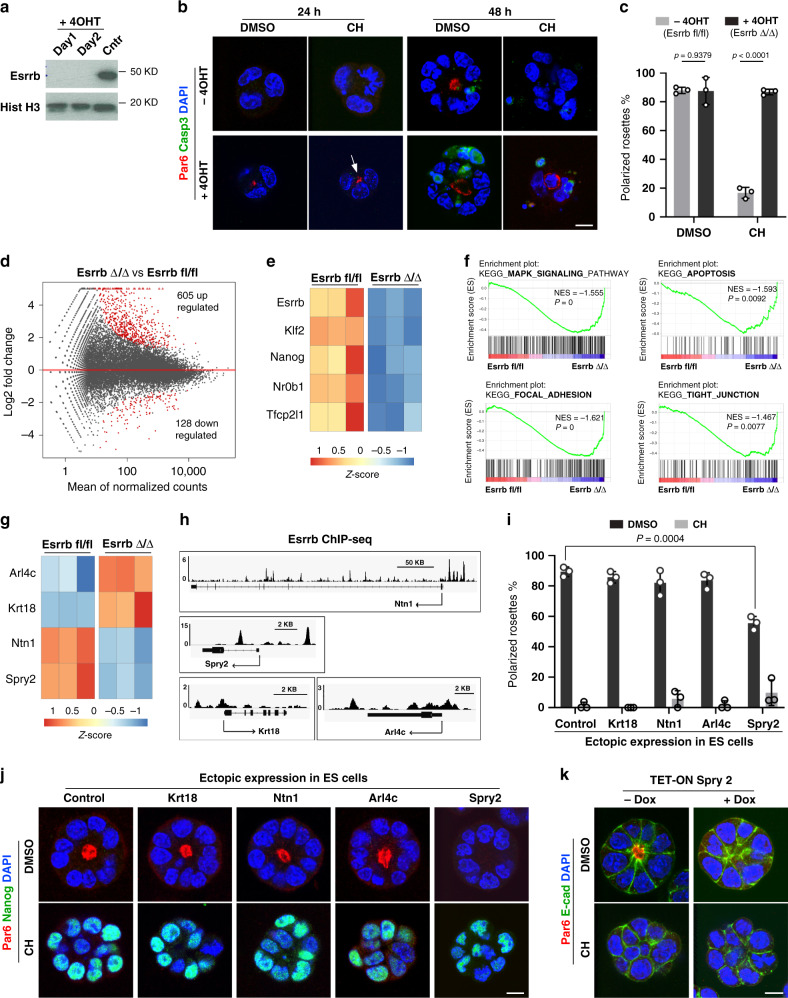
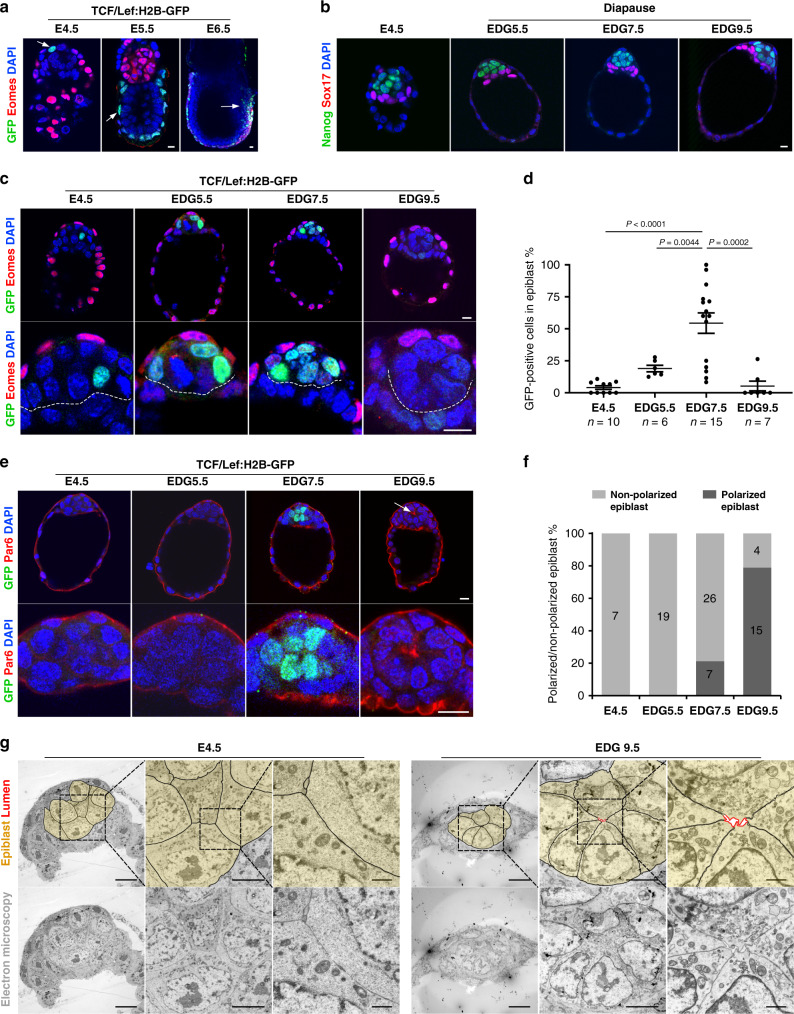
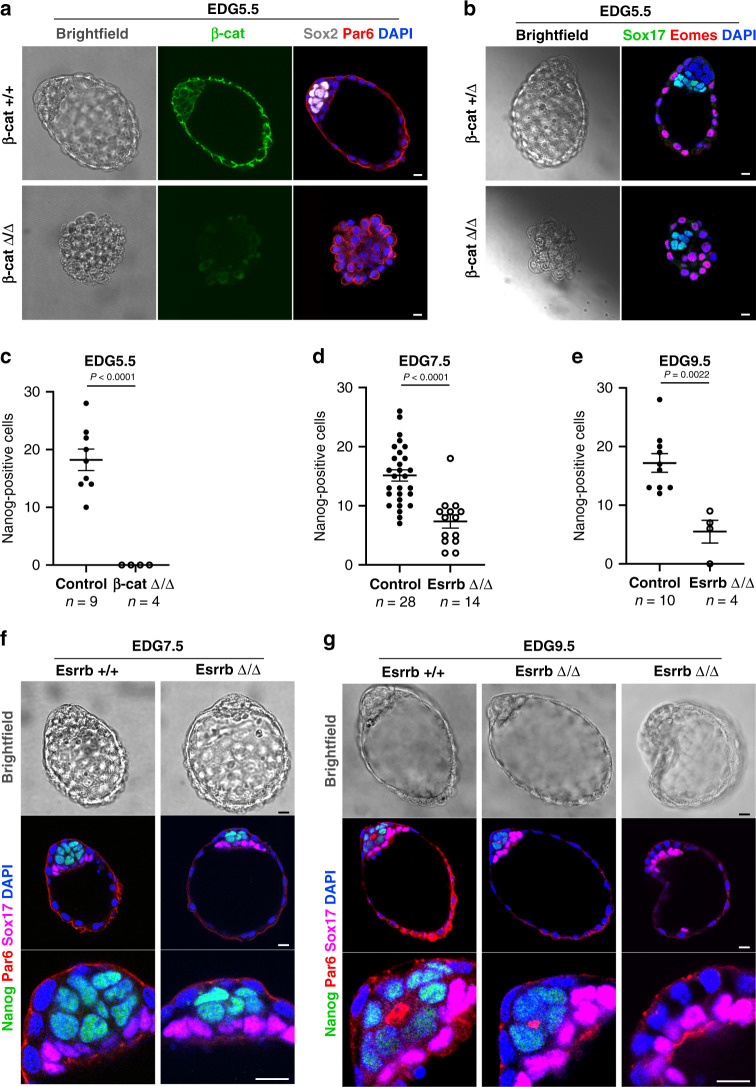
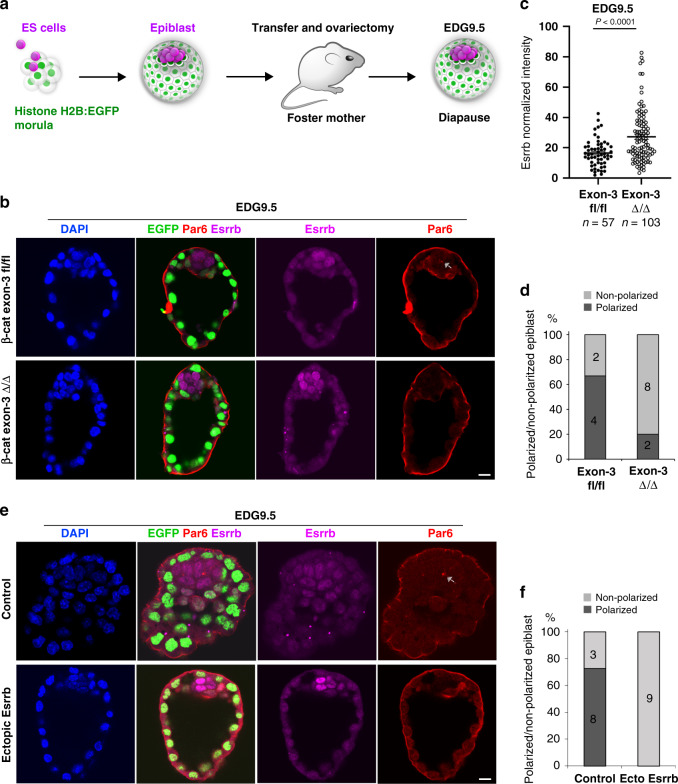
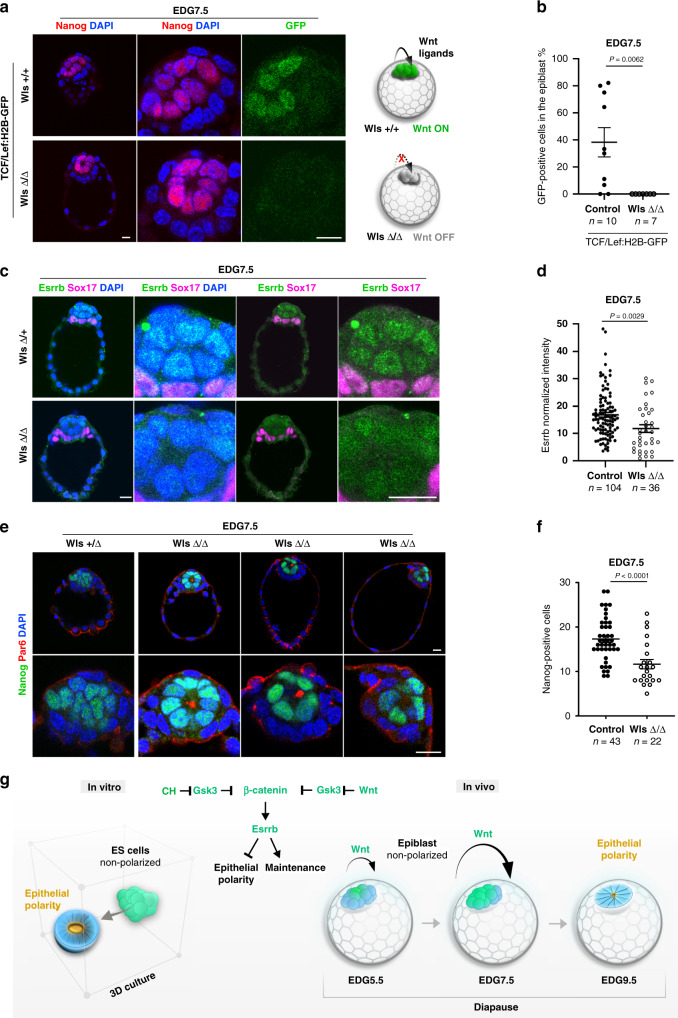
The epiblast, which provides the foundation of the future body, is actively reshaped during early embryogenesis, but the reshaping mechanisms are poorly understood. Here, using a 3D in vitro model of early epiblast development, we identify the canonical Wnt/β-catenin pathway and its central downstream factor Esrrb as the key signalling cascade regulating the tissue-scale organization of the murine pluripotent lineage. Although in vivo the Wnt/β-catenin/Esrrb circuit is dispensable for embryonic development before implantation, autocrine Wnt activity controls the morphogenesis and long-term maintenance of the epiblast when development is put on hold during diapause. During this phase, the progressive changes in the epiblast architecture and Wnt signalling response show that diapause is not a stasis but instead is a dynamic process with underlying mechanisms that can appear redundant during transient embryogenesis.


Conflict of interest statement

The authors declare no competing interests.

Figures

Fig. 1
Fig. 1. ES cells self-organisation in 3D in vitro model of early epiblast morphogenesis.
a E4.5 blastocyst and E5.5 egg cylinder-stage embryos stained for the epithelial polarity marker Par6. The apical domain (arrow) in the E5.5 epiblast surrounds the proamniotic cavity. The epiblast is marked by Oct4 (top panel). The naive pre-implantation epiblast is marked by Nanog (bottom panel), and the nuclei are counterstained with DAPI. b Establishment of epithelial rosettes in 3D ES cell culture. Wild-type E14 ES cells were cultured in N2B27 medium supplemented with DMSO (control) or 2i for 24, 36 and 48 h. Data represent mean ± SD, three independent experiments. c Wild-type E14 ES cells grown in 3D culture conditions in the presence of DMSO or 2i for 24, 36 and 48 h and stained for Par6, Oct4 and DAPI. The apical domain surrounding the lumen is marked by an arrow. d Wild-type E14 ES cells grown in 3D culture conditions in the presence of DMSO or 2i for 24, 36 and 48 h and stained for Par6, Nanog and DAPI. Scale bars, 10 µm.
Fig. 2
Fig. 2. Active Wnt/β-catenin signalling blocks the establishment of epithelial polarity.
a E14 ES cells grown in 3D culture conditions and stained for Par6, Oct4 and DAPI. b Percentage of ES cell clumps that formed Par6-positive polarised rosettes at 48 h of culture. Data represent mean ± SD, three independent experiments. c Stabilisation of β-catenin via Cre-mediated exon-3 deletion. β-catenin exon-3 fl/fl Cre-ERT2 ES cells were exposed to 4OHT for 2 days before 3D culture. After that, the cells were culture for 48 h and stained for Par6 and DAPI. d Stabilisation of β-catenin via ectopic expression of tetracycline-inducible Gsk3-mutated-β-catenin-IRES-Venus transgene in E14 ES cells. The transgene expression was induced via treatment with Dox for 2 days before 3D culture. The Venus-positive cells were collected by FACS and cultured in Matrigel for 48 h in Dox containing medium supplemented with DMSO, 2i, CH or PD. e Percentage of β-catenin exon-3 Δ/Δ and exon-3 fl/fl ES cells that formed Par6-positive rosettes at 48 h of culture. Data represent mean ± SD, three independent experiments. f Percentage of control (−Dox) and Dox-treated ES cells harbouring Gsk3-mutated-β-catenin transgene that formed Par6-positive rosettes at 48 h of culture. Data represent mean ± SD, four independent experiments. g Schematic representation of the dual role of β-catenin and the experimental approach compensating for the β-catenin function on the cell membrane using E-cadherin-α-catenin fusion. h Deletion of β-catenin via Cre-mediated recombination. β-catenin fl/fl Cre-ERT2 ES cells were exposed to 4OHT for 2 days before 3D culture. After that, the cells were cultured for 48 h and stained for E-cadherin, podocalyxin and DAPI. i β-catenin-deficient (+4OHT) and control (−4OHT) β-catenin fl/fl Cre-ERT2 ES cells were cultured for 48 h and stained for β-catenin, Par6 and DAPI. j Conditional ablation of β-catenin in β-catenin fl/fl Cre-ERT2 ES cells expressing E-cadherin–α-catenin fusion (Eα-fusion). The cells were exposed to 4OHT for 2 days and after that cultured for 48 h and stained for β-catenin, Par6 and DAPI. Scale bars, 10 µm.
Fig. 3
Fig. 3. Wnt signalling counters epithelialization in the context of naïve pluripotency via Esrrb.
a TCF/Lef:H2B-GFP ES cells and TCF/Lef:H2B-GFP EpiLC stained for GFP, Par6 and DAPI. b ES cells and EpiSC cultured in the presence of DMSO or CH and stained for Par6 and DAPI. c Percentage of ES cells and EpiSC that formed Par6-positive polarised rosettes. Data represent mean ± SD, three independent experiments. d Principal component analysis (PCA) plot of RNA-seq datasets. The cells were grown in 3D culture for 48 h, each culture condition is represented by three replicates. e Scatter plot of gene expression of CH and DMSO-treated cells with differentially expressed genes that are significantly up- or downregulated shown in red, adjusted P value < 0.01, three replicates per culture condition. f Gene tracks representing the binding of Tcf3 at the indicated loci. The x axis represents the linear sequence of genomic DNA, and the y axis represents the total number of mapped reads. g Expression of Wnt target genes with respect to the mean expression across DMSO, 2i, CH or Fgf2/Activin culture conditions. h E14 ES cells expressing ectopically Nanog or Esrrb transgenes, cultured in the presence of DMSO or CH and stained for Par6 and DAPI. i Percentage of ES cells ectopically expressing Tfcp2l1, Klf2, Nanog, Nr0b1 or Esrrb that formed Par6-positive polarised rosettes. Data represent mean ± SD, three independent experiments, two-tailed unpaired Student’s t test, the exact P value is noted in the figure. j EpiLC expressing inducible Esrrb transgene were cultured without Dox (control), in the presence of Dox or in medium supplemented with both of Dox and Lif. After 24 and 48 h, the cells were stained for Par6, Esrrb and DAPI. k Endogenous Nanog expression during EpiLC reprogramming. l Percentage of Par6-positive polarised rosettes at 24 and 48 h of EpiLC reprogramming. Data represent mean ± SD, three independent experiments, two-tailed unpaired Student’s t test, the exact P value is noted in the figure. Scale bars, 10 µm.
Fig. 4
Fig. 4. Esrrb controls the epithelial programme via Spry2.
a Depletion of Esrrb upon 4OHT treatment. Histone H3 serves as a loading control. Uncropped blots are provided in source data file. b Esrrb fl/fl ES cells expressing tamoxifen-inducible Cre cultured without or in the presence of 4OHT for 1 day before 3D culture. After that, the cells were grown in Matrigel in a medium supplemented with DMSO or CH for 24 h or 48 h and stained for Par6, cleaved Caspase-3 and DAPI. The apical domain in Esrrb-deficient cells is indicated with an arrow. c Establishment of epithelial rosettes in Esrrb Δ/Δ (+4OHT) and control Esrrb fl/fl (−4OHT) ES cells, Data represent mean ± SD, three independent experiments, two-tailed unpaired Student’s t test, the exact P value is noted in the figure. d Scatter plot of gene expression of Esrrb Δ/Δ and Esrrb fl/fl cells grown in the presence of CH for 24 h. Differentially expressed genes that are significantly up- or downregulated are shown in red, adjusted P value < 0.01, three replicates per genotype. e Gene expression of Wnt-responsive naive pluripotency factors in Esrrb Δ/Δ and Esrrb fl/fl cells. f GSEA plots showing enrichment of MAPK, apoptosis, focal adhesion and tight junction KEGG pathways. g Gene expression of epithelial factors in Esrrb Δ/Δ and Esrrb fl/fl cells. h Gene tracks representing the binding of Esrrb at the indicated loci. The x axis represents the linear sequence of genomic DNA, and the y axis represents the total number of mapped reads. i Percentage of E14 ES cells ectopically expressing Krt18, Ntn1, Arl4c or Spry2 that formed Par6-positive polarised rosettes. Data represent mean ± SD, three independent experiments, two-tailed unpaired Student’s t test, the exact P value is noted in the figure. j E14 ES cells (control) and E14 ES cells ectopically expressing Krt18, Ntn1, Arl4c or Spry2 stained for Par6, Nanog and DAPI. k Inducible ectopic expression of Spry2 in E14 ES cells (+Dox), compared to unstimulated (−Dox) control, stained for Par6, E-cadherin and DAPI. Scale bars, 10 µm.
Fig. 5
Fig. 5. Dynamics of Wnt signalling activity and epiblast self-organisation during diapause.
a TCF/Lef:H2B-GFP embryos isolated at E4.5, E5.5 and E6.5 and stained for GFP, Eomes and DAPI. Arrows indicate the location of the TCF/Lef:H2B-GFP-positive cells. b E4.5 blastocysts and EDG5.5, EDG7.5 and EDG9.5 diapause embryos stained for Nanog, Sox17 and DAPI. c TCF/Lef:H2B-GFP embryos isolated at E4.5, EDG5.5, EDG7.5 and EDG9.5 and stained for GFP, Eomes and DAPI. Dashed line indicates the border between the epiblast and the primitive endoderm. d Percentage of GFP-positive cells in the epiblast of E4.5, EDG5.5, EDG7.5 and EDG9.5 embryos. Data represent mean ± SEM, n = number of embryos, two-tailed unpaired Student’s t test, the exact P value is noted in the figure. e TCF/Lef:H2B-GFP embryos isolated at E4.5, EDG5.5, EDG7.5 and EDG9.5 and stained for GFP, Par6 and DAPI. The apical domain in the epiblast of the EDG9.5 embryo is marked by an arrow. f Percentage of embryos with polarised and non-polarised epiblast at E4.5, EDG5.5, EDG7.5 and EDG9.5. The number of embryos is indicated on the graph. g Electron microscopy analysis of E4.5 and EDG9.5 blastocysts. The colour overlay (top panel) marks the epiblast (yellow) and the apical domain (red) that surrounds the central microlumen at EDG9.5. Scale bars ac, e: 10 µm and g (from left to right): 10, 5 and 1 µm.
Fig. 6
Fig. 6. Loss-of-function analysis of β-catenin and Esrrb during diapause.
a β-catenin control (+/+) and knockout (Δ/Δ) embryos isolated at EDG5.5 and stained for β-catenin, Sox2, Par6 and DAPI. b β-catenin control (Δ/+) and knockout (Δ/Δ) embryos isolated at EDG5.5 and stained for Sox17, Eomes and DAPI. c The number of epiblast cells in β-catenin control (+/+ and + /Δ) and knockout (Δ/Δ) embryos at EDG5.5 based on Nanog expression. Data represent mean ± SEM, n = number of embryos, two-tailed unpaired Student’s t test, the exact P value is noted in the figure. d The number of epiblast cells in Esrrb control (+/+ and + /Δ) and knockout (Δ/Δ) embryos at EDG7.5 based on Nanog expression. Data represent mean ± SEM, n = number of embryos, two-tailed unpaired Student’s t test, the exact P value is noted in the figure. e The number of epiblast cells in Esrrb control (+/+ and + /Δ) and knockout embryos (Δ/Δ) at EDG9.5 based on Nanog expression. Data represent mean ± SEM, n = number of embryos, two-tailed unpaired Student’s t test, the exact P value is noted in the figure. f Esrrb control (+/+) and knockout (Δ/Δ) embryos isolated at EDG7.5 and stained for Nanog, Par6, Sox17 and DAPI. g Esrrb control (+/+) and knockout (Δ/Δ) embryos isolated at EDG9.5 and stained for Nanog, Par6, Sox17 and DAPI. Scale bars, 10 µm.
Fig. 7
Fig. 7. Wnt/β-catenin/Esrrb cascade controls the tissue-scale organisation of the epiblast during diapause.
a Schematic representation of the generation of chimeric blastocysts. b EDG9.5 chimeric embryos containing epiblast comprised of β-catenin exon-3 Δ/Δ or control β-catenin exon-3 fl/fl cells stained for Esrrb, EGFP, Par6 and DAPI. c Esrrb expression in β-catenin exon-3 Δ/Δ or control β-catenin exon-3 fl/fl epiblast cells at EDG9.5. Data represent mean ± SEM, n = cells measured in ten β-catenin exon-3 Δ/Δ and six control β-catenin exon-3 fl/fl embryos, two-tailed unpaired Student’s t test, the exact P value is noted in the figure. d Percentage of chimeric embryos with polarised and non-polarised β-catenin exon-3 Δ/Δ or control β-catenin exon-3 fl/fl epiblast. e EDG9.5 chimeric embryos containing epiblast comprised of wild-type (control) or Esrrb ectopically expressing ES cells stained for Esrrb, EGFP, Par6 and DAPI. f Percentage of chimeric embryos–control and ectopically expressing Esrrb, with polarised and non-polarised epiblast at EDG9.5. Scale bars, 10 µm.
Fig. 8
Fig. 8. Wnt signalling is activated in an autocrine manner during diapause.
a Control TCF/Lef:H2B-GFP Wls +/+ and TCF/Lef:H2B-GFP Wls Δ/Δ embryos isolated at EDG7.5 and stained for GFP, Nanog and DAPI. Note the lack of GFP expression in the epiblast of Wls-deficient blastocysts. b Percentage of GFP-positive cells in epiblast in control TCF/Lef:H2B-GFP Wls (+/+ and +/Δ) and TCF/Lef:H2B-GFP Wls Δ/Δ embryos at EDG7.5. Data represent mean ± SEM, n = number of embryos, two-tailed unpaired Student’s t test, ***P < 0.001. c Wls control (+/Δ) and knockout (Δ/Δ) embryos stained for Esrrb, Par6 and DAPI. d Esrrb expression in the epiblast cells of Wls control (+/+ and +/Δ) and knockout (Δ/Δ) embryos at EDG7.5. Data represent mean ± SEM, n = cells measured in eight Wls control and five knockout embryos, two-tailed unpaired Student’s t test, the exact P value is noted in the figure. e Wls control (+/Δ) and knockout (Δ/Δ) embryos stained for Nanog, Par6 and DAPI. f The number of epiblast cells in Wls control (+/+ and +/Δ) and knockout (Δ/Δ) embryos at EDG7.5 based on Nanog expression. Data represent mean ± SEM, n = number of embryos, two-tailed unpaired Student’s t test, the exact P value is displayed in the figure. g Function of the Wnt/β-catenin/Esrrb cascade in vitro and in vivo. Scale bars, 10 µm.

Similar articles

Cited by

References

    1. Hackett JA, Surani MA. Regulatory principles of pluripotency: from the ground state up. Cell Stem Cell. 2014;15:416–430. doi: 10.1016/j.stem.2014.09.015. - DOI - PubMed
    1. Govindasamy N, Duethorn B, Oezgueldez HO, Kim YS, Bedzhov I. Test-tube embryos—mouse and human development in vitro to blastocyst stage and beyond. Int. J. Dev. Biol. 2019;63:203–215. doi: 10.1387/ijdb.180379ib. - DOI - PubMed
    1. Nancy P, et al. Chemokine gene silencing in decidual stromal cells limits T cell access to the maternal-fetal interface. Science. 2012;336:1317–1321. doi: 10.1126/science.1220030. - DOI - PMC - PubMed
    1. Wang H, Dey SK. Roadmap to embryo implantation: clues from mouse models. Nat. Rev. Genet. 2006;7:185–199. doi: 10.1038/nrg1808. - DOI - PubMed
    1. Kinoshita M, Smith A. Pluripotency deconstructed. Dev. Growth Differ. 2018;60:44–52. doi: 10.1111/dgd.12419. - DOI - PubMed

Publication types