. 2020 Oct 30;6(1):47.
doi: 10.1038/s41522-020-00155-7.

Strong oral plaque microbiome signatures for dental implant diseases identified by strain-resolution metagenomics

Affiliations

Strong oral plaque microbiome signatures for dental implant diseases identified by strain-resolution metagenomics

Paolo Ghensi et al. NPJ Biofilms Microbiomes. .

Abstract

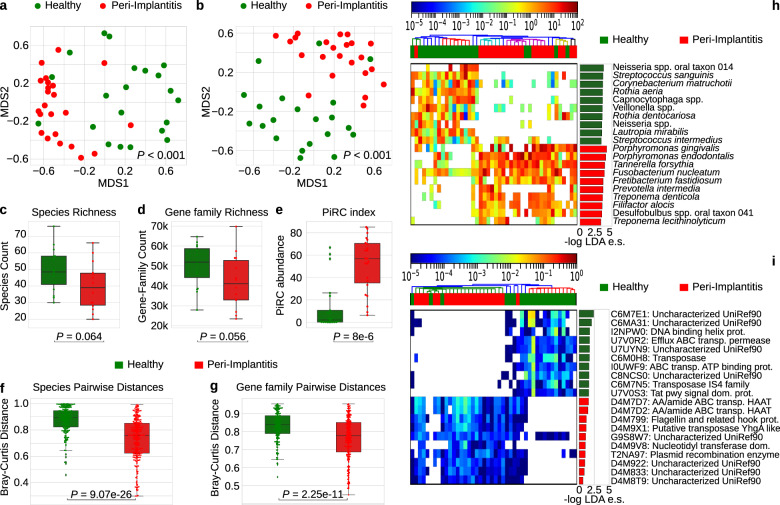
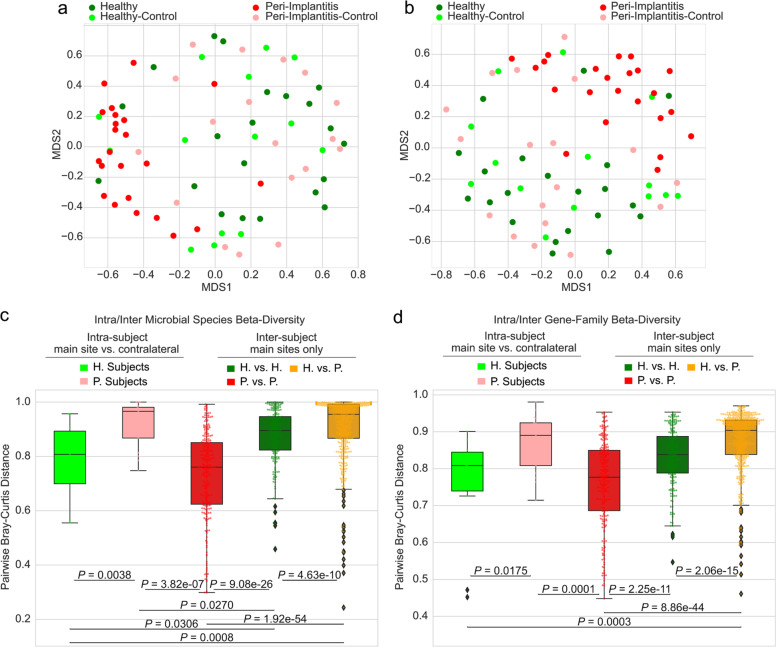
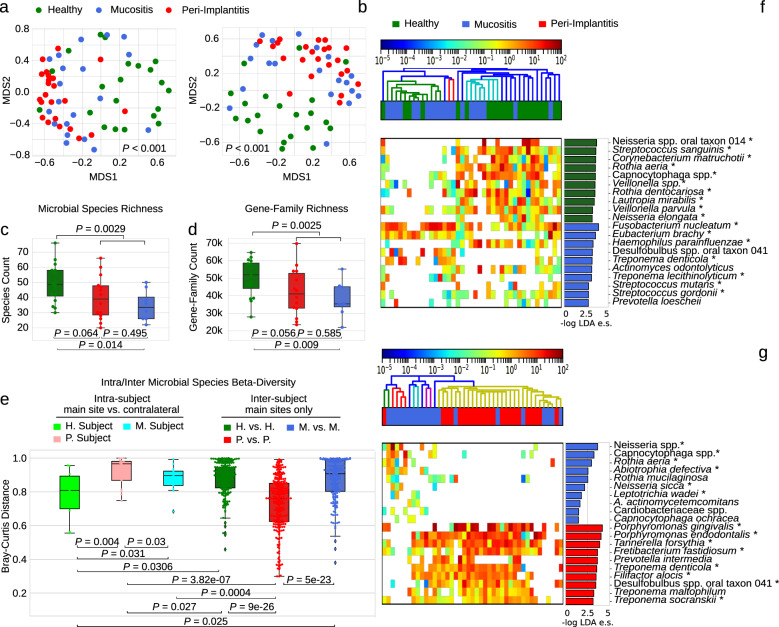
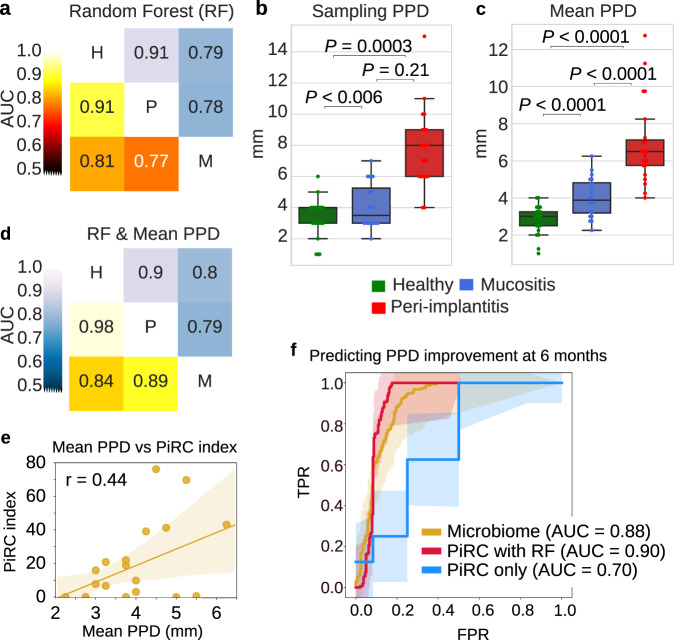
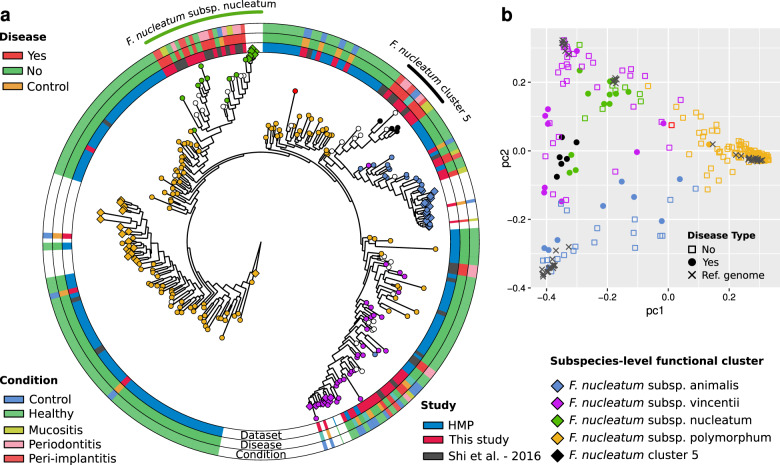
Dental implants are installed in an increasing number of patients. Mucositis and peri-implantitis are common microbial-biofilm-associated diseases affecting the tissues that surround the dental implant and are a major medical and socioeconomic burden. By metagenomic sequencing of the plaque microbiome in different peri-implant health and disease conditions (113 samples from 72 individuals), we found microbial signatures for peri-implantitis and mucositis and defined the peri-implantitis-related complex (PiRC) composed by the 7 most discriminative bacteria. The peri-implantitis microbiome is site specific as contralateral healthy sites resembled more the microbiome of healthy implants, while mucositis was specifically enriched for Fusobacterium nucleatum acting as a keystone colonizer. Microbiome-based machine learning showed high diagnostic and prognostic power for peri-implant diseases and strain-level profiling identified a previously uncharacterized subspecies of F. nucleatum to be particularly associated with disease. Altogether, we associated the plaque microbiome with peri-implant diseases and identified microbial signatures of disease severity.


Conflict of interest statement

P.G. and N.S. are co-founders of PreBiomics S.r.l., a company active in the fields of implantology and microbiome research. M.B. is an employee of PreBiomics, and C.T. is a scientific advisor for PreBiomics.

Figures

Fig. 1
Fig. 1. The plaque microbiome strongly differs in healthy and peri-implantitis sites.
a Multidimensional scaling (MDS) ordination plot of healthy and peri-implantitis sites based on the Bray–Curtis distance between microbiome samples highlights a strong condition-specific clustering. p values were obtained by PERMANOVA. b Ordination plot (MDS) of healthy and peri-implantitis metagenomic samples based on the abundance of microbial UniProt90 gene families. p values were obtained by PERMANOVA. c Alpha-diversity distributions computed after rarefaction to the same sequencing depth and estimated as the richness of species and d as richness of UniProt90 gene families show a trend of decreased diversity in peri-implantitis sites. p values were obtained by the two-tailed Wilcoxon signed-rank test. e Distribution of PiRC index values (the total abundance species in the peri-implantitis-related complex) in healthy and peri-implantitis samples. p value was obtained by the two-tailed Wilcoxon signed-rank test. f Intra-condition beta-diversity (Bray–Curtis dissimilarity) for microbial species and g gene families points at a converging microbiome structure in diseased peri-implantitis sites. p values were obtained by two-tailed Wilcoxon signed-rank test. h Relative abundances (log scale) and effect sizes (LDA score from LEfSe) of the 10 microbial species and i gene families most strongly associated with either the healthy sites or the sites with peri-implantitis (top 10 species/gene families effect sizes per class). All the comparisons in this figure are performed using the sample from the main site in each subject without considering the contralateral samples.
Fig. 2
Fig. 2. The microbiome in peri-implantitis patients is site specific and peri-implantitis sites are microbially consistent across individuals.
a Ordination plot (MDS) of peri-implantitis and healthy metagenomic samples (main and contralateral) based on the Bray–Curtis distances highlights the clustering of healthy contralateral samples in peri-implantitis with the samples from healthy individuals. b Ordination analysis as per a obtained using microbial gene family abundances instead of taxonomic profiles. c Beta-diversities estimated with the Bray–Curtis dissimilarity metric for intra- and inter-condition comparisons in the diseased and healthy conditions estimated using the taxonomic microbial composition and d the functional microbial gene family composition. p values were obtained by two-tailed Wilcoxon signed-rank test and reported if considered significant (<0.05). Estimations of the intra-subject beta-diversity are performed using the main site and the contralateral samples.
Fig. 3
Fig. 3. Mucositis shows an intermediate microbial signature between peri-implantitis and healthy sites.
a Ordination plot (MDS) of healthy, mucositis, and peri-implantitis samples based on taxonomic abundance profiles and b microbial gene family profiles. c Alpha-diversity distributions estimated as species richness and d richness of UniProt90 gene families. e Beta-diversity distributions estimated with the Bray–Curtis dissimilarity metric for intra- and inter-condition comparisons in the three conditions. Estimations of the intra-subject beta-diversity are performed using the main site and the contralateral samples. f Relative abundances (log scale) and effect sizes (LDA score from LEfSe) of the ten microbial species most strongly associated with mucositis in comparison with healthy sites and g peri-implantitis sites (top ten species/gene family effect sizes per class).
Fig. 4
Fig. 4. Diagnostic and prognostic metagenomic machine-learning signatures for mucositis and peri-implantitis.
a AUC prediction matrix between pairs of conditions (H healthy, M mucositis, P peri-implantitis) achieved by the random forest machine-learning classifier using taxonomic species-level features (bottom left triangular matrix in black–red–yellow colormap) and functional gene family features (upper right triangular matrix in blue colormap). Classifiers are applied in 10-fold cross-validation repeated 20 times. b Distribution of PPD values at the sampling site (“sampling PPD”) and c mean PPD for the three conditions considered in this study. d The same prediction matrix of a but using a classifier trained both on microbiome features (species or gene family abundance) and mean PPD values. Only samples from the main peri-implant sites are used in these analyses without considering the contralateral sites. e Correlation between mean PPD at baseline and peri-implantitis-related complex (PiRC) index for the mucositis samples. Pearson’s correlation coefficient is reported. f Receiver operating characteristic (ROC) curves and AUC values for the cross-validation performance of the microbiome-based RF classifier in predicting improvements in mean PPD values. The three models consider (i) all species, (ii) the species in the PiRC, and (iii) the PiRC index as input features.
Fig. 5
Fig. 5. Strain-level characterization of Fusobacterium nucleatum from metagenomes of the healthy, mucositis, peri-implantitis, and periodontitis plaque.
a StrainPhlAn-based phylogenetic tree computed on the MetaPhlAn2 markers for F. nucleatum. Each node represents a single F. nucleatum strain reconstructed from a sample. Clinical metadata are reported in the three outer rings. Contralateral controls of healthy patients are labeled as “healthy.” Nodes are colored by genomic-content cluster (“Methods” and Supplementary Fig. 10). White nodes reflect samples that could not be detected and typed by PanPhlan and that were not clustered. Reference genomes are indicated by diamond leaf markers. The five colors of the markers refer to the five identified subtypes, including the newly identified F. nucleatum Cluster 5 subspecies (see “Methods”). Subspecies significantly associated with peri-implant diseases are marked externally to the diagram. b Clustering and principal coordinates analysis of the PanPhlAn-detected F. nucleatum strains. The analysis is performed on the gene presence–absence profiles of F. nucleatum pangenome. Points are colored by genomic-content cluster (“Methods” and Supplementary Fig. 10).

Similar articles

Cited by

References

    1. Quirynen M, Herrera D, Teughels W, Sanz M. Implant therapy: 40 years of experience. Periodontol. 2000. 2014;66:7–12. doi: 10.1111/prd.12060. - DOI - PubMed
    1. Darcey J, Eldridge D. Fifty years of dental implant development: a continuous evolution. Dent. Hist. 2016;61:75–92. - PubMed
    1. Buser D, Sennerby L, De Bruyn H. Modern implant dentistry based on osseointegration: 50 years of progress, current trends and open questions. Periodontol. 2000. 2017;73:7–21. doi: 10.1111/prd.12185. - DOI - PubMed
    1. Block MS. Dental implants: the last 100 years. J. Oral Maxillofac. Surg. 2018;76:11–26. doi: 10.1016/j.joms.2017.08.045. - DOI - PubMed
    1. Albrektsson T, et al. Is marginal bone loss around oral implants the result of a provoked foreign body reaction? Clin. Implant Dent. Relat. Res. 2014;16:155–165. doi: 10.1111/cid.12142. - DOI - PubMed

Publication types