. 2020 Oct 30;6(1):49.
doi: 10.1038/s41522-020-00158-4.

Association of a dysbiotic oral microbiota with the development of focal lymphocytic sialadenitis in IκB-ζ-deficient mice

Affiliations

Association of a dysbiotic oral microbiota with the development of focal lymphocytic sialadenitis in IκB-ζ-deficient mice

Junho Lee et al. NPJ Biofilms Microbiomes. .

Abstract

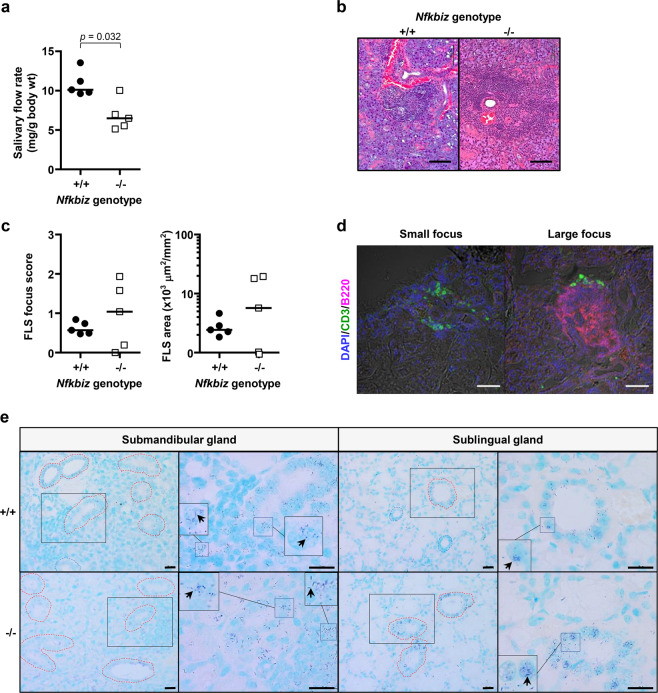
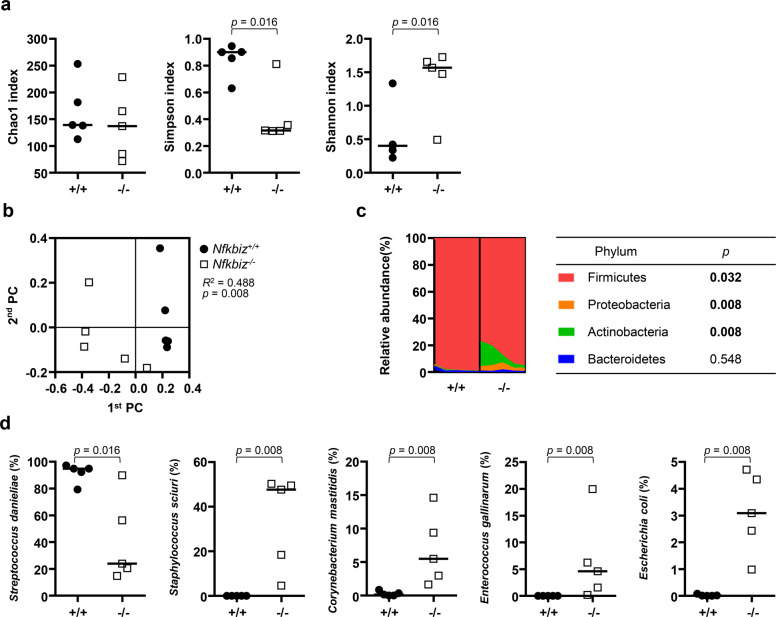
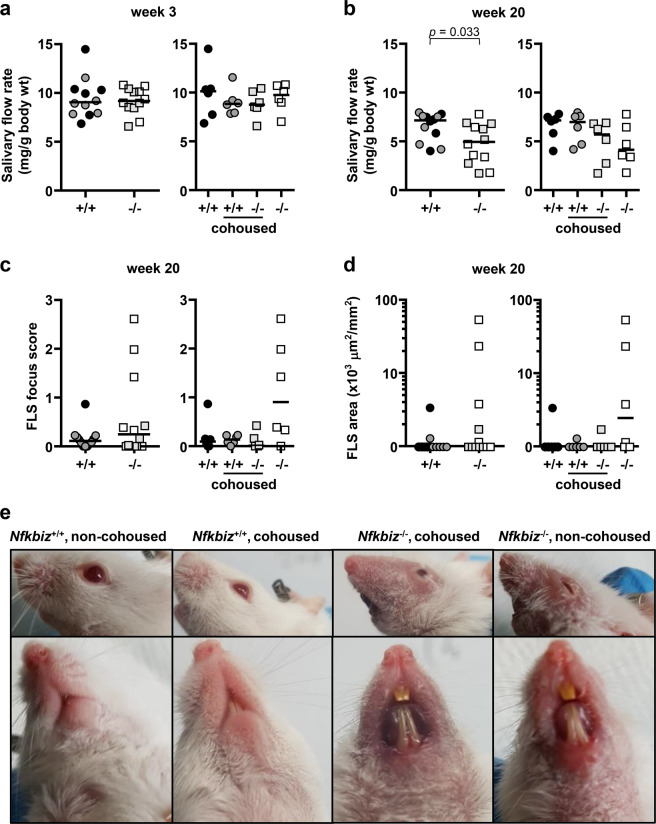
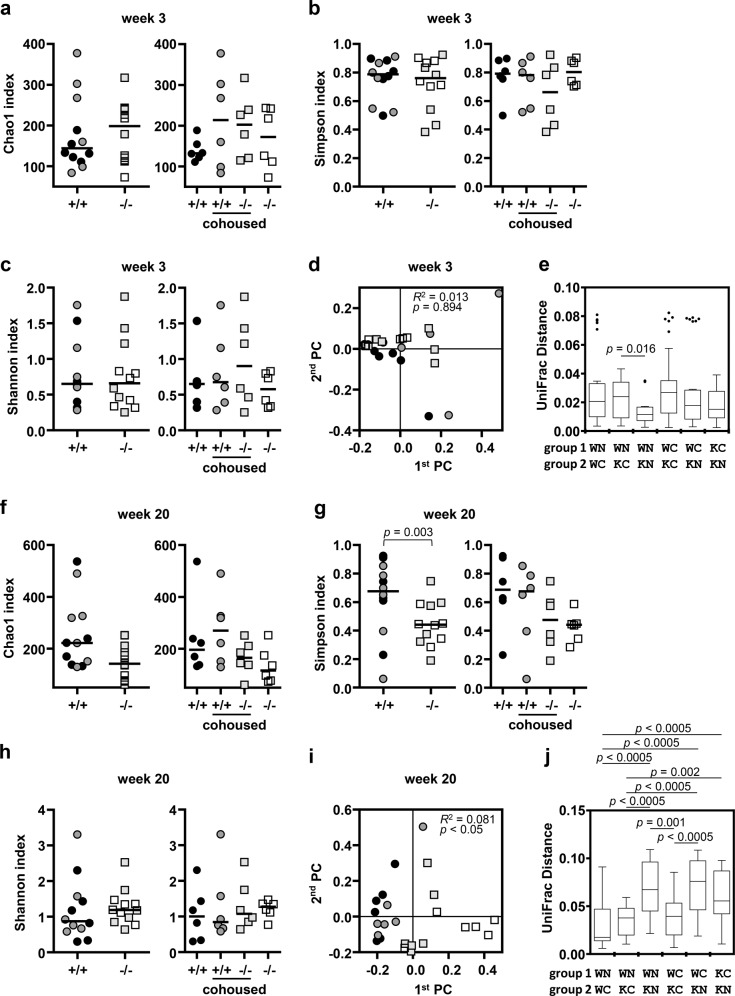
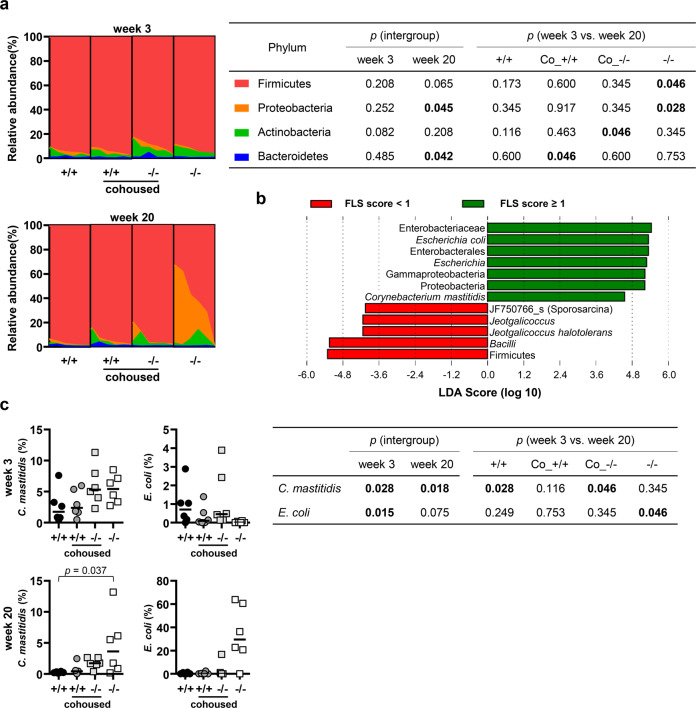
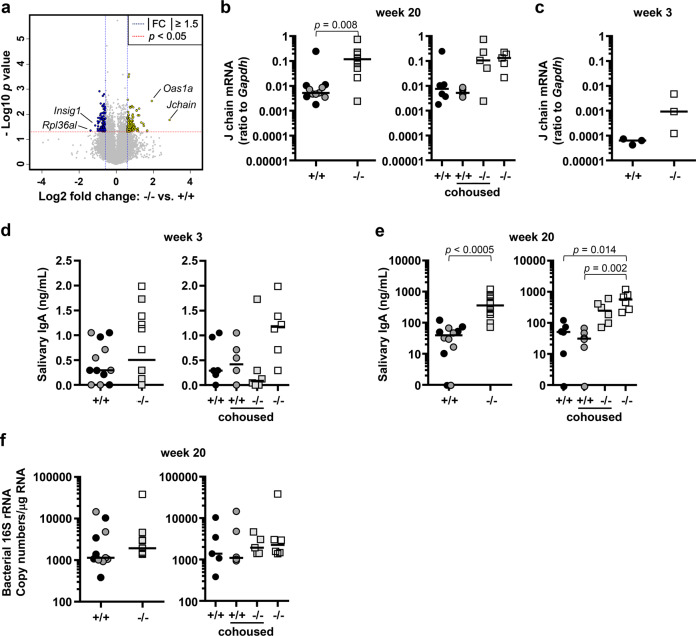
Mice lacking IκB-ζ, a protein encoded by the Nfkbiz gene, spontaneously develop a Sjögren's syndrome-like disease involving the lachrymal glands, but no salivary gland symptoms have been reported. We found that Nfkbiz-/- female mice presented a significantly reduced salivary flow rate, focal lymphocytic sialadenitis (FLS), and a dysbiotic oral microbiota at week 24. To dissect the contributions of genetic and environmental factors to the salivary gland phenotype, Nfkbiz+/+ and Nfkbiz-/- mice were cohoused after weaning and evaluated at week 20. Cohousing alleviated the salivary gland phenotype of Nfkbiz-/- mice but did not induce any disease phenotype in Nfkbiz+/+ mice. Additionally, the oral microbiota in the cohoused mice was synchronized toward that in Nfkbiz+/+ mice. In conclusion, IκB-ζ-deficient mice developed hyposalivation and FLS, in which a dysbiotic oral microbiota played an important role. This finding suggests that the dysbiotic oral microbiota could be a therapeutic target.


Conflict of interest statement

The authors declare no competing interests.

Figures

Fig. 1
Fig. 1. Distinct salivary gland phenotype of Nfkbiz−/− mice.
Nfkbiz+/+ and Nfkbiz−/− female mice were kept in separate cages after weaning and were analyzed at 24 weeks. a The salivary flow rate was measured after the injection of pilocarpine. Cross bars in the graph represent the median. P value was determined by the Mann–Whitney U-test. b Representative images of H&E-stained sections of the submandibular glands from Nfkbiz+/+ and Nfkbiz−/− mice. Scale bars, 100 μm. c Focal lymphocytic sialadenitis (FLS) score and area expressed as the number of foci per 4 mm2 and μm2/mm2, respectively, were calculated by counting the number of foci and measuring the size of each section. d Representative images of FLS foci stained with anti-CD3 and anti-B220 antibodies. Scale bars, 100 μm. e The sections of the salivary glands were subjected to in situ hybridization (ISH) using a universal probe. Representative areas with bacterial infection are shown. Arrows indicate representative ISH signals in violet color and the shape of rod or cocci. Red dotted line, duct with bacterial infection. Blue dotted line, duct without infection. Scale bars, 20 μm.
Fig. 2
Fig. 2. Dysbiosis of the oral microbiota in Nfkbiz−/− mice.
Oral bacterial communities collected using cotton swabs were analyzed by high-throughput sequencing of the 16S rRNA gene. a The species richness, evenness, and diversity of communities were estimated by the Chao1, Simpson, and Shannon indexes, respectively. b Principal coordinates analysis (PCoA) was performed using the generalized UniFrac distance metric with normalization for read counts. P value was determined by permutational multivariate analysis of variance (PERMANOVA). c Composition of the oral microbiota at the phylum level. Phyla with mean relative abundances ≥ 1% are shown. d Relative abundances of the top five species. P values were determined by the Mann–Whitney U-test. None of the P values passed the Benjamini–Hochberg correction.
Fig. 3
Fig. 3. Unidirectional effect of cohousing on the salivary gland phenotype of Nfkbiz−/− mice.
Nfkbiz+/+ and Nfkbiz−/− female mice were randomly divided into two groups, namely, non-cohoused or cohoused, at week 3 and were analyzed at week 20. a The salivary flow rate was measured after the injection of pilocarpine at week 3 before cohousing. b The salivary flow rates were measured again at week 20. c Focal lymphocytic sialadenitis (FLS) scores expressed as the number of foci per 4 mm2 were calculated by counting the number of foci and measuring the size of each section. d FLS areas were calculated by measuring the sizes of foci and each section. ad Data are presented by genotype (left) or by genotype and housing condition (right). Crossbars in the graphs represent the median. P value was determined by the Mann–Whitney U-test. e The periocular and perioral inflammation in 20-week-old Nfkbiz−/− mice was photographed.
Fig. 4
Fig. 4. Asymmetrical effect of cohousing on the structure of the oral microbiota.
Oral bacterial communities collected at weeks 3 and 20 were analyzed by high-throughput sequencing of the 16S rRNA gene. Diversities at week 3 (ae) and week 20 (fj) are presented. The species richness, evenness, and diversity of communities were estimated by the Chao1 (a, f), Simpson (b, g), and Shannon (c, h) indexes, respectively. Data are presented by genotype (left) or by genotype and housing condition (right). Crossbars in the graph represent the median. P value was determined by the Mann–Whitney U-test. Principal coordinates analysis (PCoA) was performed using the generalized UniFrac distance metric (d, i). P values were determined by PERMANOVA. Intergroup UniFrac distances are presented with box-and-whisker plots in which a box is drawn from the first quartile, median, and third quartile, and whiskers are drawn from the minimum and maximum (e, j). Several outliers are presented as dots. WN wild-type_noncohoused, WC wild-type_cohoused, KN knock-out_noncohoused, KC knock-out_cohoused. P values were determined by the Kruskal–Wallis test followed by the Bonferroni post hoc method.
Fig. 5
Fig. 5. Asymmetrical effect of cohousing on the composition of the oral microbiota.
Oral bacterial communities collected at weeks 3 and 20 were analyzed by high-throughput sequencing of the 16S rRNA gene. a The compositions of phyla with mean relative abundances ≥ 1% at weeks 3 and 20 are presented. P values for intergroup differences were obtained by the Kruskal–Wallis test. P values for differences between weeks 3 and 20 were obtained by Wilcoxon’s signed rank test. b Taxa associated with FLS score ≥ 1 were determined by linear discriminant analysis effect size (LEfSe) analysis. c The relative abundances of species associated with FLS score ≥ 1 at weeks 3 and 20 are depicted. Crossbars in the graphs represent the median. P values for intergroup differences were obtained by the Kruskal–Wallis test. P values for differences between weeks 3 and 20 were obtained by the Wilcoxon signed rank test. None of the P values passed the Benjamini–Hochberg correction.
Fig. 6
Fig. 6. Increased Jchain expression and salivary IgA secretion in Nfkbiz−/− mice.
Saliva and salivary glands were used to measure the levels of sIgA and Jchain, respectively. a RNA samples extracted from the salivary glands of 20-week-old noncohoused Nfkbiz+/+ and Nfkbiz−/ mice (n = 2 per group) were subjected to whole-transcriptome analysis using microarrays. The results are presented as a volcano plot. b Expression levels of Jchain mRNA in the salivary glands at week 20 were determined by qRT-PCR. c Expression levels of Jchain mRNA in the salivary glands obtained from six additionally sacrificed 3-week-old mice were determined by qRT-PCR. d, e The concentrations of sIgA in saliva samples collected at weeks 3 and 20 were measured by ELISA. f Expression levels of bacterial 16S rRNA in the salivary glands at week 20 were determined by qRT-PCR. Crossbars in the graphs represent the median. P values were determined by the Mann–Whitney U-test and Kruskal–Wallis test followed by post hoc Bonferroni correction.

Similar articles

Cited by

References

    1. Mariette X, Criswell LA. Primary Sjögren’s syndrome. N. Engl. J. Med. 2018;378:931–939. doi: 10.1056/NEJMcp1702514. - DOI - PubMed
    1. Jonsson R, Brokstad KA, Jonsson MV, Delaleu N, Skarstein K. Current concepts on Sjögren’s syndrome—classification criteria and biomarkers. Eur. J. Oral Sci. 2018;126:37–48. doi: 10.1111/eos.12536. - DOI - PMC - PubMed
    1. Stefanski AL, et al. The diagnosis and treatment of Sjögren’s syndrome. Dtsch. Arztebl. Int. 2017;114:354–361. - PMC - PubMed
    1. Okuma A, et al. Enhanced apoptosis by disruption of the STAT3-IκB-ζ signaling pathway in epithelial cells induces Sjögren’s syndrome-like autoimmune disease. Immunity. 2013;38:450–460. doi: 10.1016/j.immuni.2012.11.016. - DOI - PubMed
    1. Muta T. IkappaB-zeta: an inducible regulator of nuclear factor-kappaB. Vitam. Horm. 2006;74:301–316. doi: 10.1016/S0083-6729(06)74012-2. - DOI - PubMed

Publication types