. 2020 Oct 30;11(1):5497.
doi: 10.1038/s41467-020-19152-7.

A role of oligodendrocytes in information processing

Affiliations

A role of oligodendrocytes in information processing

Sharlen Moore et al. Nat Commun. .

Abstract

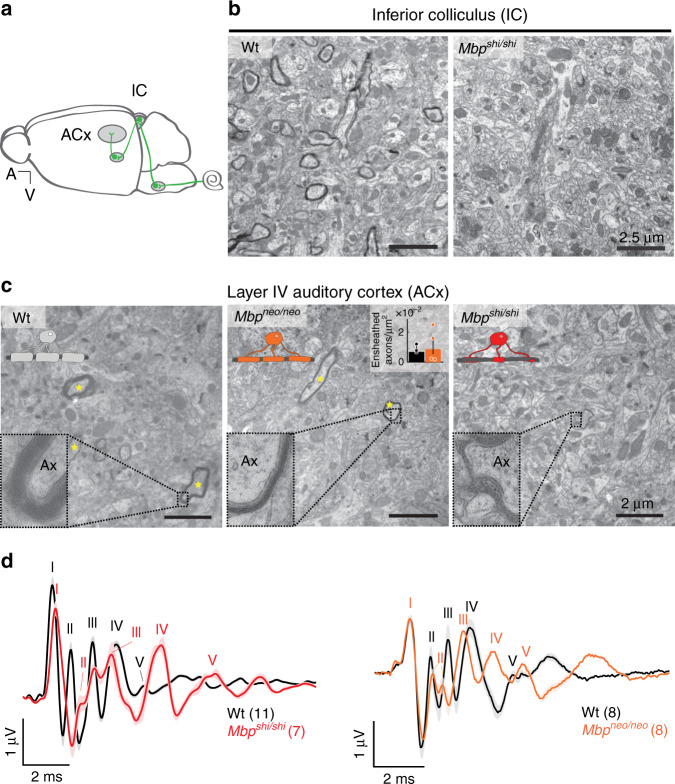
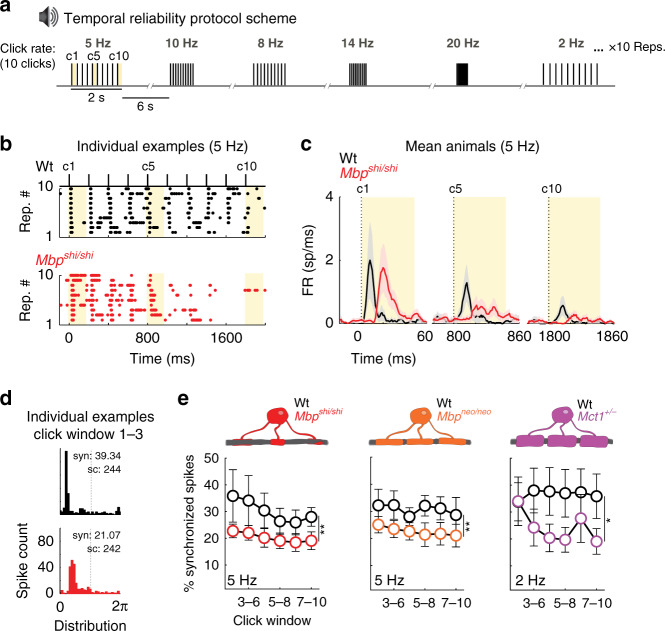
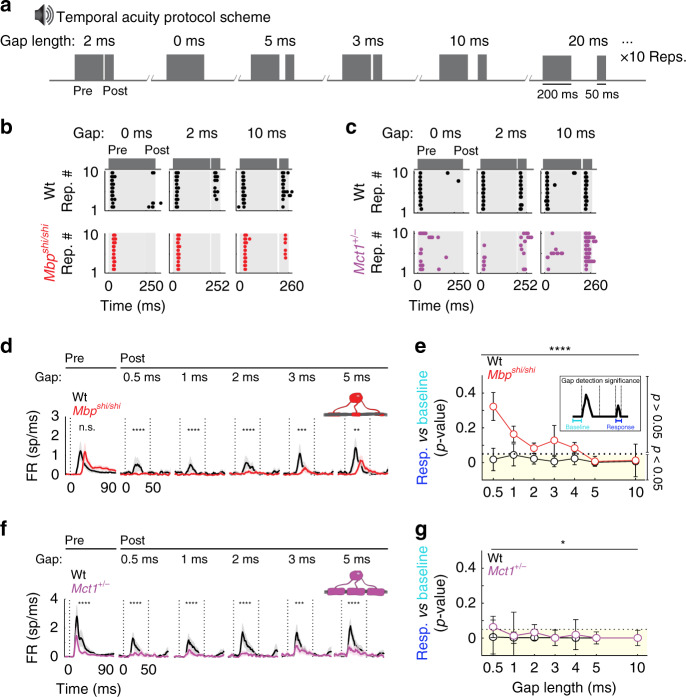
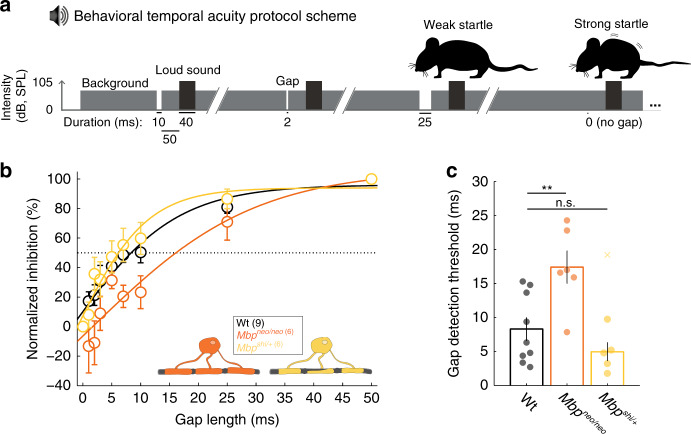
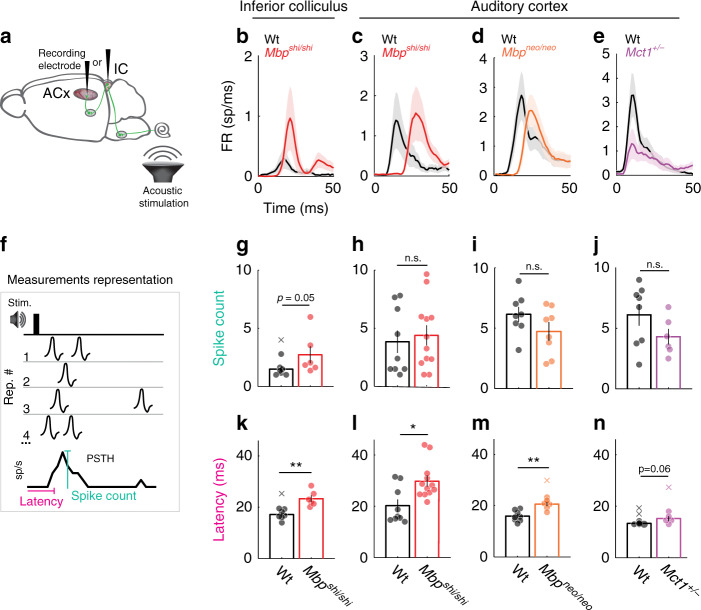
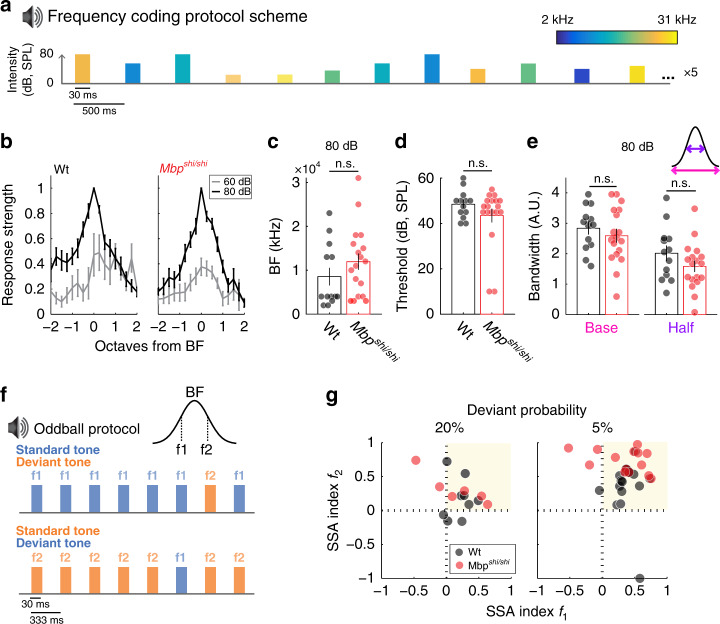
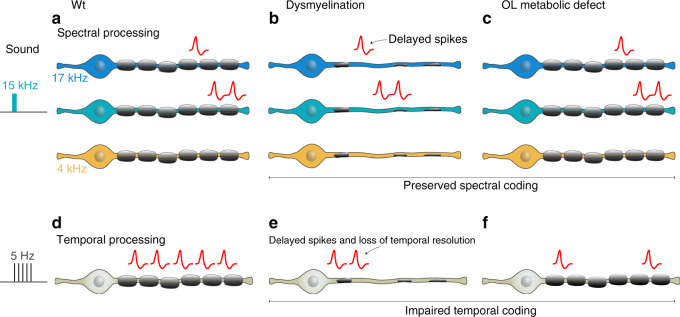
Myelinating oligodendrocytes enable fast propagation of action potentials along the ensheathed axons. In addition, oligodendrocytes play diverse non-canonical roles including axonal metabolic support and activity-dependent myelination. An open question remains whether myelination also contributes to information processing in addition to speeding up conduction velocity. Here, we analyze the role of myelin in auditory information processing using paradigms that are also good predictors of speech understanding in humans. We compare mice with different degrees of dysmyelination using acute multiunit recordings in the auditory cortex, in combination with behavioral readouts. We find complex alterations of neuronal responses that reflect fatigue and temporal acuity deficits. We observe partially discriminable but similar deficits in well myelinated mice in which glial cells cannot fully support axons metabolically. We suggest a model in which myelination contributes to sustained stimulus perception in temporally complex paradigms, with a role of metabolically active oligodendrocytes in cortical information processing.


Conflict of interest statement

The authors declare no competing interests.

Figures

Fig. 1
Fig. 1. Ensheathment profiles along the auditory system in normal and dysmyelinated models.
a Scheme illustrating the auditory pathway with emphasis on the location of the inferior colliculus (IC) and auditory cortex (ACx). b Electron microscopy images of the IC of a Wt mouse (left panel) showing sparse compact myelin, and an Mbpshi/shi mouse (right panel), lacking electro-dense compact myelin. c Electron microscopy images of the auditory cortex of Wt (left), Mbpshi/shi (middle), and Mbpneo/neo mouse (right). Properly ensheathed axons in the ACx are marked with yellow asterisks. Insets show details of the myelin sheath of axons (Ax) from the respective image. Mbpshi/shi axons (right) show lack of compact myelin, while Mbpneo/neo axons (middle) show thinner compact myelin than Wt. The inset plot (middle) shows the quantification of the number of ensheathed axons per area in Wt (black, n = 3) and Mbpneo/neo (orange, n = 4), (two-sided Wilcoxon rank-sum test, P = 0.73, t = 0.434). The bar graph show the mean of all animals quantified (10–15 images per mouse). d Auditory brainstem-response (ABR) potentials. Left: group mean traces of control (black, n = 11). Pooled together seven Mbp+/+ and four Mbpshi/+, see Supplementary Fig. S2E for significances, and Mbpshi/shi (red, n = 7) mice. Each one of the five peaks (I–V) can be attributed to activity at a different station along the auditory brainstem (see Supplementary Fig. S2Aii). Responses in Mbpshi/shi mice were delayed at all auditory stations. Wave II appears divided and merged with wave III. Right: group mean traces of control (black, n = 8) and Mbpneo/neo (orange, n = 8) mice. Responses in Mbpneo/neo mice were delayed at all auditory stations. Scale bars: 2.5 µm (b), 2 µm (c). Source data are provided as a Source Data file.
Fig. 2
Fig. 2. Temporal reliability is affected in mice with either dysmyelination or an oligodendrocyte-specific metabolic impairment.
a Schematic of the click-rate-tracing protocol used to test temporal reliability. Blocks of ten clicks are played at different rates in random order. Each rate is repeated ten times. Analysis in c focuses on the highlighted (yellow) clicks 1, 5, and 10 (c1, c5, and c10). b Example raster plot of ACx responses (each dot = 1 spike) to ten clicks at 5 Hz across the ten stimulus repetitions in a Wt (upper, black) and an Mbpshi/shi mouse (lower, red). Mbpshi/shi animals show a steeper decay on spiking activity across clicks compared to Wt. c Mean peristimulus time histogram (PSTH) of responses to clicks 1, 5, and 10, at 5 Hz for Wt (black, n = 10) and Mbpshi/shi (red, n = 13) animals. The thick line shows the mean of all recorded animals and the shaded area depicts the S.E.M. Click onset is indicated by dashed lines. While responses to the first click are similar in amplitude in Wt and Mbpshi/shi animals (with the expected delay in Mbpshi/shi), a strong reduction of response strength is seen in Mbpshi/shi mice with increasing clicks. d Individual examples of spike synchrony plots for Wt (black, top) and Mbpshi/shi (red, bottom) were taken from the first sliding window (see panel e clicks 2–5). Syn: synchrony %, sc: spike count. e Quantification of spike synchrony in sliding windows of four clicks (clicks 2–5, 3–6, 4–7, 5–8, 6–9, and 7–10). Onset responses to click 1 were excluded. Leftmost: significant reduction in spike synchrony between Mbpshi/shi mice (red, n = 11) and Wt (black, n = 5 mice) at 5 Hz (one-way ANOVA, F(1,76) = 10.17, P = 0.002). Middle: significant reduction also seen between Mbpneo/neo mice (orange, n = 6 mice) and Wt (black, n = 8 mice) at 5 Hz (one-way ANOVA, F(1,86) = 10.94, P = 0.0014). Right: significant difference between Mct1+/− mice (purple, n = 6 mice) and Wt (black, n = 8 mice) at 2 Hz (one-way ANOVA, F(1,78) = 6.74, P = 0.011). Source data are provided as a Source Data file.
Fig. 3
Fig. 3. Cortical temporal acuity is severely impaired with central nervous system (CNS) dysmyelination and partially impaired upon axoglial metabolic reduction.
a Temporal acuity test: gap-detection protocol. A pregap broadband noise (BBN, 200 ms) followed by a silent gap (0–50 ms, ten repetitions each) and post-gap BBN (50 ms). b Example for Wt (upper, black) and Mbpshi/shi (lower, red): sound-evoked (gray patch) ACx spikes (dots) before/after gaps of 0-ms (left), 2-ms (center), and 10-ms (right) length, across ten repetitions. c Same as in b for the Mct1 (purple). d Average peristimulus time histogram (PSTH) for Wt (black, n = 12) and Mbpshi/shi (red, n = 14). Left to right: pregap responses followed by post-gap responses for 0.5–5-ms gaps. Effect of group for post-gap, but not pregap, responses (two-way ANOVAs [F(1,462) = 0.53, P = 0.46], [F(1,502) = 24.47, P = 1.03 × 10−6], [F(1,502) = 20.48, P = 7.54 × 10−6], [F(1,502) = 24.06, P = 1.26 × 10−6], [F(1,502) = 14.38, P = 0.0002], and [F(1,502) = 7.62, P = 0.006]. e Quantification of significance (median p value between baseline and post-gap response/recording, see inset). Lower detection in Mbpshi/shi (red, n = 20 sites, 14 animals) than Wt (black, n = 15 sites, 12 animals) for short gaps, group effect (two-sided Kruskal–Wallis, F(1,214) = 15.81, P = 7 × 10−5). Dotted line: threshold at 0.05. Yellow shadow: significant gap detection. f Same as d for Mct1+/− (purple, n = 6) and Wt (black, n = 8). Group effect for all responses (two-way ANOVAs [F(1,252) = 30.06, P < 0.0001], [F(1, 313) = 24.42, P = 1.26 × 10−6], [F(1,313) = 15.74, P = 9.02 × 10−5], [F(1,313) = 36.65, P = 4.03 × 10−9], [F(1,313) = 10.53, P = 0.001], and [F(1,313) = 21.3, P = 5.73 × 10−6]. g Same as e for Mct1+/− mice (purple, n = 9 sites, six animals) and Wt mice (black, n = 13 sites, eight animals). Group effect (two-sided Kruskal–Wallis, F(1,151) = 8.83, P = 0.0027). d, f Dotted lines: sound onset and offset. e, g Circles: median/group/gap length, and error bars: S.E.M. Source data are provided as a Source Data file.
Fig. 4
Fig. 4. Behavioral temporal acuity is impaired by central nervous system (CNS) dysmyelination.
a Schematic of the auditory startle reflex (ASR) sound protocol. Constant background broadband noise (BBN, 70 dB) interrupted by a startle noise at random times (105 dB, 40 ms), occasionally preceded by a silent gap of varying length. All gaps presented were followed by 50-ms background sound before the startle appearance. The silent gap, if detected, diminished the startle effect of the loud noise. Each gap-startle combination was repeated ten times. b The percentage of ASR inhibition elicited by the different gaps showed a strong relationship between the gap length and the startle inhibition. Mbpneo/neo (orange, n = 6) but not Mbpshi/+ mice (with a 50% reduction in Mbp, yellow, n = 6) showed impaired inhibition of the ASR. Dotted line: threshold at 50% inhibition used for statistical analysis in c. c Gap-detection threshold is increased in Mbpneo/neo mice (two-sided Wilcoxon rank-sum test, P = 0.0048, t = 3.814), but not Mbpshi/+ (two-sided Wilcoxon rank-sum test, P = 0.36, t = −2.485; outlier depicted with a cross), compared to Wt (black, n = 9) animals. All graphs depict the mean and S.E.M. and individual data points are individual animals. Outliers are depicted with an x and were not considered in the statistical analysis. Source data are provided as a Source Data file.
Fig. 5
Fig. 5. Responses to single sound stimuli in IC and ACx of dysmyelinated models are abnormal only in latency.
a Recording locations (inferior colliculus or cortex). b Peristimulus time histogram (PSTH) of responses to a click sound recorded in the IC for Wt (black, n = 6) and Mbpshi/shi (red, n = 7) mice. Delayed Mbpshi/shi responses. ce Same as in b but for ACx recordings for Mbpshi, Mbpneo, and Mct1 lines, respectively. c Response delay in Mbpshi/shi and d Mbpneo/neo mice (orange), and decrease in Mct1+/− (purple). f PSTH spike count: spike sum across ten trials in 1-ms time windows (teal). Latency: time when PSTH surpassed 1.5× baseline (pink). g IC response strength in Mbpshi/shi mice was significantly increased (two-sided Wilcoxon rank-sum test, P = 0.05, t = 1.989). hj Auditory cortex response strength was unchanged for all mouse mutants (Mbpshi/shi, Mbpneo/neo, and Mct1+/−, respectively). h Mbpshi mice (two-sided Wilcoxon rank-sum test, P = 0.72, t = 0.673; n = 9 mutants; n = 12 Wt). i Mbpneo mice (two-sided Wilcoxon rank-sum test, P = 0.17, t = −2.06; n = 8 mutants, n = 8 Wt). j Mct1 mice (two-sided Wilcoxon rank-sum test, P = 0.15, t = −2.803; n = 6 mutants; n = 8 Wt). kn Response latency was increased in Mbpshi/shi mice in both the k IC (two-sided Wilcoxon rank-sum test, P = 0.0012, t = 5.728, n = 6) and l ACx (two-sided Wilcoxon rank-sum test, P = 0.023, t = 4.887, n = 12) compared to Wt (n = 7 and n = 9, respectively). m Mbpneo/neo mice (orange, n = 8) compared to Wt (black, n = 8, two-sided Wilcoxon rank-sum test, P = 0.0012, t = 6.424), and n borderline in Mct1+/− mice (purple, n = 6; two-sided Wilcoxon rank-sum test, P = 0.06, t = 2.212). All bar plots: mean data for all animals and error bars the S.E.M. In bf, S.E.M. is the shaded area, and individual data points are individual animals. Outliers are depicted with an x and were not considered in the statistical analysis. Source data are provided as a Source Data file.
Fig. 6
Fig. 6. Frequency responses, tuning, and discrimination are not affected with dysmyelination in the ACx.
a Schematic of the tone-sweep protocol used to test tuning. Twenty-four 30-ms-long, pure tones (2–31 kHz) were played at different intensities in ten repetitions (Rep.) of each frequency-intensity combination in random order. be Basic tuning properties are not affected with dysmyelination. Wt: n = 13 recordings, ten mice. Mbpshi/shi: n = 18 recordings, 15 mice. b Normalized tuning curves for Wt (left) and Mbpshi/shi mice showing selectivity in octaves from best frequency (BF) at 60 (gray) and 80 dB (black). c Recordings from comparable rostrocaudal locations yielded comparable BFs at 80 dB (two-sided Wilcoxon rank-sum test, P = 0.25, t = 1.839) indicating normal tonotopy. d Auditory cortical thresholds were comparable between groups (two-sided Wilcoxon rank-sum test, P = 0.51, t = −1.638). e Tuning bandwidth was comparable between groups (two-sided Wilcoxon rank-sum test, P = 0.56, t = −1.148, and P = 0.21, t = −2.363 for base and half-bandwidth, respectively). f Schematic of the oddball protocol used to test stimulus-specific adaptation. Two tones differing in a Δf of 10% were presented (rate 3 Hz) with different probability. The standard tone was presented with high probability (80 or 95% of trials) and the deviant tone with low probability (20 or 5%). g Stimulus-specific adaptation indices (normalized difference between deviant and standard response) for the two tones were plotted against each other. For low deviant probabilities (Dp = 5%), indices were above 0.3, indicating that deviant responses were at least twice as large as standard. This effect diminished as the probability of the deviant sound increased. While no difference in SSA was observed between the groups at Dp = 20% (one-way ANOVA, P = 0.35, Wt: black, n = 11 recordings; Mbpshi/shi: red, n = 14 recordings), for Dp = 5%, Mbpshi/shi mice showed even more pronounced SSA (one-way ANOVA, P < 0.001; Wt: n = 9 recordings. Mbpshi/shi: n = 6 recordings). All plots represent the mean data of all recordings per group and error bars the S.E.M. and individual data points are individual animals, except for SSA, where they are recording sites. Source data are provided as a Source Data file.
Fig. 7
Fig. 7. Role of oligodendrocytes in information processing extends beyond conduction velocity regulation to energy support of axons and axonal excitability regulation.
a Schematic illustrating parallel processing of pure tones in a Wt animal. Sound presentation (left, teal, 15 kHz) activates fibers sensitive to 15 kHz (middle, teal) more strongly than fibers sensitive to 17 kHz (upper, blue, 17 kHz), and does not activate fiber sensitive to 4 kHz (lower, yellow, 4 kHz). b With dysmyelination, spectral processing is unaffected, but delayed responses are observed. c Oligodendrocyte metabolic defects affect neither the latency nor strength of responses to simple tones. d Temporal processing of continuous stimuli (i.e., presentation of clicks at 5 Hz) in a Wt animal. e Temporal processing is affected with dysmyelination beyond the increase in conduction velocity (delayed spikes). We observe loss of temporal resolution in both dysmyelination conditions and f with loss of oligodendrocyte metabolic stability.

Similar articles

Cited by

References

    1. Nave K-A, Werner HB. Myelination of the nervous system: mechanisms and functions. Annu. Rev. Cell Dev. Biol. 2014;30:503–533. doi: 10.1146/annurev-cellbio-100913-013101. - DOI - PubMed
    1. Cohen CCH, et al. Saltatory conduction along myelinated axons involves a periaxonal nanocircuit. Cell. 2020;180:311–322. doi: 10.1016/j.cell.2019.11.039. - DOI - PMC - PubMed
    1. Fünfschilling U, et al. Glycolytic oligodendrocytes maintain myelin and long-term axonal integrity. Nature. 2012;485:517–521. doi: 10.1038/nature11007. - DOI - PMC - PubMed
    1. Lee Y, et al. Oligodendroglia metabolically support axons and contribute to neurodegeneration. Nature. 2012;487:443–448. doi: 10.1038/nature11314. - DOI - PMC - PubMed
    1. Saab AS, et al. Oligodendroglial NMDA receptors regulate glucose import and axonal energy metabolism. Neuron. 2016;91:119–132. doi: 10.1016/j.neuron.2016.05.016. - DOI - PMC - PubMed

Publication types