

Genomic surveillance of COVID-19 cases in Beijing
- PMID: 33127911
- PMCID: PMC7603498
- DOI: 10.1038/s41467-020-19345-0
Genomic surveillance of COVID-19 cases in Beijing
Abstract
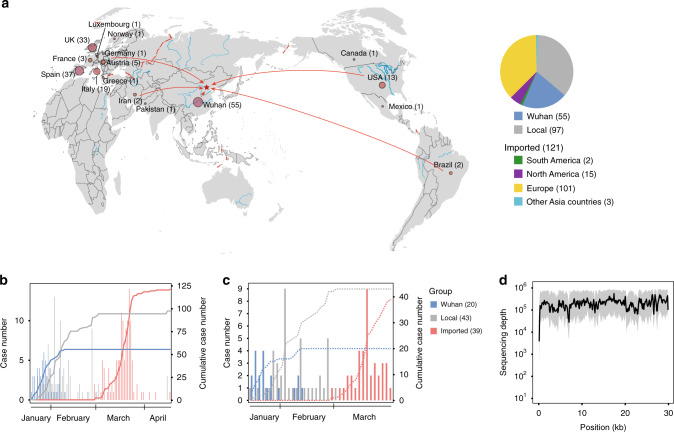
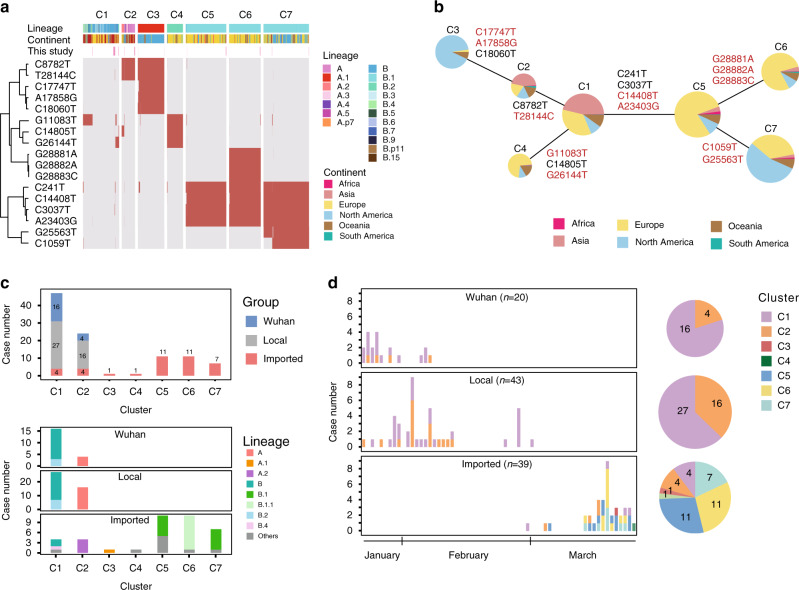
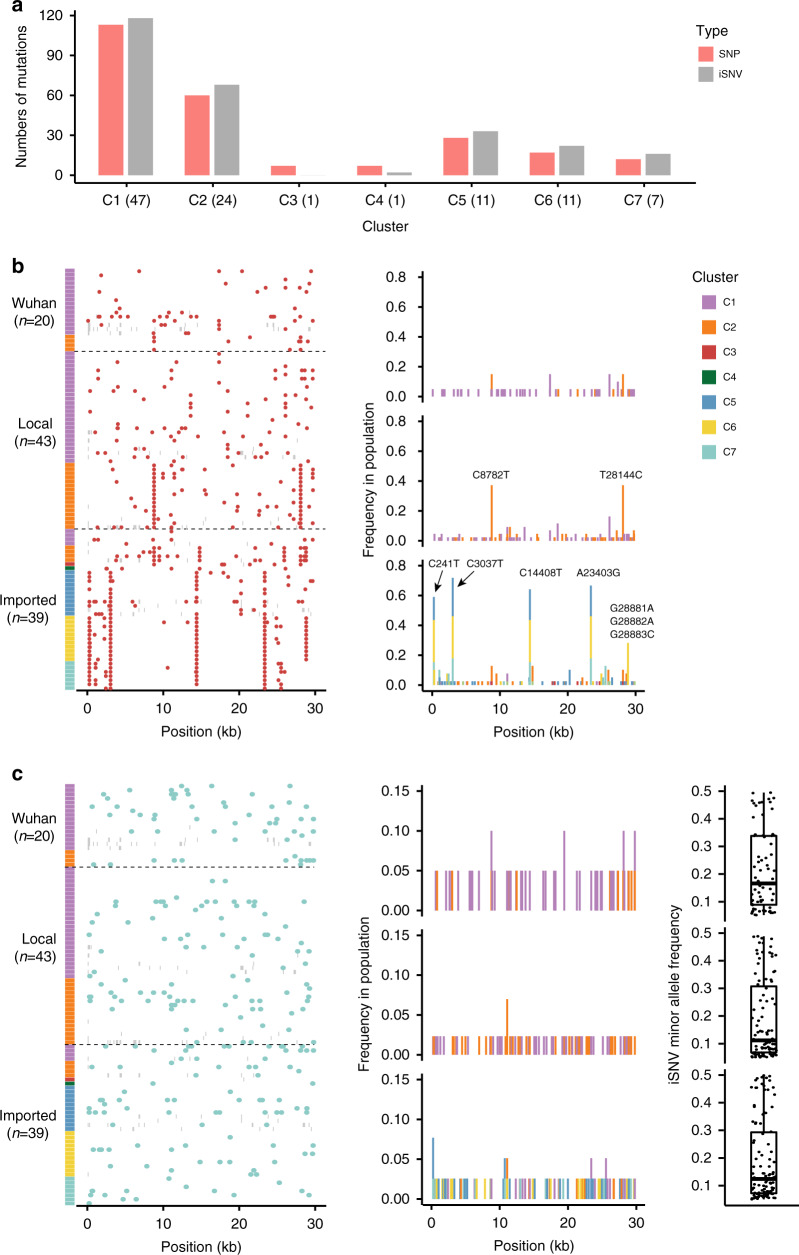
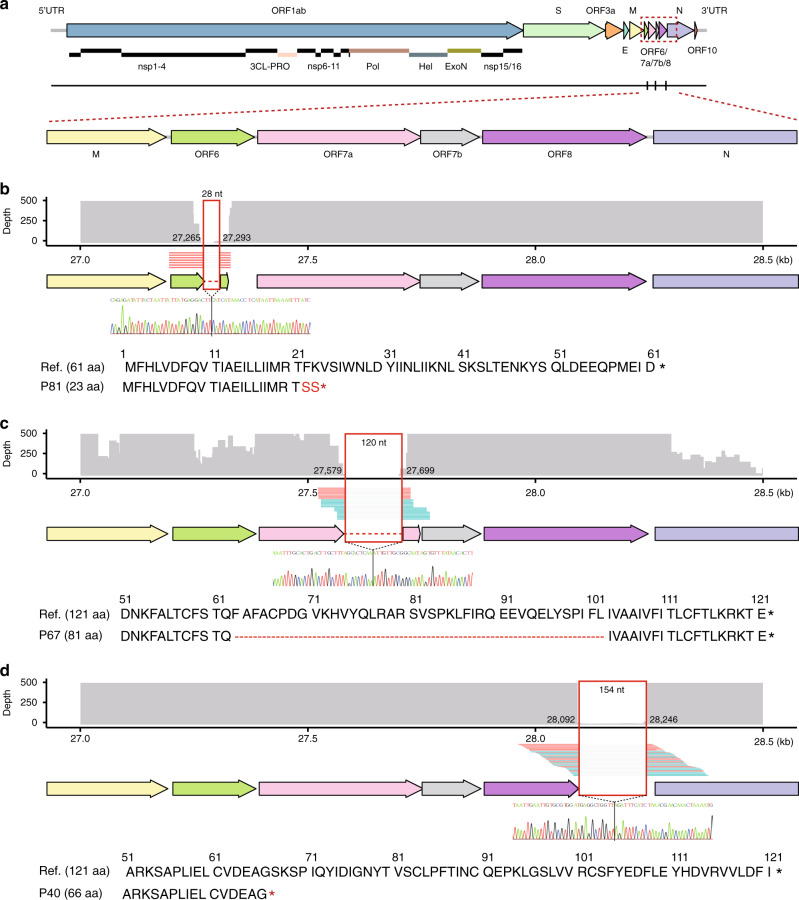
The spread of SARS-CoV-2 in Beijing before May, 2020 resulted from transmission following both domestic and global importation of cases. Here we present genomic surveillance data on 102 imported cases, which account for 17.2% of the total cases in Beijing. Our data suggest that all of the cases in Beijing can be broadly classified into one of three groups: Wuhan exposure, local transmission and overseas imports. We classify all sequenced genomes into seven clusters based on representative high-frequency single nucleotide polymorphisms (SNPs). Genomic comparisons reveal higher genomic diversity in the imported group compared to both the Wuhan exposure and local transmission groups, indicating continuous genomic evolution during global transmission. The imported group show region-specific SNPs, while the intra-host single nucleotide variations present as random features, and show no significant differences among groups. Epidemiological data suggest that detection of cases at immigration with mandatory quarantine may be an effective way to prevent recurring outbreaks triggered by imported cases. Notably, we also identify a set of novel indels. Our data imply that SARS-CoV-2 genomes may have high mutational tolerance.
Conflict of interest statement
The authors declare no competing interests.
Figures
Similar articles
-
Analysis of Genomic Characteristics and Transmission Routes of Patients With Confirmed SARS-CoV-2 in Southern California During the Early Stage of the US COVID-19 Pandemic.JAMA Netw Open. 2020 Oct 1;3(10):e2024191. doi: 10.1001/jamanetworkopen.2020.24191. JAMA Netw Open. 2020. PMID: 33026453 Free PMC article.
-
SARS-CoV-2 genomic surveillance in Taiwan revealed novel ORF8-deletion mutant and clade possibly associated with infections in Middle East.Emerg Microbes Infect. 2020 Dec;9(1):1457-1466. doi: 10.1080/22221751.2020.1782271. Emerg Microbes Infect. 2020. PMID: 32543353 Free PMC article.
-
Tracking the COVID-19 pandemic in Australia using genomics.Nat Commun. 2020 Sep 1;11(1):4376. doi: 10.1038/s41467-020-18314-x. Nat Commun. 2020. PMID: 32873808 Free PMC article.
-
Betacoronavirus Genomes: How Genomic Information has been Used to Deal with Past Outbreaks and the COVID-19 Pandemic.Int J Mol Sci. 2020 Jun 26;21(12):4546. doi: 10.3390/ijms21124546. Int J Mol Sci. 2020. PMID: 32604724 Free PMC article. Review.
-
The incidence of the novel coronavirus SARS-CoV-2 among asymptomatic patients: A systematic review.Int J Infect Dis. 2020 Sep;98:372-380. doi: 10.1016/j.ijid.2020.06.098. Epub 2020 Jul 2. Int J Infect Dis. 2020. PMID: 32623083 Free PMC article.
Cited by
-
Determinants of SARS-CoV-2 transmission to guide vaccination strategy in an urban area.Virus Evol. 2022 Mar 17;8(1):veac002. doi: 10.1093/ve/veac002. eCollection 2022. Virus Evol. 2022. PMID: 35310621 Free PMC article.
-
Genomic assessment of quarantine measures to prevent SARS-CoV-2 importation and transmission.Nat Commun. 2022 Feb 23;13(1):1012. doi: 10.1038/s41467-022-28371-z. Nat Commun. 2022. PMID: 35197443 Free PMC article.
-
Whole-Genome Sequences of SARS-CoV-2 Isolates from the Dominican Republic.Microbiol Resour Announc. 2021 Nov 24;10(47):e0095221. doi: 10.1128/MRA.00952-21. Epub 2021 Nov 24. Microbiol Resour Announc. 2021. PMID: 34817214 Free PMC article.
-
COVID-19 infection and transmission includes complex sequence diversity.PLoS Genet. 2022 Sep 8;18(9):e1010200. doi: 10.1371/journal.pgen.1010200. eCollection 2022 Sep. PLoS Genet. 2022. PMID: 36074769 Free PMC article.
-
Genetic Diversity of SARS-CoV-2 over a One-Year Period of the COVID-19 Pandemic: A Global Perspective.Biomedicines. 2021 Apr 11;9(4):412. doi: 10.3390/biomedicines9040412. Biomedicines. 2021. PMID: 33920487 Free PMC article.
References
-
- WHO Coronavirus Disease (COVID-19) Dashboard. https://covid19.who.int/ (2020).
MeSH terms
LinkOut - more resources
Full Text Sources
Miscellaneous
