

Reduced monoaminergic nuclei MRI signal detectable in pre-symptomatic older adults with future memory decline
- PMID: 33127923
- PMCID: PMC7603335
- DOI: 10.1038/s41598-020-71368-1
Reduced monoaminergic nuclei MRI signal detectable in pre-symptomatic older adults with future memory decline
Abstract
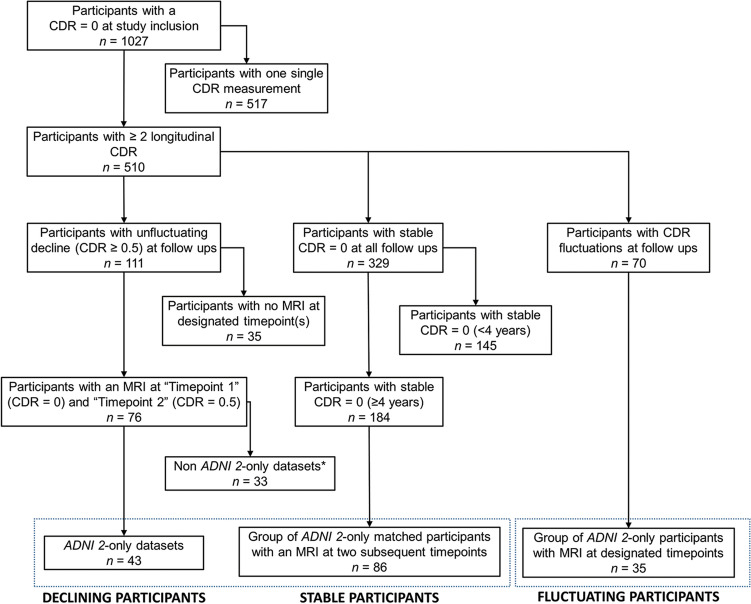
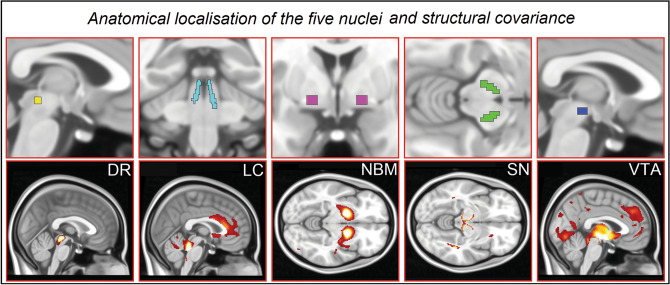
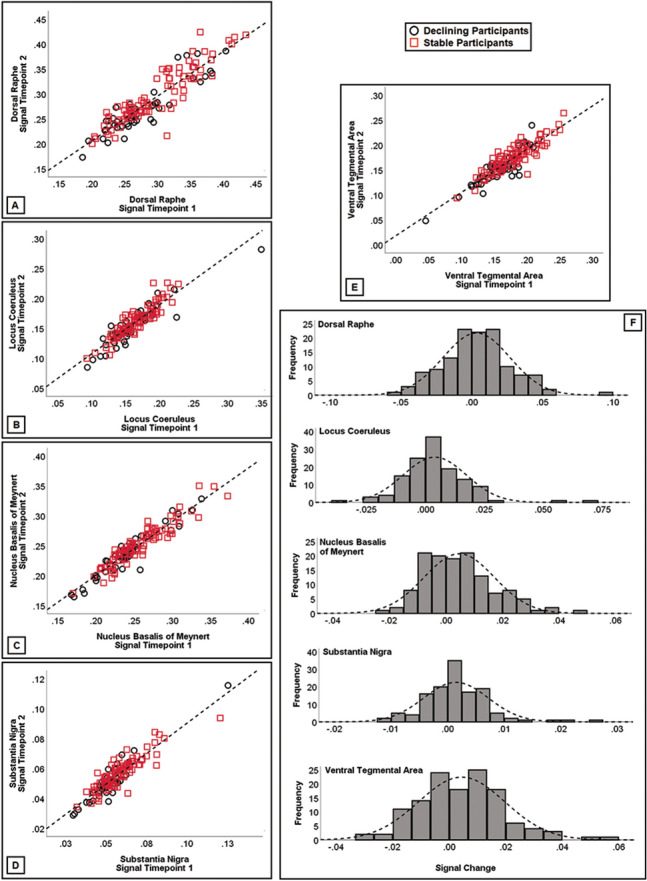
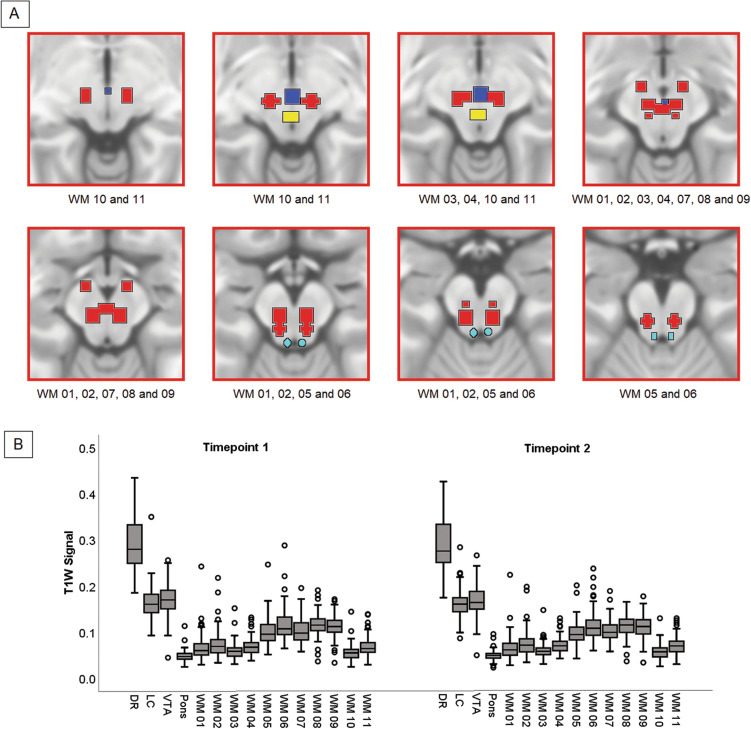
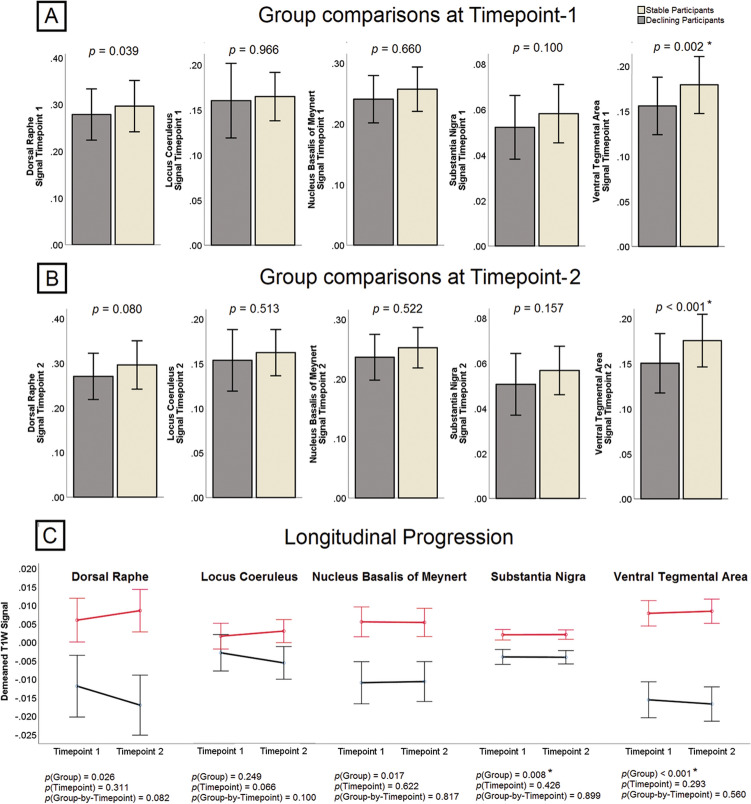
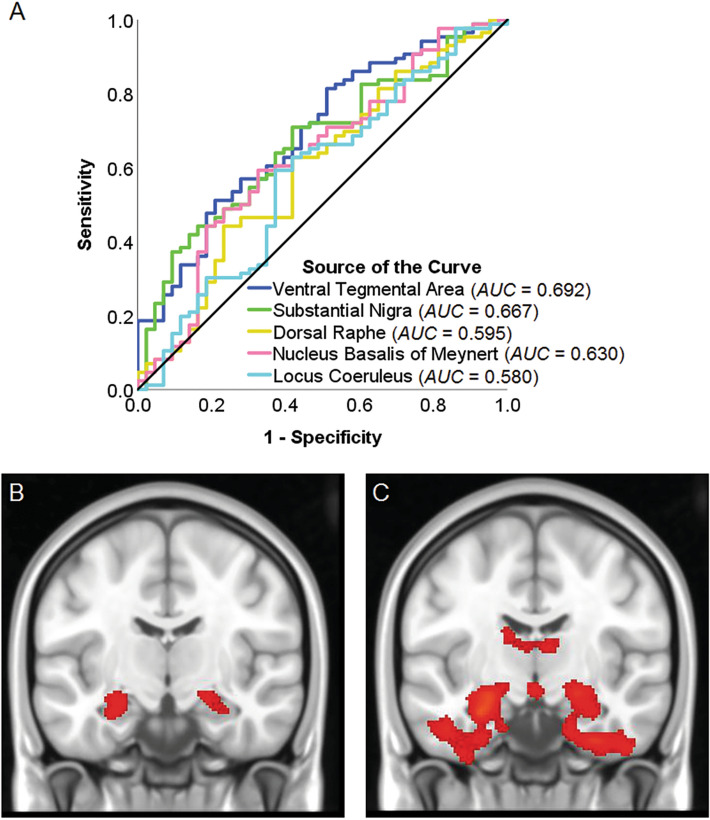
Evidence from murine models and human post-mortem studies indicates that monoaminergic nuclei undergo degeneration at the pre-symptomatic stage of Alzheimer's disease (AD). Analysing 129 datasets from the Alzheimer's Disease Neuroimaging Initiative (ADNI) and relying on the Clinical Dementia Rating as group-defining instrument, we hypothesised that the MRI signal of monoaminergic nuclei would be a statistically significant predictor of memory decline in participants initially recruited in ADNI as healthy adults. As opposed to a group of cognitively stable participants, participants developing memory decline had reduced signal in the ventral tegmental area at baseline, before any evidence of functional decline emerged. These findings indicate that monoaminergic degeneration predates the onset of memory decline in an AD-centred initiative, with a crucial involvement of very-early changes of a dopaminergic region. This translates into potential informative avenues for pharmacological treatment of pre-symptomatic AD.
Conflict of interest statement
The authors declare no competing interests.
Figures
Similar articles
-
Longitudinal structural cerebral changes related to core CSF biomarkers in preclinical Alzheimer's disease: A study of two independent datasets.Neuroimage Clin. 2018 Apr 16;19:190-201. doi: 10.1016/j.nicl.2018.04.016. eCollection 2018. Neuroimage Clin. 2018. PMID: 30023169 Free PMC article.
-
Cerebrospinal fluid synaptosomal-associated protein 25 is a key player in synaptic degeneration in mild cognitive impairment and Alzheimer's disease.Alzheimers Res Ther. 2018 Aug 16;10(1):80. doi: 10.1186/s13195-018-0407-6. Alzheimers Res Ther. 2018. PMID: 30115118 Free PMC article.
-
Volume and Connectivity of the Ventral Tegmental Area are Linked to Neurocognitive Signatures of Alzheimer's Disease in Humans.J Alzheimers Dis. 2018;63(1):167-180. doi: 10.3233/JAD-171018. J Alzheimers Dis. 2018. PMID: 29578486
-
Association Between Anticholinergic Medication Use and Cognition, Brain Metabolism, and Brain Atrophy in Cognitively Normal Older Adults.JAMA Neurol. 2016 Jun 1;73(6):721-32. doi: 10.1001/jamaneurol.2016.0580. JAMA Neurol. 2016. PMID: 27088965 Free PMC article.
-
Sex differences in functional and molecular neuroimaging biomarkers of Alzheimer's disease in cognitively normal older adults with subjective memory complaints.Alzheimers Dement. 2018 Sep;14(9):1204-1215. doi: 10.1016/j.jalz.2018.05.014. Epub 2018 Jul 7. Alzheimers Dement. 2018. PMID: 30201102 Review.
Cited by
-
Upregulation of Ca2+-binding proteins contributes to VTA dopamine neuron survival in the early phases of Alzheimer's disease in Tg2576 mice.Mol Neurodegener. 2022 Nov 25;17(1):76. doi: 10.1186/s13024-022-00580-6. Mol Neurodegener. 2022. PMID: 36434727 Free PMC article.
-
Dopamine neuron degeneration in the Ventral Tegmental Area causes hippocampal hyperexcitability in experimental Alzheimer's Disease.Mol Psychiatry. 2024 May;29(5):1265-1280. doi: 10.1038/s41380-024-02408-9. Epub 2024 Jan 16. Mol Psychiatry. 2024. PMID: 38228889 Free PMC article.
-
Low serum serotonin is associated with functional decline, mild behavioural impairment and brain atrophy in dementia-free subjects.Brain Commun. 2025 Jan 9;7(1):fcaf005. doi: 10.1093/braincomms/fcaf005. eCollection 2025. Brain Commun. 2025. PMID: 39816197 Free PMC article.
-
Neuromodulatory subcortical nucleus integrity is associated with white matter microstructure, tauopathy and APOE status.Nat Commun. 2024 Jun 3;15(1):4706. doi: 10.1038/s41467-024-48490-z. Nat Commun. 2024. PMID: 38830849 Free PMC article.
-
Dopaminergic deficits along the spectrum of Alzheimer's disease.Mol Psychiatry. 2025 Jul;30(7):3069-3076. doi: 10.1038/s41380-025-02913-5. Epub 2025 Jan 31. Mol Psychiatry. 2025. PMID: 39890920
References
Publication types
MeSH terms
Substances
Grants and funding
LinkOut - more resources
Full Text Sources
Medical
Research Materials
