. 2020 Oct 30;10(1):18746.
doi: 10.1038/s41598-020-75264-6.

p39-associated Cdk5 activity regulates dendritic morphogenesis

Affiliations

p39-associated Cdk5 activity regulates dendritic morphogenesis

Li Ouyang et al. Sci Rep. .

Abstract

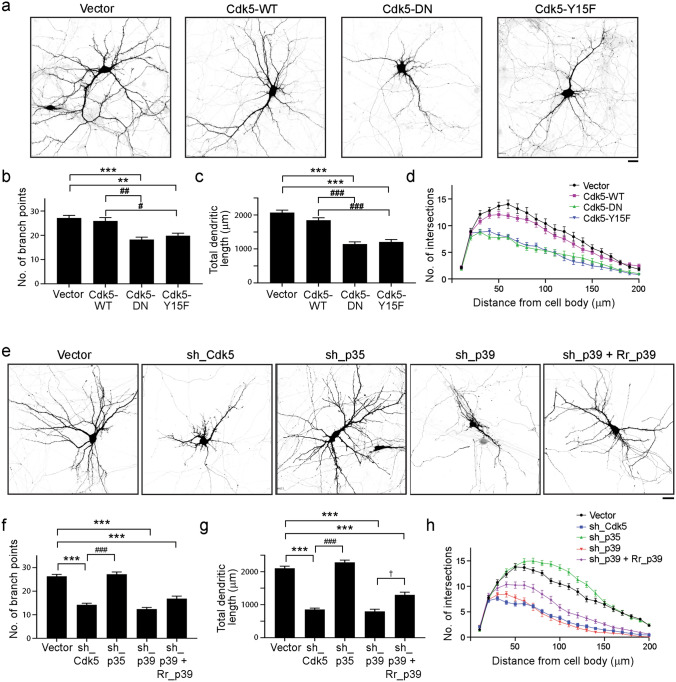
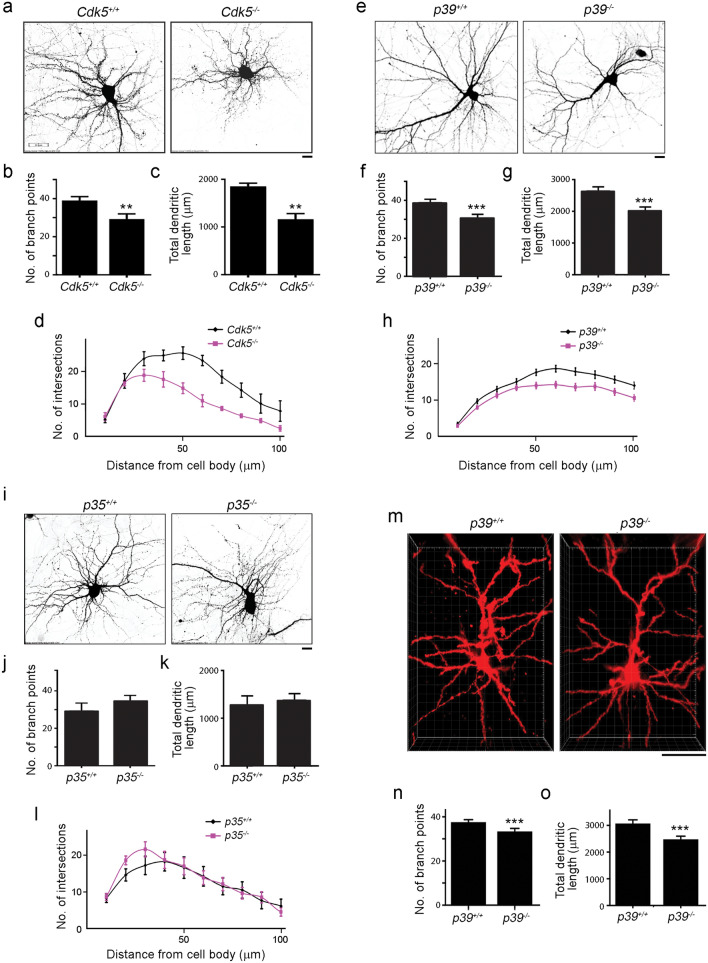
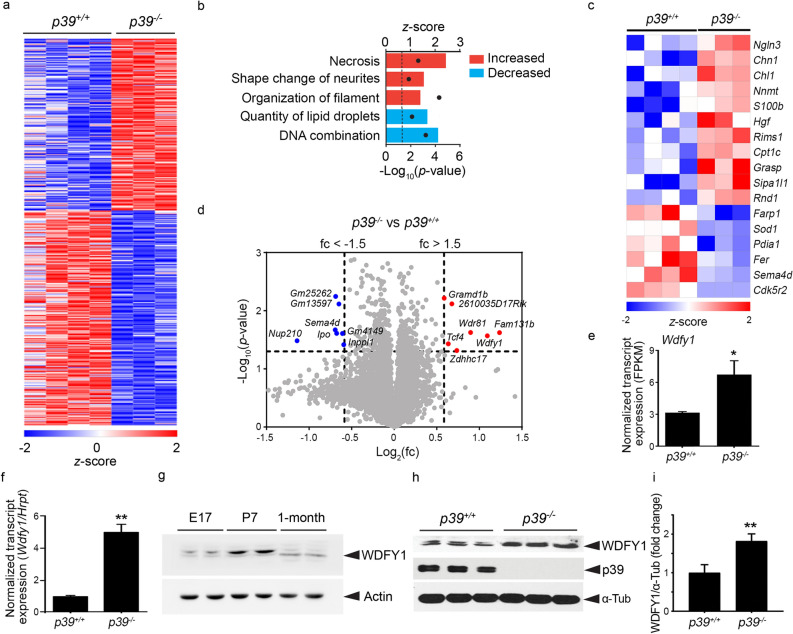
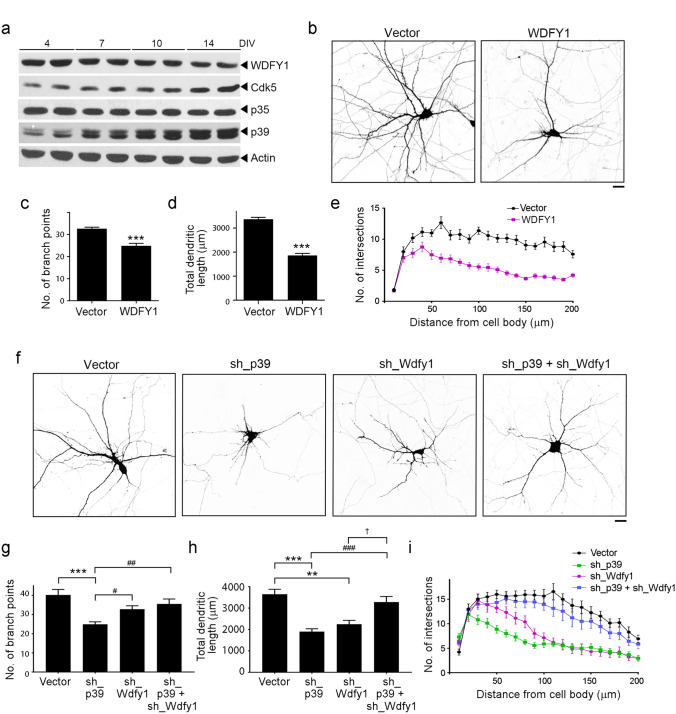
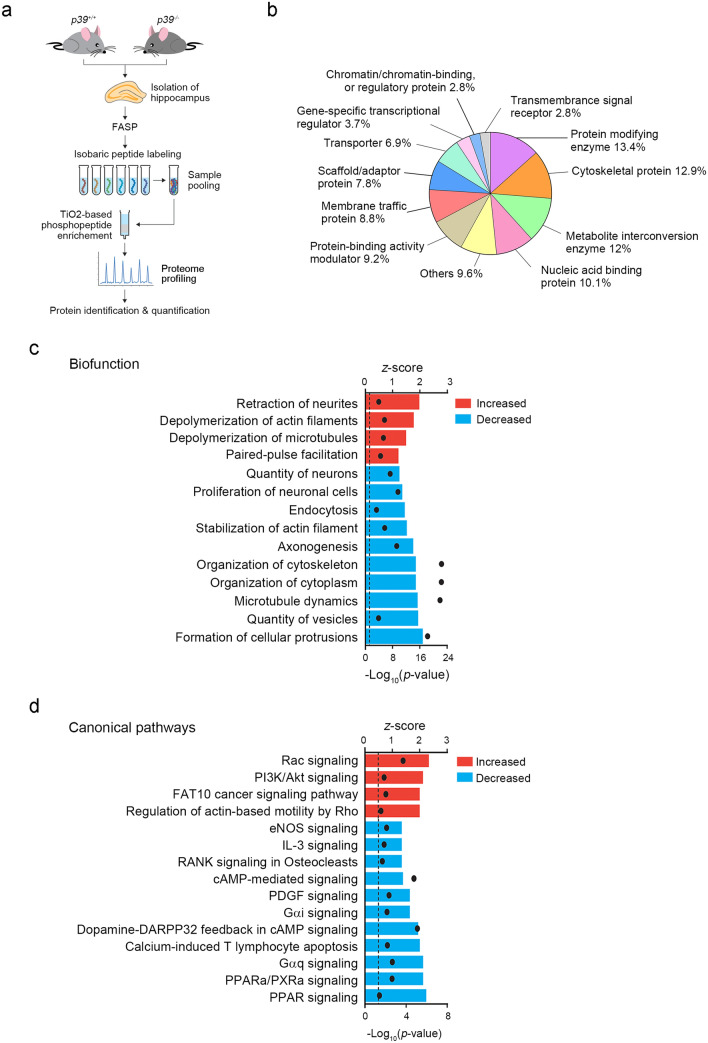
Dendrites, branched structures extending from neuronal cell soma, are specialized for processing information from other neurons. The morphogenesis of dendritic structures is spatiotemporally regulated by well-orchestrated signaling cascades. Dysregulation of these processes impacts the wiring of neuronal circuit and efficacy of neurotransmission, which contribute to the pathogeneses of neurological disorders. While Cdk5 (cyclin-dependent kinase 5) plays a critical role in neuronal dendritic development, its underlying molecular control is not fully understood. In this study, we show that p39, one of the two neuronal Cdk5 activators, is a key regulator of dendritic morphogenesis. Pyramidal neurons deficient in p39 exhibit aberrant dendritic morphology characterized by shorter length and reduced arborization, which is comparable to dendrites in Cdk5-deficient neurons. RNA sequencing analysis shows that the adaptor protein, WDFY1 (WD repeat and FYVE domain-containing 1), acts downstream of Cdk5/p39 to regulate dendritic morphogenesis. While WDFY1 is elevated in p39-deficient neurons, suppressing its expression rescues the impaired dendritic arborization. Further phosphoproteomic analysis suggests that Cdk5/p39 mediates dendritic morphogenesis by modulating various downstream signaling pathways, including PI3K/Akt-, cAMP-, or small GTPase-mediated signaling transduction pathways, thereby regulating cytoskeletal organization, protein synthesis, and protein trafficking.


Conflict of interest statement

The authors declare no competing interests.

Figures

Figure 1
Figure 1
p39-associated Cdk5 activity is important for dendritic development. (ad) Cdk5 activity is required for proper dendritic development. Rat hippocampal neurons at 7 days in vitro (DIV) were transfected with vector control or the indicated Cdk5 cDNA constructs, and dendritic morphology was examined at 14 DIV. (a) Representative images of wild-type neurons (Cdk5-WT) and Cdk5 activity-deficient neurons (Cdk5-DN or Cdk5-Y15F). Dendritic complexity was analyzed by quantifying total dendrite number (b) and total dendrite length (c), and Sholl analysis (d). Scale bar: 20 μm; n = 17–46 neurons from 3 independent experiments; **p < 0.01, ***p < 0.001 versus Mock; #p < 0.05, ##p < 0.01, ###p < 0.001 versus Cdk5-WT; Kruskal–Wallis one-way ANOVA followed by Dunn’s test. (eh) Reduced dendritic complexity in Cdk5-, p35-, or p39-knockdown neurons. Rat hippocampal neurons at 7 DIV were transfected with vector control or shRNA targeting Cdk5, p35, p39, or p39 together with RNAi-resistant p39 mutant (Rr_p39). Dendritic morphology was examined at 14 DIV. Representative images (e), quantification of total dendrite number (f) and total dendrite length (g), and Sholl analysis (h). Scale bar: 20 µm; n = 30–35 neurons from 3 independent experiments; ***p < 0.001 versus Vector; ###p < 0.001 versus sh_Cdk5; p < 0.05 versus sh_p39; Kruskal–Wallis one-way ANOVA followed by Dunn’s test.
Figure 2
Figure 2
Impaired dendritic morphogenesis in Cdk5−/−, p39−/−, and p35−/− neurons. (ad) Dendritic morphology of Cdk5+/+ and Cdk5−/− hippocampal neurons at 14 days in vitro (DIV). Representative images (a) and quantification of total dendrite number (b) and total dendrite length (c), and Sholl analysis (d) of Cdk5+/+ and Cdk5−/− neurons. Scale bar: 10 µm; n = 7–8 neurons; **p < 0.01, Mann–Whitney U-test. (eh) Dendritic morphology of p39+/+ and p39−/− hippocampal neurons at 14 DIV. Representative images (e) and quantification of dendrite number (f) and total dendrite length (g), and Sholl analysis (h) of p39+/+ and p39−/− neurons. Scale bar: 10 µm; n = 30 neurons; ***p < 0.001, Mann–Whitney U-test. (il) Dendritic morphology of p35+/+ and p35−/− hippocampal neurons at 14 DIV. Representative images (i) and quantification of dendrite number (j) and total dendrite length (k), and Sholl analysis (l) of p35+/+ and p35−/− neurons. Scale bar: 10 µm; n = 7–8 neurons. (mo) Dendritic morphology of pyramidal neurons in the cerebral cortex of 1-month-old p39+/+ and p39−/− mice. Representative images (m) and quantification of dendrite number (n) and total dendrite length (o). Scale bar: 50 µm; n = 22–29 neurons from 3 mice; ***p < 0.001, Mann–Whitney U-test.
Figure 3
Figure 3
Transcriptome analysis of p39+/+ and p39−/− cortical neurons. (a) Heatmap showing the relative expression of differentially expressed genes between p39−/− and p39+/+ cortical neurons. There were 278 upregulated and 361 downregulated genes. The total RNA from p39+/+ and p39−/− cortical neurons was extracted at 10 days in vitro (DIV) for whole-transcriptome analysis. (b) Ingenuity pathway analysis (IPA) of the biofunctions of differentially expressed genes between p39−/− and p39+/+ cortical neurons. The activation of biofunctions according to differential gene expression in p39−/− and p39+/+ cortical neurons was determined by the z-score algorithm with a criterion of p < 0.05 (i.e., − log10 ≥ 1.3; black dots) using Fisher’s exact test. (c) Heatmap showing the differential gene expression of the “shape change of the neurite” group between p39+/+ and p39−/− cortical neurons. (d) Volcano plot showing the log2 fold change and − log10(p value) of each gene comparing p39−/− and p39+/+ cortical neurons. Differentially expressed genes with fold change > 1.5 and <  −1.5 are highlighted in red and blue, respectively. The dashed line indicates p < 0.05 and a fold change > 1.5 or <  −1.5. (e) Wdfy1 transcript levels in p39+/+ and p39−/− neurons determined by RNA sequencing analysis. (f) Real-time PCR analysis of Wdfy1 transcript levels in p39+/+ and p39−/− neurons. (g) WDFY1 protein expression at different developmental stages—embryonic day (E) 17, E17; postnatal day (P) 7, P7, and 1 month old—in C57/BL6 mouse brains. (h, i) Elevated WDFY1 protein expression in p39−/− mouse brains. Western blot analysis (h) and quantification (i) of WDFY1 protein in p39-knockout mouse forebrains at P7; n = 3 brains; *p < 0.05, **p < 0.01, unpaired Student’s t-test.
Figure 4
Figure 4
Suppression of WDFY1 expression restores impaired dendritic development in p39-deficient neurons. (a) Developmental expression of WDFY1 in rat cortical neurons at 4, 7, 10 and 14 days in vitro (DIV). (be) Elevated WDFY1 protein expression impaired dendritic development in hippocampal neurons. Rat hippocampal neurons at 7 DIV were transfected with vector control or Wdfy1 cDNA construct, and dendritic morphology was examined at 14 DIV. (b) Representative images showing the dendritic morphology of WDFY1-overexpressing hippocampal neurons. (ce) Quantification of dendrite number (c) and total dendrite length (d), and Sholl analysis (e). Scale bar: 20 µm; n = 18–20 neurons from 3 independent experiments; ***p < 0.001, Mann–Whitney U-test. (fi) Suppression of Wdfy1 restored the dendritic morphology in p39-deficient hippocampal neurons. Rat hippocampal neurons at 7 DIV were transfected with pSUPER vector control and shRNA targeting p39, Wdfy1, or both, and dendritic morphology was examined at 14 DIV. (f) Representative images showing dendritic morphology. (gi) Quantification of the number of dendrites (g) and total dendrite length (h), and Sholl analysis (i); n = 14–16 neurons from 3 independent experiments; **p < 0.01, ***p < 0.001 versus Vector; #p < 0.05, ##p < 0.01, ###p < 0.001 versus sh_p39; p < 0.05 versus sh_Wdfy1; Kruskal–Wallis one-way ANOVA followed by Dunn’s test.
Figure 5
Figure 5
Phosphoproteomic analysis of the hippocampi of 1-month-old p39+/+ and p39−/− mice. (a) Workflow of phosphoproteomic analyses between p39+/+ and p39−/− hippocampi. (b) Gene Ontology (GO) analysis according to the PANTHER classification system revealed the protein classification of differentially phosphorylated proteins between p39+/+ and p39−/− mouse hippocampi. (c) Ingenuity pathway analysis (IPA) of the biofunctions of differentially regulated phosphoproteins in p39+/+ and p39−/− mouse hippocampi. The activation of biofunctions based on the differentially regulated phosphoproteins between p39+/+ and p39−/− hippocampi was determined by the z-score algorithm with a criterion of p < 0.05 (i.e., − log10 ≥ 1.3; black dots) using Fisher’s exact test. (d) IPA of the canonical pathways of differentially regulated phosphoproteins between p39+/+ and p39−/− mouse hippocampi. The activation of canonical pathways based on the differentially phosphorylated protein expression between p39+/+ and p39−/− hippocampi was determined by the z-score algorithm with a criterion of p < 0.05 (i.e., − log10 ≥ 1.3; black dots) using Fisher’s exact test.

Similar articles

Cited by

References

    1. Lefebvre JL, Sanes JR, Kay JN. Development of dendritic form and function. Annu. Rev. Cell Dev. Biol. 2015;31:741–777. doi: 10.1146/annurev-cellbio-100913-013020. - DOI - PubMed
    1. Arikkath J. Molecular mechanisms of dendrite morphogenesis. Front. Cell. Neurosci. 2012;6:1–14. doi: 10.3389/fncel.2012.00061. - DOI - PMC - PubMed
    1. Menon, S. & Gupton, S. Recent advances in branching mechanisms underlying neuronal morphogenesis [version 1; referees: 2 approved]. F1000Research7 (2018). - PMC - PubMed
    1. Wu DC, et al. The expression of Cdk5, p35, p39, and Cdk5 kinase activity in developing, adult, and aged rat brains. Neurochem. Res. 2000 doi: 10.1023/A:1007544106645. - DOI - PubMed
    1. Ino H, Ishizuka T, Chiba T, Tatibana M. Expression of CDK5 (PSSALRE kinase), a neural cdc2-related protein kinase, in the mature and developing mouse central and peripheral nervous systems. Brain Res. 1994;661:196–206. doi: 10.1016/0006-8993(94)91197-5. - DOI - PubMed

Publication types

MeSH terms