. 2020 Oct 30;3(1):626.
doi: 10.1038/s42003-020-01322-4.

Retrograde signaling by a mtDNA-encoded non-coding RNA preserves mitochondrial bioenergetics

Affiliations

Retrograde signaling by a mtDNA-encoded non-coding RNA preserves mitochondrial bioenergetics

A Blumental-Perry et al. Commun Biol. .

Abstract

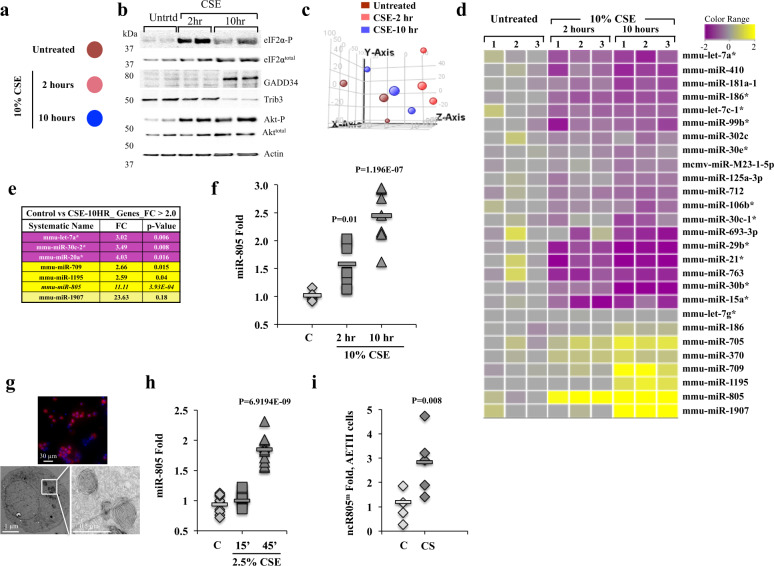
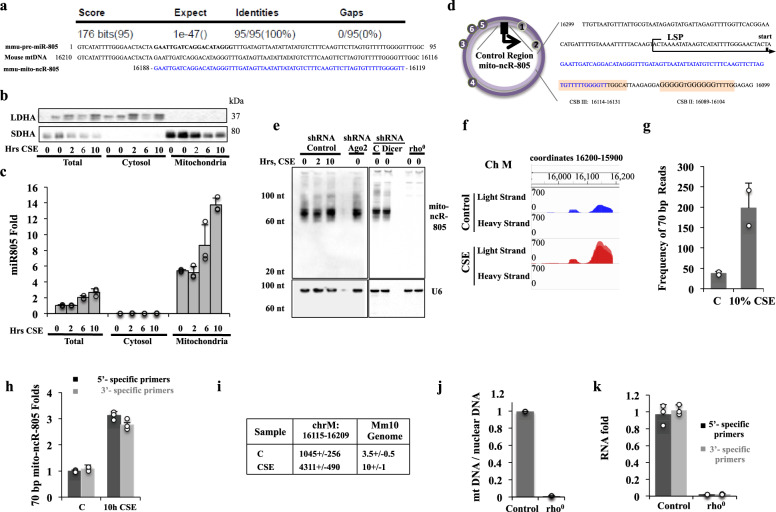
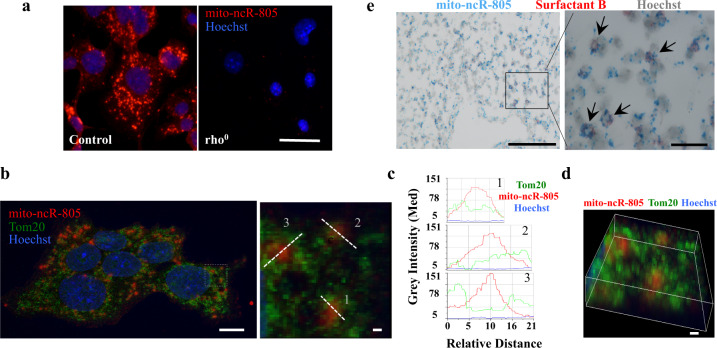
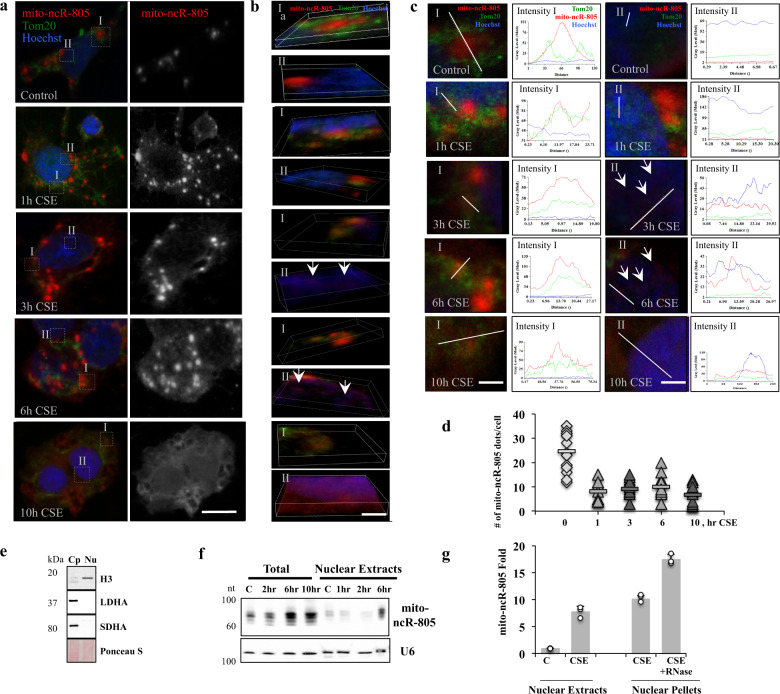
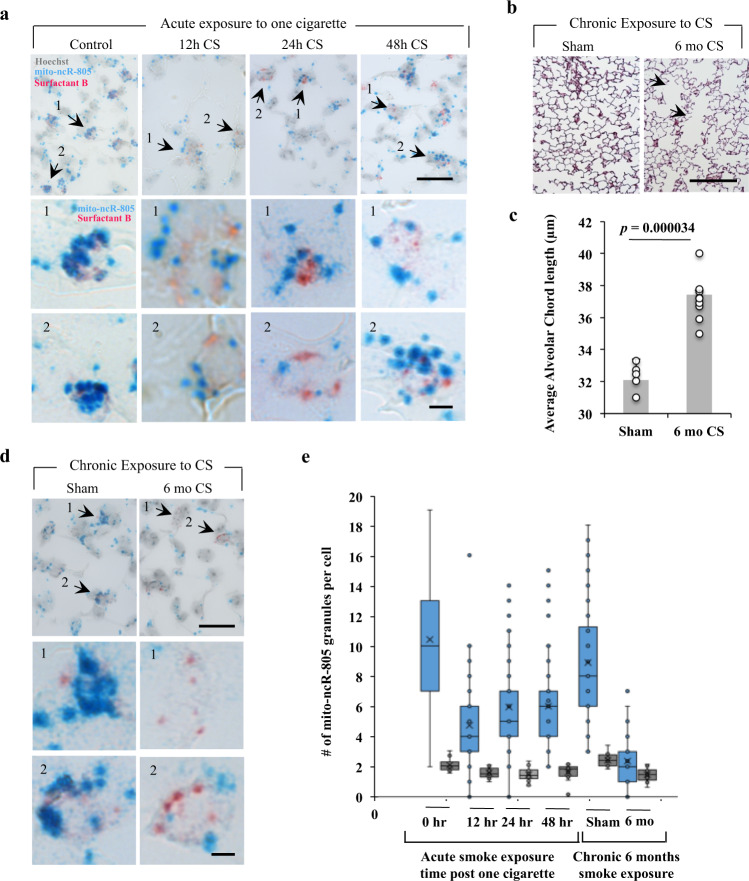
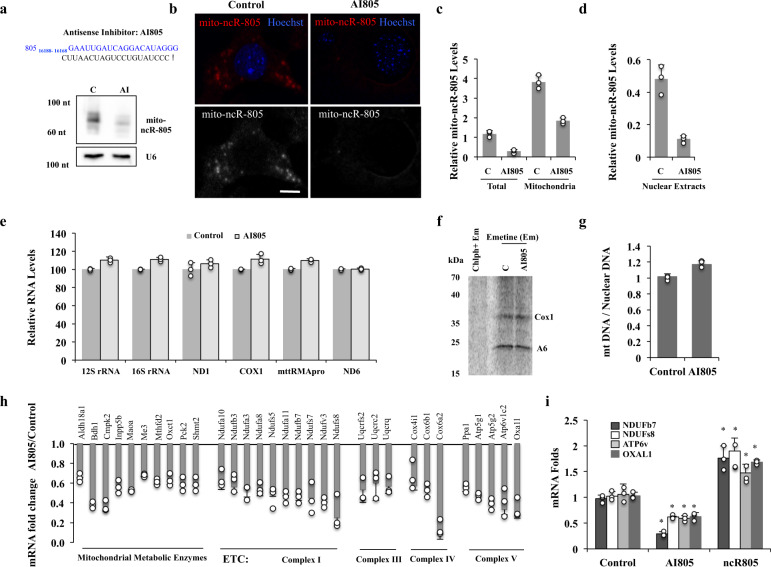
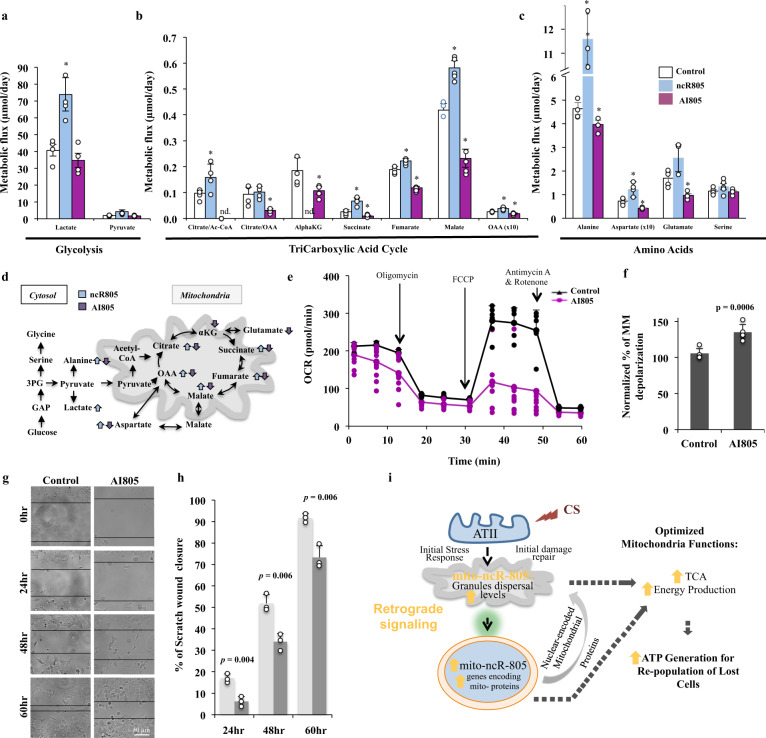
Alveolar epithelial type II (AETII) cells are important for lung epithelium maintenance and function. We demonstrate that AETII cells from mouse lungs exposed to cigarette smoke (CS) increase the levels of the mitochondria-encoded non-coding RNA, mito-RNA-805, generated by the control region of the mitochondrial genome. The protective effects of mito-ncR-805 are associated with positive regulation of mitochondrial energy metabolism, and respiration. Levels of mito-ncR-805 do not relate to steady-state transcription or replication of the mitochondrial genome. Instead, CS-exposure causes the redistribution of mito-ncR-805 from mitochondria to the nucleus, which correlated with the increased expression of nuclear-encoded genes involved in mitochondrial function. These studies reveal an unrecognized mitochondria stress associated retrograde signaling, and put forward the idea that mito-ncRNA-805 represents a subtype of small non coding RNAs that are regulated in a tissue- or cell-type specific manner to protect cells under physiological stress.


Conflict of interest statement

The authors declare no competing interests.

Figures

Fig. 1
Fig. 1. Identification of miRNAs regulated by CSE treatment.
a Key of experimental treatments of MLE12 cells with 10% CSE for 0 (untreated), 2, or 10 h. b Untreated and treated with 10% CSE for 2 and 10 h MLE12 cells were assayed for changes in protein levels associated with stress signaling. Actin was used as a loading control. c GeneSpring 11.0 principle component analysis of untreated cells, and two time points of CSE treatment. d Hierarchical clustering of 27 differentially expressed miRNAs obtained from three independent biological experiments. Expression of microRNAs was assayed in untreated and 10% CSE-exposed MLE12 cells using GeneSpring GX 11.0. e Table of select microRNAs from d with the highest changes. f RT-qPCR was used to confirm miR-805 expression in MLE12 cells exposed to 10% CSE for 2 h (n = 3 independent experiments/with 9 independent samples, p = 0.01) and 10 h (n = 3, independent experiments/with 9 independent samples, p = 1.196E−07). g Primary AETII cells were isolated from mouse lungs and their phenotype was verified using antibodies specific to staining lamellar bodies (3C9), showing a 92% purity of isolated AETII cells (111 3C9-positive cells out of total of 121 DAPI nuclei, upper panel). Isolated AETII cells were plated, allowed to adhere and recover from the isolation procedure for 3 days, fixed using Karnovsky’s fixation protocol, and processed for TEM to visualize laminar bodies. Images were acquired using JEM 1011 TEM microscope. h Mouse primary AETII cells from four independent isolations were plated, cultured for 3 days, and exposed to 2.5% CSE for 15 and 45 min. miRNA-enriched RNA was isolated and tested for the expression of miR-805 by RT-qPCR (Control n = 3 independent experiments/with 9 independent samples, 15 min n = 3 independent experiments/with 9 independent samples, p value = 0.006, and 45 min n = 3 independent experiments/with 12 independent samples, p value = 06.9194E−09). i Primary AETII cells isolated from mice exposed to CS for 3 months twice daily (n = 5 animals for control, and n = 5 animals for CS-exposed animals, p = 0.008). All p values indicate the comparison of treated sample values to respective control untreated. RT-qPCR levels of mito-ncR-805 were normalized to sno55RNA in all panels; folds calculated to respective controls.
Fig. 2
Fig. 2. miR-805 is an mtDNA-encoded non-coding RNA.
a Alignment of the predicted miR-805 to the mouse mitochondrial genome. The last row depicts the sequence obtained by RNA-sequencing analysis. b, c MLE12 cells were exposed or not to 10% CSE; cytosolic and mitochondrial extracts were generated. Fractions were analyzed for b cytosolic protein lactate dehydrogenase A (LDHA) and mitochondrial protein succinate dehydrogenase subunit A (SDHA) and c the expression levels of miR-805. d Schematic representation of the mito-ncR-805 genomic location. The circular mtDNA with the heavy (H) strand in dark purple, the light (L) strand in light purple, and the LSP indicated by the black arrow. A portion of the mtDNA control region near the LSP is shown with the H-strand nucleotide sequence. The LSP transcription initiation start site is indicated. The 5′-end of mito-ncR-805 (blue) maps one nucleotide downstream of the LSP transcription initiation site and the 3′-end maps within the conserved sequence block (CSB) III (orange box). mito-ncR-805 appears to be a product of the LSP promoter transcription. CSB II with a G-quartet important for transcription pausing and R-loop formation is also indicated (orange box). e Control (non-targeting), Ago2-, and Dicer-specific shRNA MLE12 cells, as well as rho0 MLE12 cells were treated with 10% CSE for the indicated times. Small RNA-enriched fractions were resolved on a 15% urea-gel and hybridized with probes complementary to miR-805 and to U6 (loading control). f Transcription profile of mitochondrial transcripts generated from 16,000–16,210 region of mtDNA. g Summary of frequency of reads of the 70-bp transcript. h Expression levels of mito-ncR-805 using two sets of primers, directed against the 5′ end (first 20 bp of mito-ncR-805), or directed against the 3′-end of mito-ncR-805 (30–55 bp of mito-ncR-805). i Alignment of all the sequence reads against the entire mouse nuclear and mitochondrial genomes. jk rho0 MLE12 cells were obtained by growing cells in the presence of ethidium bromide added fresh daily for 2 passages. i DNA was extracted and mitochondrial copy number was determined (Control 100%, rho0 4%). k mito-ncR-805 expression levels in MLE12 control and rho0 cells.
Fig. 3
Fig. 3. mito-ncR-805 cellular distribution.
a Control and rho0 MLE12 cells were grown on slides, fixed, and hybridized with a mito-ncR-805-specific probe. Images were acquired using ×40 magnification on Leica DM IRE2. Scale bar is 20 μm. bd MLE12 cells were grown on slides, fixed, and hybridized with mito-ncR-805-specific probe, followed by Tom20 staining. Confocal images were acquired using ×63 magnification and HuVolution function of the Leica SP8-HyVolution laser scanning confocal microscope. b A representative image, which is a projection of 14 consecutive planes acquired at the distance of 0.13 μm. Scale bar is 10 μm; boxed region on the left is shown enlarged on the right, as a single plane chosen for its maximal signal intensity for each channel. Linescans from the analysis of mito-ncR-805 and Tom20 relative cellular localizations are shown. c Representative examples of linescans and plots of three channel intensities through depicted regions; each represents a specific mito-ncR-805 and Tom20 spatial relationship: 1—complete overlap, 2—partial overlap, 3—engulfment of mito-ncR-805 by Tom20. Scale bar is 1 μm. d 3D reconstitution of 14 consecutive planes of boxed in b area. Scale bar is 1 μm. Images in bd are representatives of three independent biological experiments. For each experiment, 3–7 linescans per cell were analyzed for n = 6 cells e Lungs from control mice were inflated and paraffin embedded. mito-ncR-805 (blue dots) and AETII cells, positive for Surfactant B (red) expression, were visualized by ISH. Images were acquired at a magnification of ×20. Scale bar is 100 μm. Boxed area is enlarged; image was acquired at a magnification of ×100. Scale bar is 20 μm. Arrows point to the AETII cells.
Fig. 4
Fig. 4. mito-ncR-805 redistributes from mitochondria and appears in the nucleus during exposure of MLE12 cells to CSE.
MLE12 cells treated with 6% CSE for the indicated times were analyzed for stress-associated changes in mito-ncR-805 subcellular distribution. a Subcellular distribution of mito-ncR-805 and Tom20 was evaluated using FISH-IF. Nuclei were visualized by Hoechst. Scale bar is 20 μm. Boxed areas I are enlarged representative examples of areas analyzed for mito-ncR-805 and Tom20 localization. Boxed areas II are enlarged representative examples of areas analyzed for mito-ncR-805 localization in relationship to the nucleus. Confocal images were acquired using ×63 magnification. A representative image is a projection of 7 consecutive planes acquired at the distance of 0.3 μm. b 3D reconstitution of representative boxed areas from a. Scale bar is 2 μm. Arrows at the 3 h CSE time point to the initial mito-ncR-805 spots in the nucleus (c). Linescan analysis of areas I and II with representative examples of plots of three channel intensities through regions depicted by linescans. Images in ac are representatives of three independent biological experiments. For each experiment, 3–4 cells for each condition were analyzed, with 3–5 linescans per each cell. d Quantification of mito-ncR-805 dots per individual cell counted for 12–15 cells for each time point. p values: pControl/1h = 1.96458E-05, pControl/3h = 3.78809E−07, pControl/6h = 2.73901E−06, pControl/10h = 0.000686789; not statistically significant between different exposure time: p1h/10h = 0.543742736. e, f MLE12 cells were exposed to CSE for 0, 2, 6, and 10 h. Total, nuclear, and cytoplasmic extracts were prepared. e Purity of nuclear extracts (Nu), as compared to cytoplasmic extracts (Cp). Proteins were isolated from half of each fraction, and fractions were analyzed for cytosolic protein LDHA, mitochondrial protein SDHA, and nuclear protein Histone 3 (H3). f Small RNAs were isolated from the other half of total and nuclear fraction, resolved on 15% urea-gel, and probed with the probes complimentary to mito-ncR-805 and to U6. g Levels of mito-ncR-805 were analyzed by RT-qPCR in total and nuclear extracts and in nuclear pellets treated with RNase.
Fig. 5
Fig. 5. The number of mito-ncR-805 spots is decreased in AETII cells of mice acutely and chronically exposed to CS.
ad Mice were exposed to smoke from one cigarette (a) or to smoke from 2 cigarettes per day, 5 days a week, for 6 months (bd). Lungs were inflated, embedded into paraffin blocks, 4 micron sections were cut, and analyzed. a, d Expression of mito-ncR-805 (blue) and Surfactant B mRNA (red) using ISH. Images were acquired using ×100 objective. Representative images are shown, scale bar is 20 μm. Arrows indicate enlarged AETII cells shown in (1) and (2) panels, respectively. Scale bar for enlarged images is 5 μm. Hoechst counterstain overlay is removed from enlarged images to maximize contract of mito-ncR-805 and Surfactant B signals. b Examples of lungs of sham and mice exposed to CS for 6 months stained with Gill staining to visualize alveolar compartment. Scale bar is 100 μm. c Morphometric analysis of average alveolar chord length of sham and 6-month CS-exposed mice, where sham n = 6 animals and 6-month CS n = 9 animals. e Quantification of the number of mito-ncR-805 spots in AETII and non-AETII cells. Each point represents counting from 6 to 8 randomly chosen fields acquired at ×100 magnification from each individual animal. For controls, n = 76 AETII and 480 non-AETII cells. For 12 h of CS exposure, n = 79 AETII and 403 non-AETII cells. For 24 h, n = 87 AETII and 472 non-AETII cells. For 48 h, n = 53 AETII and 376 non-AETII cells. For the sham group, n = 61 AETII and 322 non-AETII cells. For chronic smokers, n = 64 AETII and 414 non-AETII cells. P values are pControlAETII/non-AETII = 5.55558E–08, pControl/12h-AETII = 1.04561E–18, pControl/12h-non-AETII = 0.004329157, pControl/24h-AETII = 1.43455E−13, pControl/24h-non-AETII = 0.002372331, pControl/48h-AETII = 3.89362E–11, pControl/48h-non-AETII = 0.054832469, pSham/6 mo-AETII = 9.28908E−21, pSham/6 mo-non-AETII = 0.000104857, p6-mo-smAETI/non-AETII = 0.057089623.
Fig. 6
Fig. 6. Depletion of mito-ncR-805 does not affect steady-state mitochondrial replication, transcription, or translation but a subset of neMITO.
a Antisense inhibitor (AI) of mito-ncR-805 (AI805) was transfected into MLE12 cells to decrease mito-ncR-805 levels. The sequence of the AI805 is shown. Northern blot and b FISH analysis of mito-ncR-805. Scale bar 10 μm. c, d Cells were transfected with AI805 or non-targeting RNA. Total, mitochondrial, and nuclear extracts were isolated. mito-ncR-805 levels were analyzed by RT-qPCR. eg MLE12 cells were transfected with AI805 or non-targeting RNA. e RNA was extracted and the expression of six mitochondrial genes was tested: two encoded by the light strand and four by the heavy strand (see Fig. 2d for their location in mitochondrial genome). f Representative phospho-images of mitochondrial translation products labeled with [35S]-methionine and [35S]-cysteine for 60 min following the addition of emetine to inhibit non-mitochondrial translation or the combination of emetine and chloramphenicol to inhibit all translation. g DNA was extracted and mitochondrial copy number was determined (n = 3 biological experiments for each condition; p = 0.05). h MLE12 cells were transfected with AI805 or with non-targeting RNA. Levels of mito-ncR-805 in cells transfected with non-targeting RNA were 1.18 +/− 0.2 and in cells transfected with AI805 0.28 +/− 0.04 in 3 independent biological experiments. RNA was analyzed for changes in the expression of neMITO using Qiagen Mitochondrial Energy Metabolism RT2 Profiler PCR Arrays. All gene expression was normalized to GAPDH. Genes with expressed fold changes ≥1.7-fold were grouped based on known function. i Cells were transfected with AI805, ncR805, or with non-targeting RNA and analyzed by RT-qPCR for the expression levels of four representative genes found to be downregulated in h. Significant P values are marked by asterisks, and P values were calculated from at least 3 representative biological experiments as Control versus AI805 or Control versus ncR805 (pNdufb7C/AI = 7.01036E−05, pNdufb7C/ncR805 = 0.004, pNdufs8C/AI = 0.005, pNdufs8C/ncR805 = 3.03509E–05, pAtp6vC/AI = 0.004, pAtp6vC/ncR805 = 0.0004, pOxaL1C/AI = 0.017, pOxaL1C/ncR805 = 0.029).
Fig. 7
Fig. 7. mito-ncR-805 modulates mitochondrial metabolism and bioenergetics.
ad MLE12 cells were transfected with AI805, ncR805, or non-targeting sequence. At 30 h post-transfections, cells were exposed to 20 mM [U-13C]glucose for 12 h, harvested, and metabolic flux was determined following 13C label incorporation into various metabolites. a Metabolic flux of glycolysis, b TCA, and c amino acid turnover. Metabolic flux was determined as a product of fractional flux multiplied by the concentration (pool size) of a metabolite. Fractional flux was calculated as 13C enrichment of a product metabolite/[13C] enrichment of precursor, i.e., [U-13C]glucose. All quantifications are presented as mean of four independent experiments ± S.E.M (Supplementary Data). Graphs are representative of three (for AI805) and two (ncR805) independent biological experiments. Asterisks denote statistically significant changes. d Schematic representation of the major findings in a, b. e MLE12 cells were transfected with AI805 or non-targeting RNA at 48 h post-transfections; OCR were measured at basal level with subsequent and sequential addition of oligomycin, FCCP, and rotenone + antimycin A, using a Seahorse XFe96 extracellular flux analyzer. Graph is a representative of one out of three biological experiments. All three experiments have been used for the quantification of bioenergetics parameters (Supplementary Data). f Mitochondrial membrane potential was measured using the JC-10 assay, n = 5 biological experiments, p value = 0.0005. g Scratch injury was inflicted to MLE-12 cells transfected with AI805 or non-targeting sequence and grown to the confluence of 80%. Live Images were acquired at 0, 24, 48, and 60 h post-scratch using a Nikon Eclipse TE6200-LI microscope. g is a representative of three independent experiments. h Quantification of healing speed of g. i Schematic representation of the findings reported in this manuscript. Following exposure of AETII cells to CS, the mtDNA-encoded mito-ncR-805 is released from mitochondria; its levels increase in mitochondria and in the nucleus. High levels of mito-ncR-805 in the nucleus correlate with increased expression of nuclear genes, which encode mitochondrial proteins related to mitochondrial homeostasis and function. Increased expression of those proteins ensures high bioenergetics of the mitochondria, which supports faster repopulation of lost due to damage cells.

Similar articles

Cited by

References

    1. National Center for Chronic Disease Prevention and Health Promotion (US) Office on Smoking and Health. The Health Consequences of Smoking-50 Years of Progress: A Report of the Surgeon General Reports of the Surgeon General (Centers for Disease Control and Prevention, Atlanta, GA, 2014). - PubMed
    1. Rennard SI. Advancing chronic obstructive pulmonary disease therapy: opportunities, challenges, and excitement. Am. J. Respir. Cell Mol. Biol. 2019;60:1–2. doi: 10.1165/rcmb.2018-0288ED. - DOI - PMC - PubMed
    1. Henson PM, Vandivier RW, Douglas IS. Cell death, remodeling, and repair in chronic obstructive pulmonary disease? Proc. Am. Thorac. Soc. 2006;3:713–717. doi: 10.1513/pats.200605-104SF. - DOI - PMC - PubMed
    1. Williams MC. Alveolar type I cells: molecular phenotype and development. Annu. Rev. Physiol. 2003;65:669–695. doi: 10.1146/annurev.physiol.65.092101.142446. - DOI - PubMed
    1. Evans MJ, Cabral LJ, Stephens RJ, Freeman G. Transformation of alveolar type 2 cells to type 1 cells following exposure to NO2. Exp. Mol. Pathol. 1975;22:142–150. doi: 10.1016/0014-4800(75)90059-3. - DOI - PubMed

Publication types

MeSH terms