. 2020 Oct 30;3(1):637.
doi: 10.1038/s42003-020-01365-7.

Tissue-scale tensional homeostasis in skin regulates structure and physiological function

Affiliations

Tissue-scale tensional homeostasis in skin regulates structure and physiological function

Shun Kimura et al. Commun Biol. .

Abstract

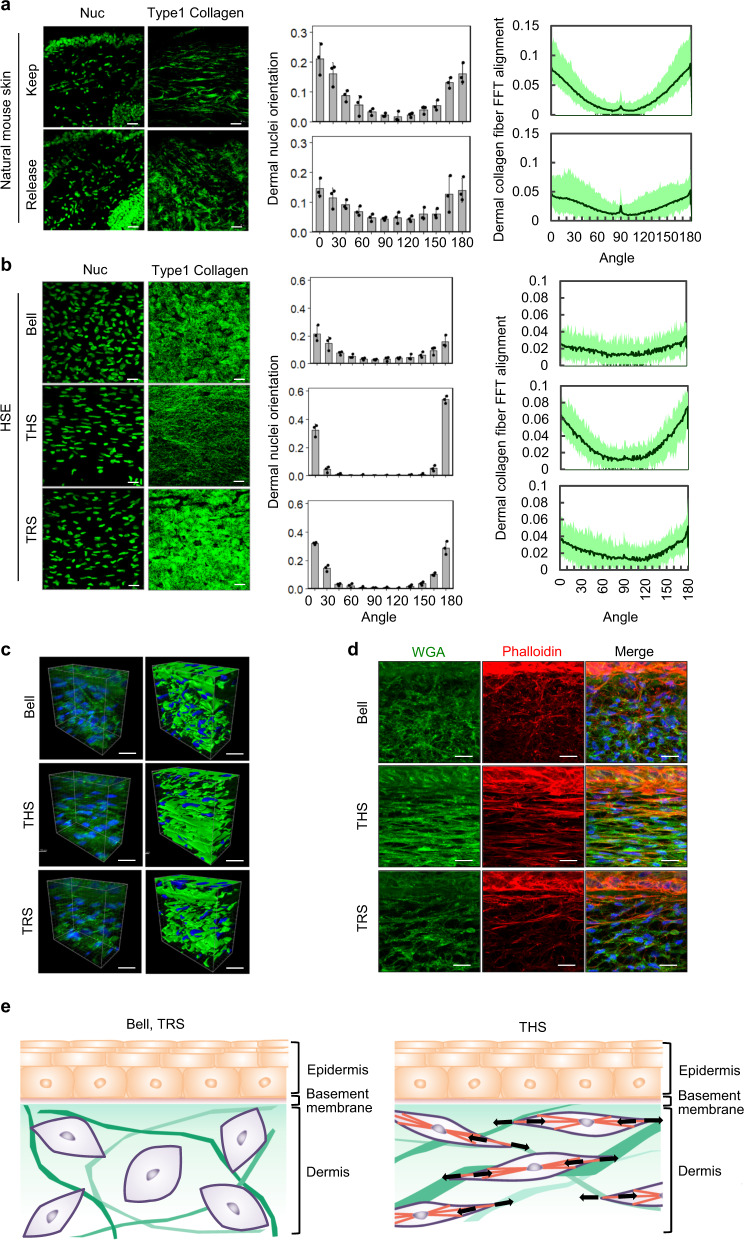
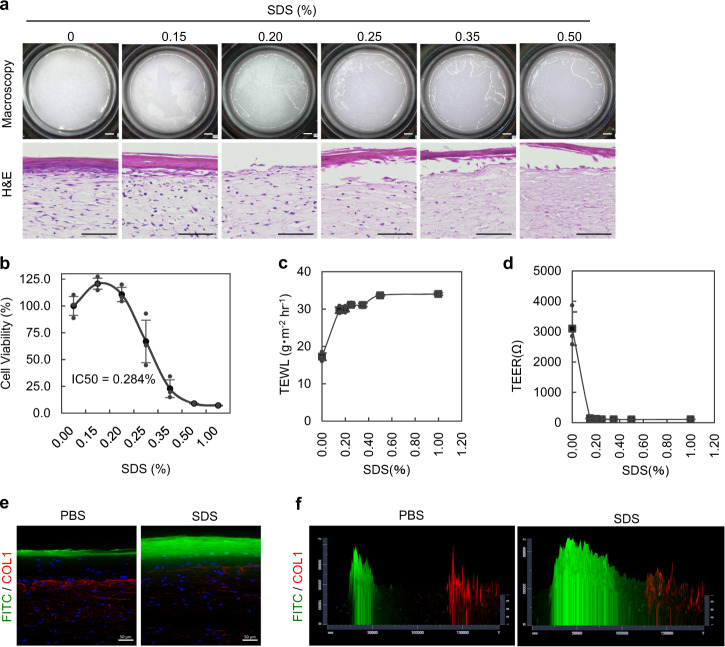
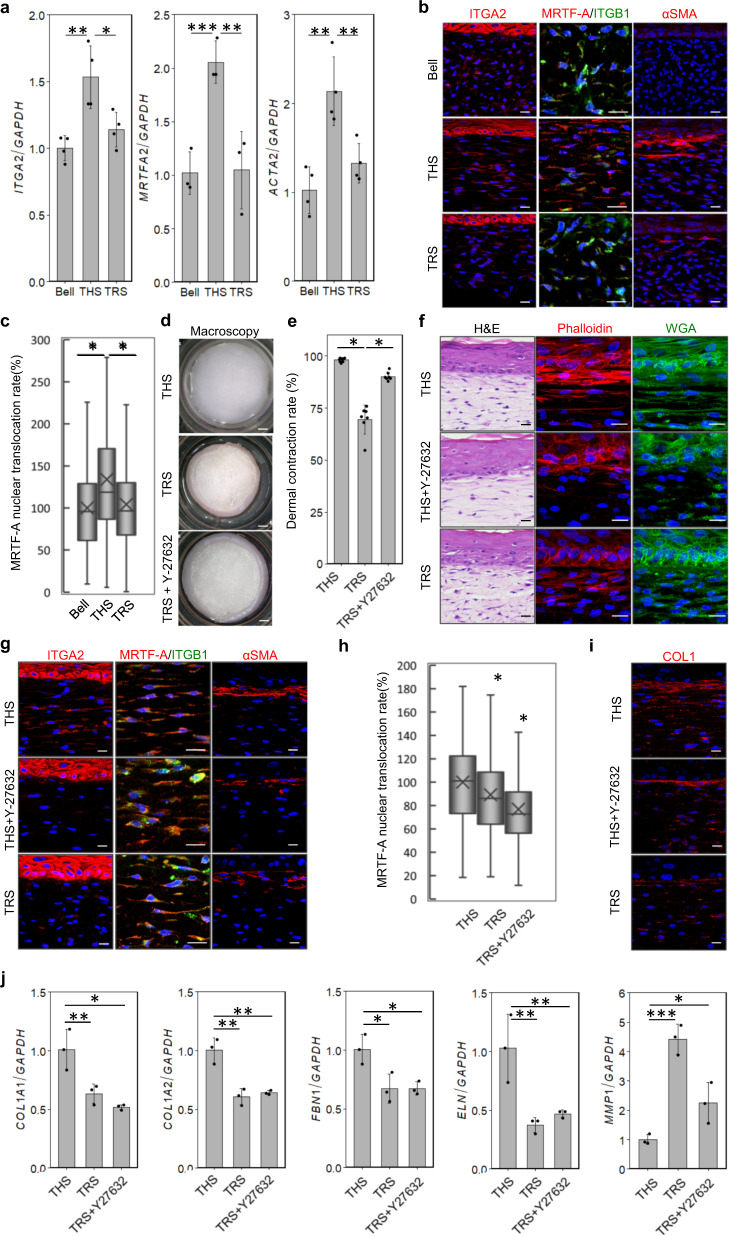
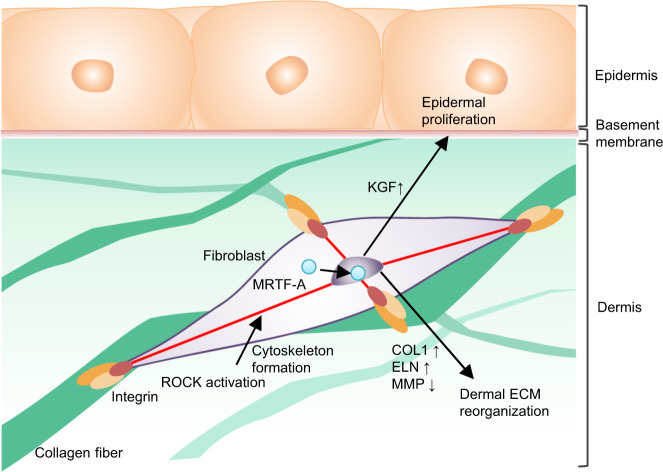
Tensional homeostasis is crucial for organ and tissue development, including the establishment of morphological and functional properties. Skin plays essential roles in waterproofing, cushioning and protecting deeper tissues by forming internal tension-distribution patterns, which involves aligning various cells, appendages and extracellular matrices (ECMs). The balance of traction force is thought to contribute to the formation of strong and pliable physical structures that maintain their integrity and flexibility. Here, by using a human skin equivalent (HSE), the horizontal tension-force balance of the dermal layer was found to clearly improve HSE characteristics, such as the physical relationship between cells and the ECM. The tension also promoted skin homeostasis through the activation of mechano-sensitive molecules such as ROCK and MRTF-A, and these results compared favourably to what was observed in tension-released models. Tension-induced HSE will contribute to analyze skin physiological functions regulated by tensional homeostasis as an alternative animal model.


Conflict of interest statement

T.T. is a supreme technical advisor at Organ Technologies Inc. This work was partially performed under the condition of an Invention Agreement between RIKEN, Rohto Pharmaceutical Co., Ltd., Meiji Seika Pharma Co., Ltd. and Organ Technologies Inc. The remaining authors declare no competing interests.

Figures

Fig. 1
Fig. 1. Construction of skin equivalent with skin tension homoeostasis.
a Schematic representation of ex vivo culture methods maintaining or releasing skin tensional homoeostasis. b Histological analyses of ex vivo cultured skin maintaining (upper columns) or releasing (lower columns) tensional homoeostasis. Macroscopic images (left panels) are shown. Scale bars, 1 mm. H&E staining (centre panels) and higher magnification images in each box area are shown (left panels). Scale bars, 1 mm or 50 µm. c Schematic representation of the construction methods of HSEs. d Images of the THS model. e Macroscopic (left) and H&E staining (second panels from the left) images of each model. Scale bars, 1 mm or 50 µm. f H&E staining of human skin and the THS model after 1, 3, 5 and 7 days of culture at the air–liquid interface. Scale bars, 50 µm. g, h Immunohistochemical analyses of human skin (upper columns) and the THS model (lower columns) after 7 days of culture at the air–liquid interface. Scale bars, 50 µm.
Fig. 2
Fig. 2. Rearrangement of dermal fibroblasts and ECM via skin tension homoeostasis.
a Fluorescence images of ex vivo cultured skin maintaining (upper columns) or releasing (lower columns) tensional homoeostasis. Nuclei (left panels) and Type 1 collagen fibres (right panels) are shown. Scale bars, 20 μm. Orientation of nuclei distribution was plotted between 0 and 180 degrees (anterior–posterior; mean ± SD). SHG imaging (left) and FFT analysis (right) of the alignment of dermal collagen fibres in ex vivo cultured skins maintaining (upper) or releasing (lower) tensional homoeostasis. b Fluorescence images of Bell’s model (upper columns), the THS model (middle columns) and the released model (lower columns). Nuclei (left panels) and SHG imaging of Type 1 collagen (right) are shown. Scale bars, 20 µm. Distribution plots show the dermal fibroblast nuclei orientation and Type 1 collagen fibre alignment. c Z-stack confocal imaging (left panels) and Imaris 3D rendering (right panels) of HSEs stained with a WGA-Alexa488 conjugate are shown. Scale bars, 20 µm. d Fluorescence images of HSEs stained with a WGA-Alexa488 conjugate (left panels), stained with a Phalloidin-Alexa594 conjugate (middle panels), and the merged images (right panels). Scale bars: 20 µm. e Schematic representation of cell shape and nuclear morphology through the rearrangement of cellular matrices by tensional homoeostasis.
Fig. 3
Fig. 3. Analysis of THS model skin barrier function.
a Viability of cells in the THS model was detected by skin irritation tests using SDS solution (0, 0.15, 0.20, 0.25, 0.35 and 0.50%). Macroscopy images of epidermal repellency (upper columns) and histological analysis of cytotoxicity using H&E staining (lower columns). Scale bars, 1 mm in upper columns and 50 µm in lower columns. b MTT assays showed SDS-induced cytotoxicity in skin equivalents with half of the maximum inhibitory concentration (IC50): 0.284%. c, d TEWL (c) and TEER (e) analyses of the THS model with concentration-dependent stimulation with SDS. e, f Confocal images of vertical sections (e) and a 2.5D intensity plot (f) of the THS model topically treated with a fluorescein solution. To evaluate epidermal barrier function, these skin equivalents were pre-treated without (left panels) or with (right panels) 0.15% SDS solution. Scale bars, 50 µm.
Fig. 4
Fig. 4. Analysis reveals that the THS model promoted function through tension homoeostasis.
a, c Real-time PCR analysis of dermal ECM proteins and epithelial–mesenchymal interaction-related genes (COL1A1, COL1A2, FBN1, ELN, MMP1 and KGF) of HSEs. *P < 0.001, as assessed by Dunnett’s test following two-way analysis of variance (ANOVA; P < 0.001); error bars represent the standard deviation. (b) Immunohistochemical analyses of epidermal and dermal morphogenesis markers in skin equivalents. These samples were stained with COL1, COL7, COL17, CK5, CK10, CLDN1, FLG and Ki67 antibodies. The dotted lines indicated boundary between epidermis and dermis. Scale bars, 50 µm. d Analysis of the Ki67-positive basal keratinocytes in skin equivalents. Immunohistochemical analyses (left) and Ki67-positive cell ratio (right) were shown. Scale bars, 20 µm. *P < 0.01 and **P < 0.001, as assessed by Dunnett’s test following two-way analysis of variance (ANOVA; P < 0.001). e Schematic representation of the methods used for evaluating molecular activity. Functional molecules were applied to skin equivalents by dissolving in medium (as shown by IAM) or lotion (as shown by TAM) and treating for 6 h to 5 days. f The reactivity to ATRA in skin equivalents (Bell’s model, THS model, and TRS model) was evaluated by mRNA expression levels of HAS3 and COL1A1 in the IAM assay model. *P < 0.01 and **P < 0.001, as assessed by Tukey–Kramer test following two-way analysis of variance (ANOVA; P < 0.001); error bars represent the standard deviation. g The reactivity to ATRA when using the IAM or TAM was evaluated by mRNA expression levels of HAS3. *P < 0.001, as assessed by Tukey–Kramer test following two-way analysis of variance (ANOVA; P < 0.001); error bars represent the standard deviation. h The reactivity to TGF-β in the THS model when using the IAM was evaluated by the mRNA expression levels of COL1A1, COL1A2, FBN1 and ELN. *P < 0.01 and **P < 0.001, as assessed by two-tailed Student’s t-tests; error bars represent the standard deviation. i, j Immunohistochemical analyses of skin equivalents for reactivity to ATRA, MAP and TGF-b when using IAM (i) or TAM (j). Scale bar, 50 µm.
Fig. 5
Fig. 5. Tension homoeostasis regulates skin morphogenesis.
a Real-time PCR analysis of mechanical stress-related genes (ITGA2, MRTF-A and ACTA2) in HSEs. *P < 0.05, **P < 0.01 and ***P < 0.001, as assessed by Dunnett’s test following two-way analysis of variance (ANOVA; P < 0.001); error bars represent the standard deviation. b Immunohistochemical analyses of mechano-sensitive proteins in HSE. These samples were stained with anti-ITGA2, anti-ITGB1, anti-MRTF-A and anti-αSMA antibodies. Scale bars, 20 µm. c Calculation of the nuclear localization of MRTF-A in cells (b). *P < 0.05, as assessed by Dunnett’s test following two-way analysis of variance (ANOVA; P < 0.001); error bars represent the standard deviation. d Macroscopic images of the THS model (upper) and TRS model without (middle) or with (lower) Y-27632 treatment. Scale bars; 1 mm. e Calculation of the shrinkage rate of (d). *P < 0.001, as assessed by Tukey–Kramer test following two-way analysis of variance (ANOVA; P < 0.001); error bars represent the standard deviation. f Histological analysis of the THS model without (upper columns) or with (middle columns) Y-27632 treatment; the TRS model is also shown (lower columns). H&E staining (left), phalloidin staining (middle) and WGA staining are shown. Scale bars, 20 µm. g Immunohistochemical analyses of focal adhesion proteins and mechano-transducer proteins in the THS model without (upper columns) or with (middle columns) Y-27632 treatment; the TRS model (lower columns) is also shown. Scale bars, 20 µm. h Calculation of the nuclear localization of MRTF-A in cells (g). *P < 0.05, as assessed by Dunnett’s test following two-way analysis of variance (ANOVA; P < 0.001); error bars represent the standard deviation. i Immunohistochemical analyses of collagen fibres in the THS model without (upper) or with (middle) Y-27632 treatment; the TRS model (lower) is also shown. Scale bars, 20 µm. j Real-time PCR analysis of dermal ECM-related genes in HSEs. *P < 0.05, **P < 0.01 and ***P < 0.001, as assessed by Dunnett’s test following two-way analysis of variance (ANOVA; P < 0.001); error bars represent the standard deviation.
Fig. 6
Fig. 6. Schematic representation of the regulation of skin structure and function by tensional homoeostasis.
ROCK signalling maintains cytoskeleton formation and promotes the nuclear localization of MRTF-A, which induces the gene expression of ECM factors and KGF.

Similar articles

Cited by

References

    1. Porazinski S, et al. YAP is essential for tissue tension to ensure vertebrate 3D body shape. Nature. 2015;521:217–221. doi: 10.1038/nature14215. - DOI - PMC - PubMed
    1. DuFort CC, Paszek MJ, Weaver VM. Balancing forces: architectural control of mechanotransduction. Nat. Rev. Mol. Cell Biol. 2011;12:308–319. doi: 10.1038/nrm3112. - DOI - PMC - PubMed
    1. Mammoto T, Ingber DE. Mechanical control of tissue and organ development. Development. 2010;137:1407–1420. doi: 10.1242/dev.024166. - DOI - PMC - PubMed
    1. Heisenberg CP, Bellaiche Y. Forces in tissue morphogenesis and patterning. Cell. 2013;153:948–962. doi: 10.1016/j.cell.2013.05.008. - DOI - PubMed
    1. Paszek MJ, et al. Tensional homeostasis and the malignant phenotype. Cancer Cell. 2005;8:241–254. doi: 10.1016/j.ccr.2005.08.010. - DOI - PubMed

Publication types

MeSH terms