. 2020 Oct 30;10(1):18767.
doi: 10.1038/s41598-020-75773-4.

Molecular specializations of deep cortical layer analogs in songbirds

Affiliations

Molecular specializations of deep cortical layer analogs in songbirds

Alexander A Nevue et al. Sci Rep. .

Abstract

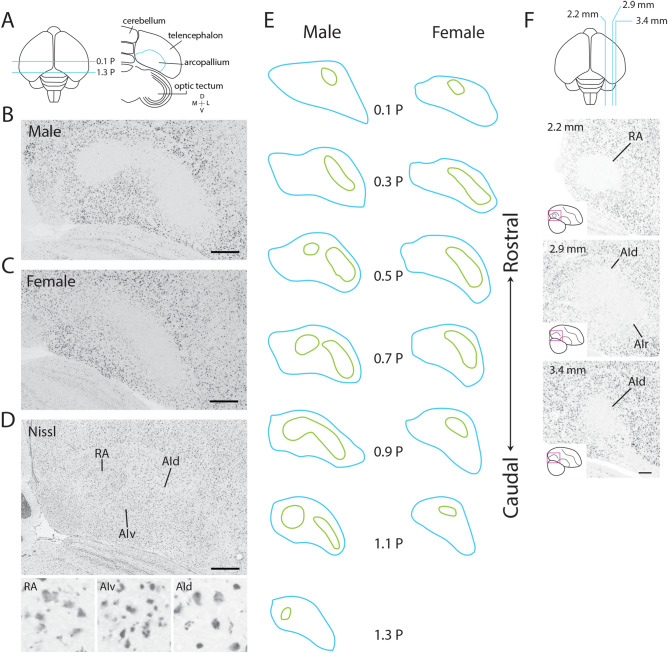
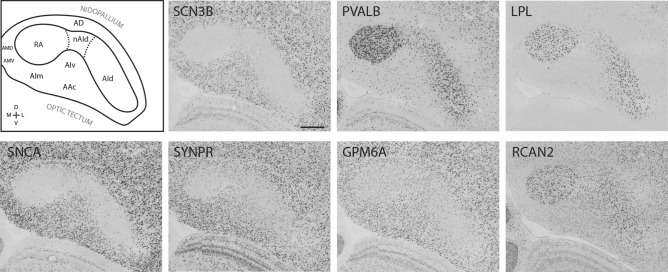
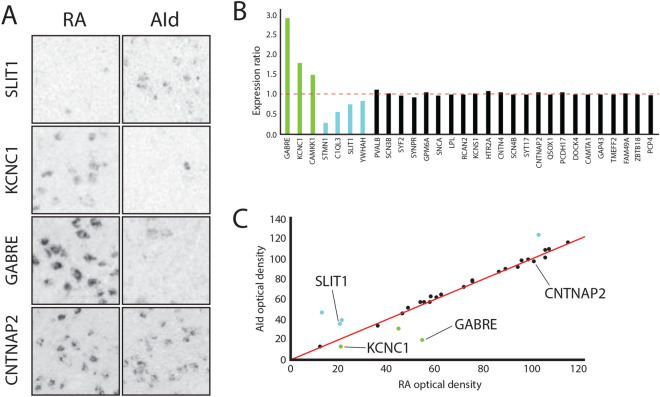
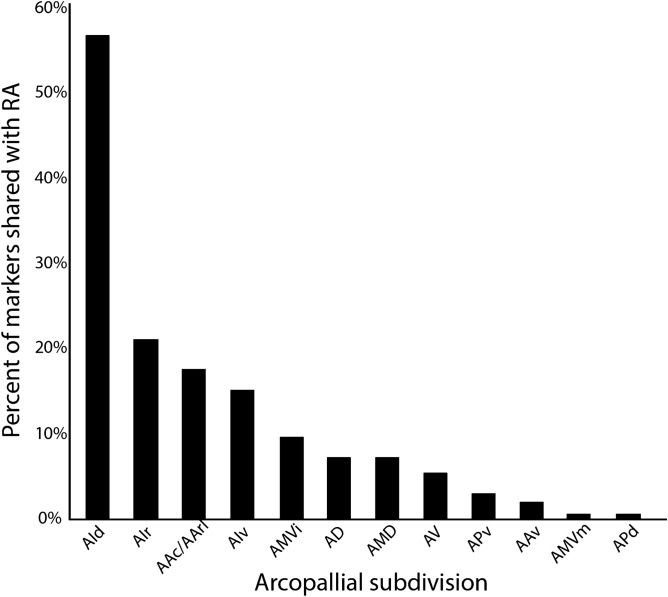
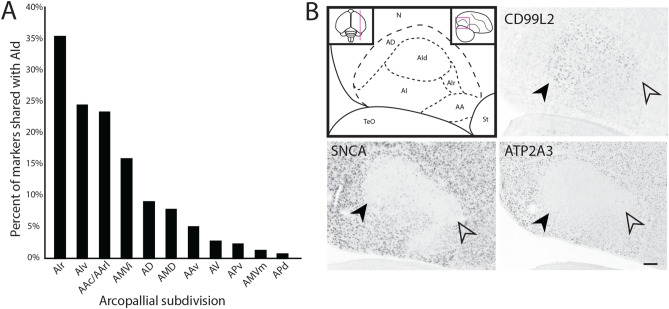
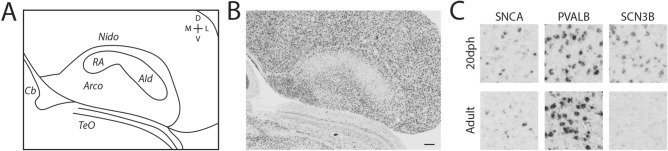
How the evolution of complex behavioral traits is associated with the emergence of novel brain pathways is largely unknown. Songbirds, like humans, learn vocalizations via tutor imitation and possess a specialized brain circuitry to support this behavior. In a comprehensive in situ hybridization effort, we show that the zebra finch vocal robust nucleus of the arcopallium (RA) shares numerous markers (e.g. SNCA, PVALB) with the adjacent dorsal intermediate arcopallium (AId), an avian analog of mammalian deep cortical layers with involvement in motor function. We also identify markers truly unique to RA and thus likely linked to modulation of vocal motor function (e.g. KCNC1, GABRE), including a subset of the known shared markers between RA and human laryngeal motor cortex (e.g. SLIT1, RTN4R, LINGO1, PLXNC1). The data provide novel insights into molecular features unique to vocal learning circuits, and lend support for the motor theory for vocal learning origin.


Conflict of interest statement

The authors declare no competing interests.

Figures

Figure 1
Figure 1
Molecular definition of RA and AId in adult zebra finches. (A) Top left: Top-down view of a schematic drawing of the zebra finch brain; blue lines indicate the range of frontal sections examined in this study. Top right: Drawing of a frontal section at 0.7P; blue line indicates the boundaries of the arcopallium, seen under Nissl staining. (B,C) SCN3B in situ hybridization images from a male and a female. RA and AId appear continuous in the male, and RA is indistinguishable in the female. (D) Nissl-stained frontal section through arcopallium at the center of RA in a male; RA, but not AId, has clear cytoarchitectonic boundaries. Small panels show high power views (100 × 100 µm images) within RA, AIv, and AId. (E) Drawings depicting SCN3B expression boundaries (green) in serial frontal sections through the arcopallium (blue) of adult male (left) and female (right) zebra finches. (F) Sagittal series of SCN3B in situ hybridization images through the arcopallium, reproduced from ZEBrA (www.zebrafinchatlas.org); section level is indicated by the blue lines in the schematic drawing at the top. AId dorsal intermediate arcopallium, AIr rostral intermediate arcopallium, AIv ventral intermediate arcopallium, RA robust nucleus of the arcopallium. Scale bar: 400 µm for all images.
Figure 2
Figure 2
Expression patterns of RA and AId markers. Top left: Drawing of the zebra finch arcopallium in the frontal plane, depicting structures shown in all other panels. RA and AId were defined based on the SCN3B expression pattern in the next panel, placement of other domains derives from fig. 17 in Mello et al.. Other panels: in situ hybridization images for various RA and AId markers. Scale bar: 400 µm for all images. AAc caudal anterior arcopallium, AD dorsal arcopallium, AId dorsal intermediate arcopallium, AIm medial intermediate arcopallium, AIv ventral intermediate arcopallium, AMD dorsal medial arcopallium, AMV ventral medial arcopallium, nAId neck of the dorsal intermediate arcopallium, RA robust nucleus of the arcopallium.
Figure 3
Figure 3
Defining molecular specializations unique to RA or common to both RA and AId. (A) High magnification (200 × 200 µm) in situ hybridization images of RA and AId showing cell-level expression of select genes RA unique and RA and AId markers. SLIT1 (top) and KCNC1 and GABRE (middle) are respectively negative and positive markers unique to RA, whereas expression of CNTNAP2 (bottom) is similar in RA and AId. (B) Expression ratio (optical density within RA/optical density within AId) for genes visually determined to be positive (green) or negative (blue) markers of RA only, or markers of both RA and AId (black). A ratio of 1 (dashed red line) corresponds to a gene equally expressed in RA and AId, and ratios > 1 or < 1 correspond, respectively, to positive or negative RA unique markers. (C) A scatterplot of expression ratio values for the genes in (B), with RA unique markers deviating from the 1:1 expression ratio line (red).
Figure 4
Figure 4
Molecular relationship between RA and other arcopallium domains. The arcopallial expression patterns of 162 RA markers were analyzed based on in situ hybridization data from the present study and from ZEBrA. Plotted are the percentages of RA markers that were also considered markers of other arcopallial domains; individual genes can be represented in multiple columns. Abbreviations: For a complete list of abbreviations see the legend in Fig. 5.
Figure 5
Figure 5
Relationship between AId and other arcopallial subdivisions. (A) The arcopallial expression patterns of 98 RA and AId markers were analyzed based on in situ hybridization data from ZEBrA. Plotted are the percentages of RA markers that were also considered markers of other arcopallial subdomains; individual genes can be represented in multiple columns. (B) Top left: drawing of arcopallium and its main subdomains on a sagittal section; top left inset indicates the position of the section (~ 2.9 mm from the midline) on a top-down view of the brain; red rectangle in the top right inset indicates the area shown in the main drawing and other panels. Other panels: In situ hybridization images of positive (CD99L2), negative (ATP2A3), and sparse cell (SNCA) markers of AId (black arrowheads) and AIr (empty arrowheads). Scale bar: 400 µm. AA anterior arcopallium, AAc caudal part of the anterior arcopallium, AArl rostro-lateral part of the anterior arcopallium, AAv ventral part of the anterior arcopallium, AD dorsal arcopallium, AId dorsal intermediate arcopallium, AIr rostral intermediate arcopallium, AIv ventral intermediate arcopallium, AMVi intermediate part of the medial ventral arcopallium, AMD medial dorsal arcopallium, AMVm medial part of the medial ventral arcopallium, APv ventral part of the posterior arcopallium, APd dorsal part of the posterior arcopallium, AV ventral arcopallium, N nidopallium, St striatum, TeO optic tectum.
Figure 6
Figure 6
Defining AId in juvenile male zebra finch. (A) Drawing of the arcopallium in frontal section through the core of RA in a 20 dph male zebra finch (based on B), depicting the continuous area of low SNCA expression with sparse labeled cells that includes both RA and AId. (B) In situ hybridization image of SNCA in a 20 dph male zebra finch. (C) High magnification (200 × 200 µm) in situ hybridization images of AId for select adult RA and AId markers, comparing cell level expression in 20 dph juvenile and adult males. Scale bar: 200 µm. Arco arcopallium, AId dorsal intermediate arcopallium, Cb cerebellum, Nido nidopallium, RA robust nucleus of the arcopallium, TeO optic tectum.
Figure 7
Figure 7
Defining AId in a suboscine. Representative in situ hybridization images of frontal sections through the arcopallium in two suboscine species, processed for an RA and AId marker (SNCA) from adult male zebra finches. Scale bar: 400 µm.

References

    1. Zeigler HP, Marler P. In: Behavioral Neurobiology of Birdsong. Zeigler HP, Marler P, editors. New York: New York Academy of Sciences; 2004.
    1. Reiner A, et al. Revised nomenclature for avian telencephalon and some related brainstem nuclei. J. Comp. Neurol. 2004;473(3):377–414. doi: 10.1002/cne.20118. - DOI - PMC - PubMed
    1. Jarvis ED, et al. Avian brains and a new understanding of vertebrate brain evolution. Nat. Rev. Neurosci. 2005;6(2):151–159. doi: 10.1038/nrn1606. - DOI - PMC - PubMed
    1. Lovell PV, et al. ZEBrA: Zebra finch expression brain atlas—A resource for comparative molecular neuroanatomy and brain evolution studies. J. Comp. Neurol. 2020;528:2099–2131. doi: 10.1002/cne.24879. - DOI - PMC - PubMed
    1. Nottebohm F, Stokes TM, Leonard CM. Central control of song in the canary, Seinus canarius. J. Comp. Neurol. 1976;165(4):457–486. doi: 10.1002/cne.901650405. - DOI - PubMed

Publication types