. 2020 Nov;52(11):1208-1218.
doi: 10.1038/s41588-020-00726-6. Epub 2020 Oct 30.

Pan-cancer single-cell RNA-seq identifies recurring programs of cellular heterogeneity

Affiliations

Pan-cancer single-cell RNA-seq identifies recurring programs of cellular heterogeneity

Gabriela S Kinker et al. Nat Genet. 2020 Nov.

Abstract

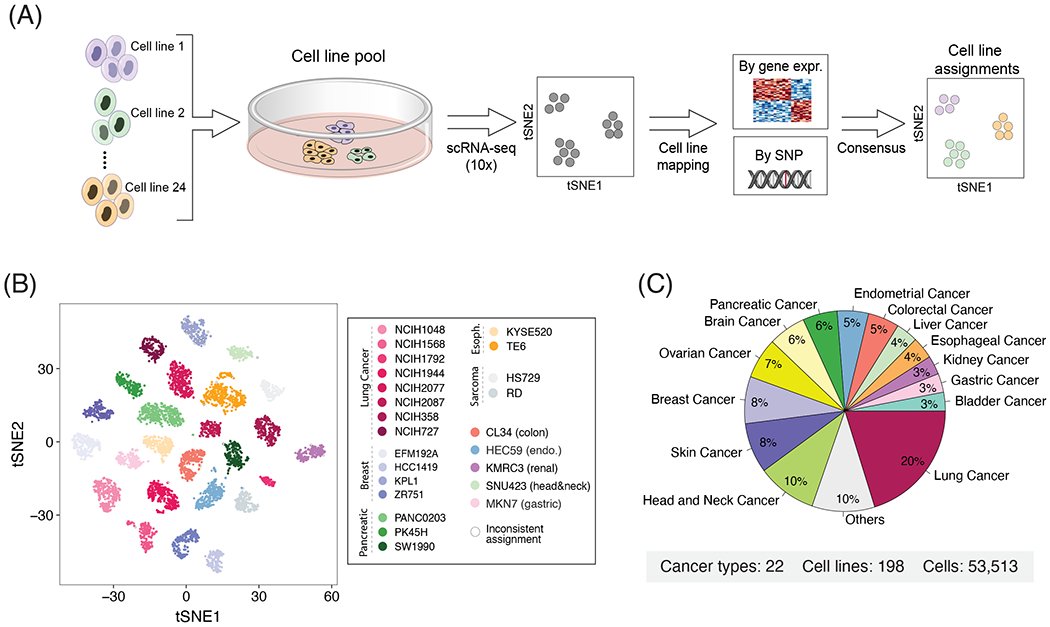
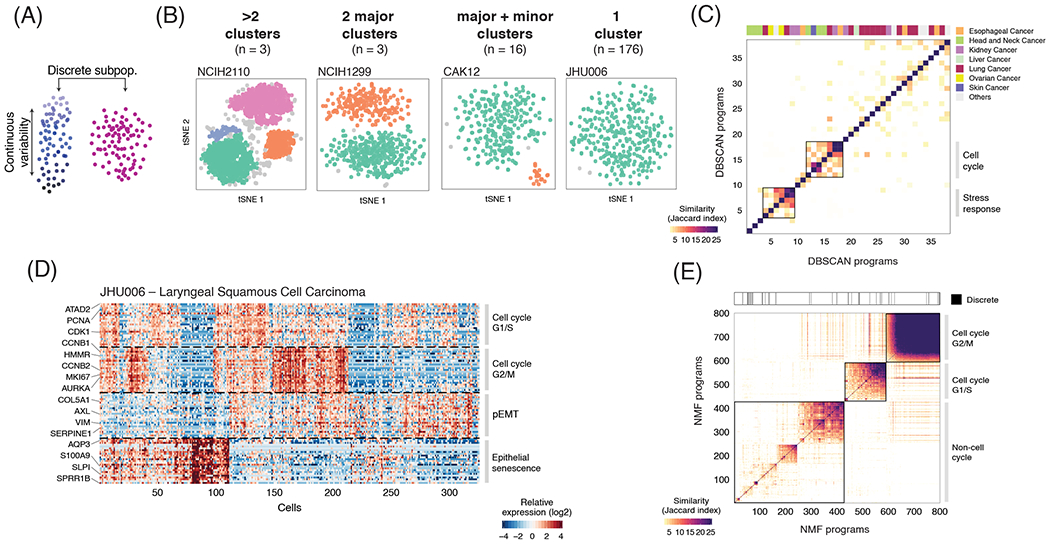
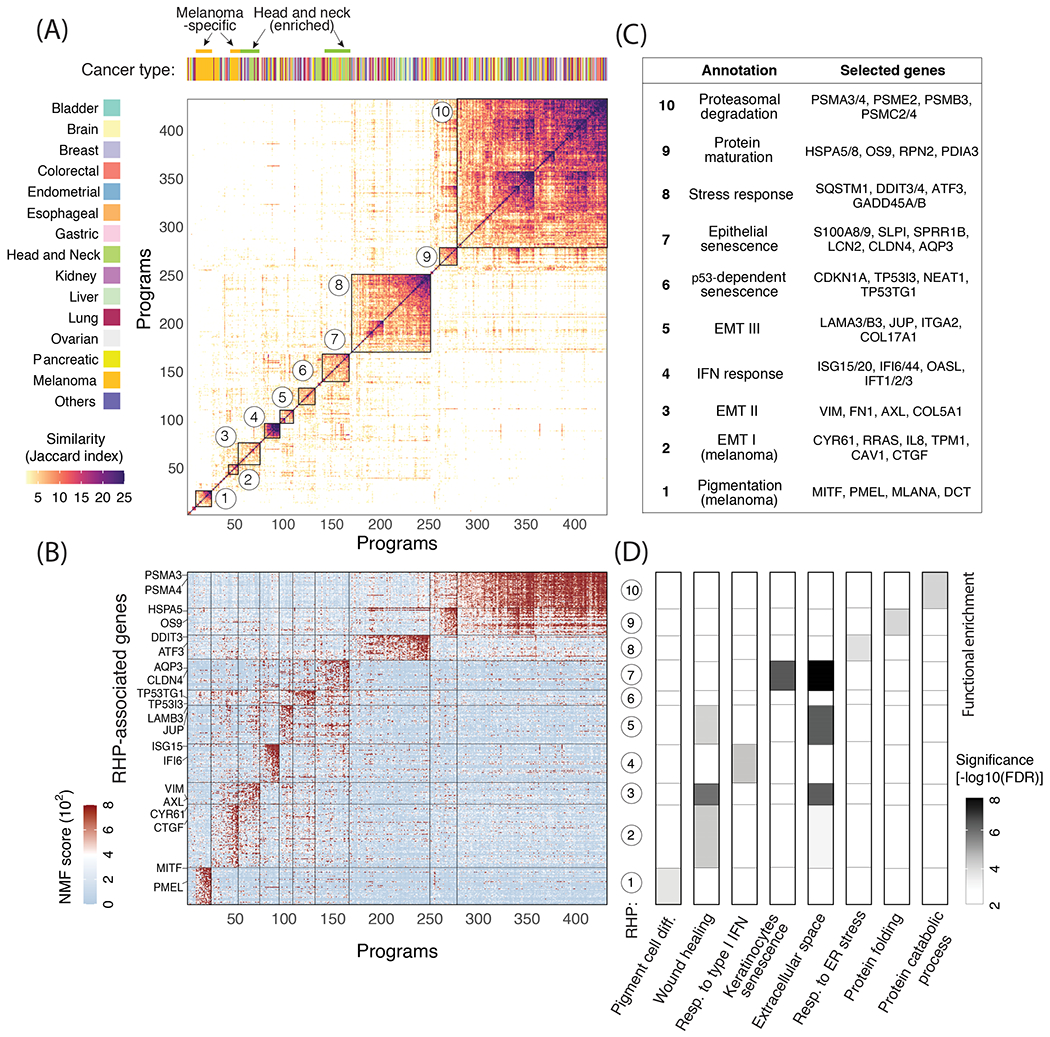
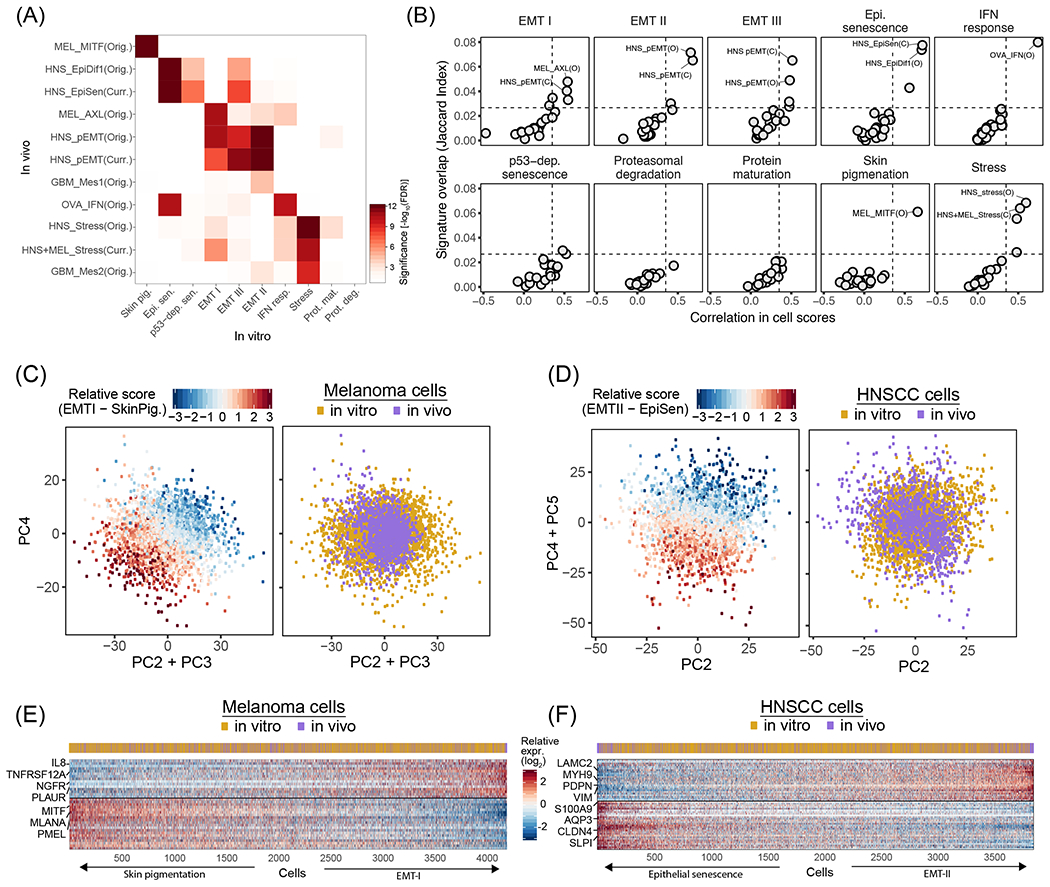
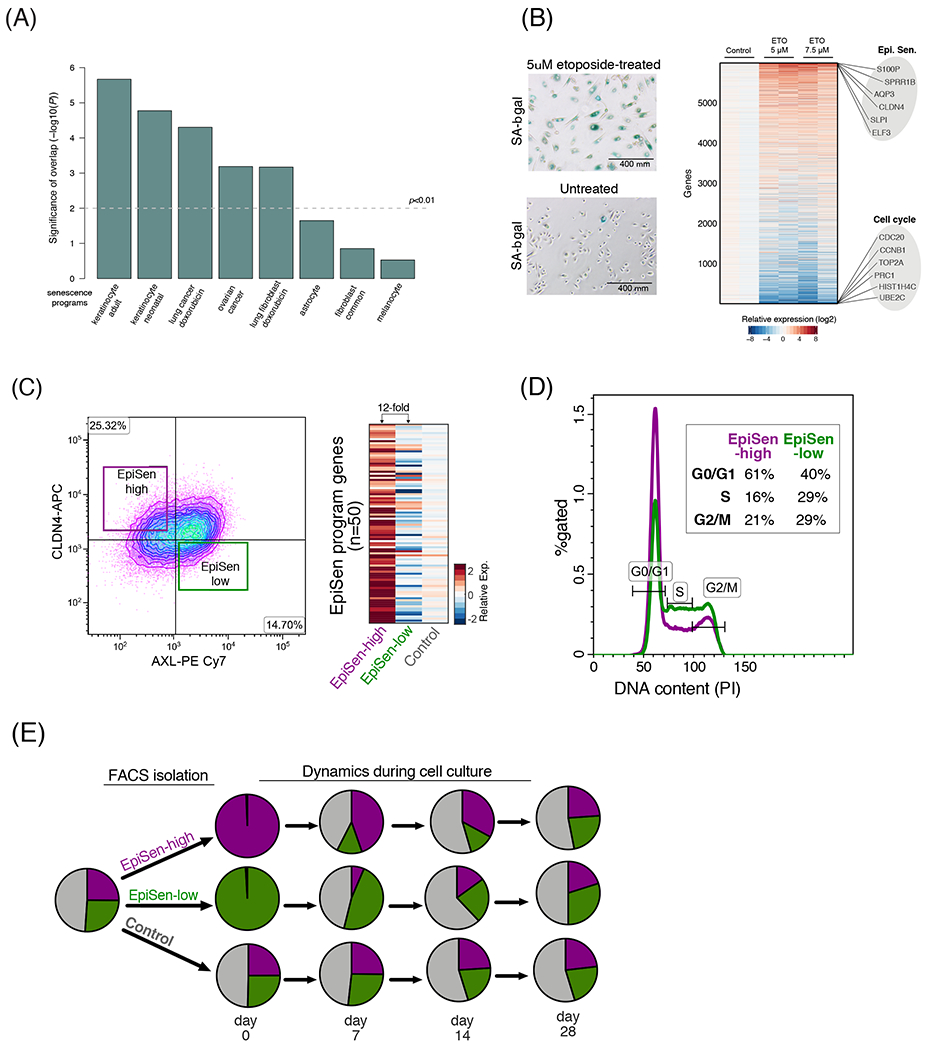
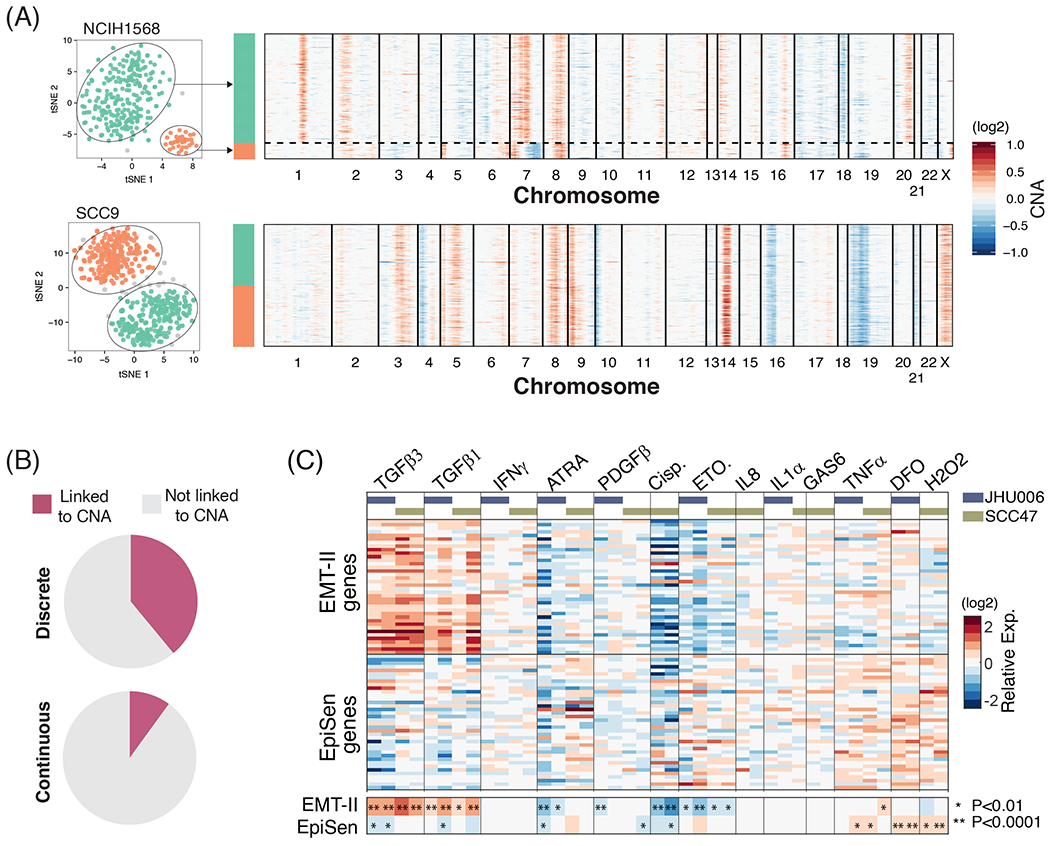
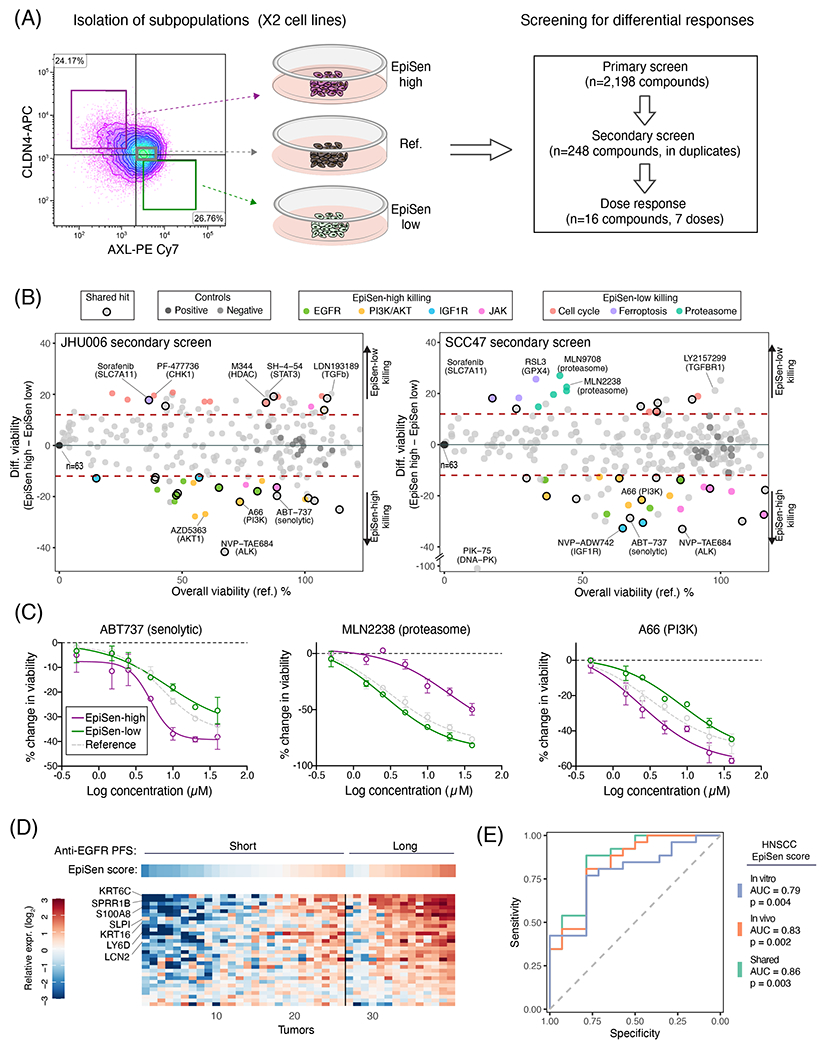
Cultured cell lines are the workhorse of cancer research, but the extent to which they recapitulate the heterogeneity observed among malignant cells in tumors is unclear. Here we used multiplexed single-cell RNA-seq to profile 198 cancer cell lines from 22 cancer types. We identified 12 expression programs that are recurrently heterogeneous within multiple cancer cell lines. These programs are associated with diverse biological processes, including cell cycle, senescence, stress and interferon responses, epithelial-mesenchymal transition and protein metabolism. Most of these programs recapitulate those recently identified as heterogeneous within human tumors. We prioritized specific cell lines as models of cellular heterogeneity and used them to study subpopulations of senescence-related cells, demonstrating their dynamics, regulation and unique drug sensitivities, which were predictive of clinical response. Our work describes the landscape of heterogeneity within diverse cancer cell lines and identifies recurrent patterns of heterogeneity that are shared between tumors and specific cell lines.


Conflict of interest statement

Competing interests

A.R. is a founder and equity holder of Celsius Therapeutics and a SAB member of Neogene Therapeutics, ThermoFisher Scientific and Syros Pharmaceuticals.

Figures

Figure 1.
Figure 1.. Characterizing intra-cell line expression heterogeneity by multiplexed scRNA-seq.
(A) Workflow of the multiplexing strategy used to profile multiple cell lines simultaneously. Cell lines were pooled and profiled by droplet-based scRNA-seq. We used reference CCLE data to assign cells to the most similar cell line based on their overall gene expression and SNP pattern. (B) t-SNE plot of a representative pool demonstrating the robustness of cells’ assignments to cell lines. Cells with inconsistent assignments (by gene expression and SNPs) are denoted and these were excluded from further analyses. (C) Distribution of cancer types profiled.
Figure 2.
Figure 2.. Discrete and continuous patterns of heterogeneity within cell lines.
(A) Illustration of the two types of expression variability investigated. (B) t-SNE plots show exemplary cell lines for the four classes defined by the presence and number of discrete subpopulations identified using DBSCAN. The description of each class and number of cell lines is indicated above the t-SNE plots. (C) Heatmap depicts pairwise similarities between gene expression programs defined for each of the cell clusters derived from the 22 cell lines identified as having one or more discrete subpopulations. Hierarchical clustering identifies only two groups of similar programs (metaprograms). Top panel shows assignment to cancer types. (D) Continuous programs of heterogeneity identified using NMF in a representative cell line that lacks discrete subpopulations (JHU006; see B). Heatmap shows relative expression of genes from four programs, across all cells ordered by hierarchical clustering. NMF programs are annotated (right) and selected genes are indicated (left). (E) Pairwise similarities between NMF programs identified across all the cell lines analyzed and ordered by hierarchical clustering. Programs with limited similarity to all other programs as well as those associated with technical confounders were excluded. Top panel indicates the 4% of NMF programs that were consistent with discrete subpopulations identified by DBSCAN (P<0.001, Fisher’s exact test).
Figure 3.
Figure 3.. Functional annotation of RHPs.
(A) The main heatmap depicts pairwise similarities between all NMF programs (except for those linked to the cell cycle, see Fig. 2E), ordered by hierarchical clustering. Ten clusters (RHPs) are indicated by squares and numbers. Top panel shows assignment to cancer types, highlighting significant enrichment (P<0.05, hypergeometric test) of melanoma and HNSCC cell lines. (B) NMF scores of signature genes of each RHP (rows), with selected genes labeled. Cells (columns) are ordered as in (A). (C) Annotation and selected top genes for each of the 10 RHPs. (D) Functional enrichment (−log10 of FDR-adjusted p-value, hypergeometric test) of RHP genes with eight annotated gene-sets.
Figure 4.
Figure 4.. In vitro RHPs recapitulate in vivo programs of heterogeneity.
(A) Significance of the overlap (−log10(P) for FDR-adjusted hypergeometric test), between RHP gene-sets defined in cell lines (in vitro, X-axis) and in tumors (in vivo, Y-axis). In vivo RHPs are named by a cancer type abbreviation (MEL: melanoma, HNS: HNSCC, GBM: glioblastoma, OVA: ovarian cancer), followed by an associated functional annotation, and whether it was defined by the original study (Orig.) or the current study (Curr., see Fig. S3). (B) Each panel shows the mean Jaccard index (Y-axis) and mean correlation of single cell scores (X-axis) between the NMF programs constituting a specific In vitro RHP (as noted at the top) and all In vivo RHPs. The most similar In vivo RHPs are labeled as in (A). Dashed lines indicate a 99.9% confidence threshold determined by permutations of NMF programs. (C) Scatterplots of melanoma cells based on PC2+PC3 (X-axis) and PC4 (Y-axis). Cells are colored by the relative score for EMT-I and SkinPig genes shared between cell lines and tumors RHPs (left panel) and by whether the cells are from tumors or cell lines (right panel). (D) Scatterplots of HNSCC cells based on PC2 (X-axis) and PC4+PC5 (Y-axis). Cells are colored by the relative score for EMT-II and EpiSen genes shared between cell lines and tumors RHPs (left panel) and by whether the cells are from tumors or cell lines (right panel). (E) Heatmap showing the relative expression of shared EMT-I and SkinPig RHP genes (rows) across melanoma cells (columns), sorted by the relative RHP scores. The cells’ origin from tumors or cell lines is shown by the top panel. (F) Heatmap showing the relative expression of shared EMT-II and EpiSen RHP genes (rows) across HNSCC cells (columns), sorted by the relative RHP scores. The cells’ origin from tumors or cell lines is shown by the top panel.
Figure 5.
Figure 5.. Interrogating the EpiSen RHP in primary cells and model cell lines.
(A) Significance of the overlap (−log10(P), hypergeometric test) between the EpiSen RHP and eight previously reported senescence programs. (B) Left: induction of senescence by etoposide in primary lung bronchial cells confirmed by SA-β-gal staining. Right: heatmap depicts the relative expression of 6,000 genes (rows) in primary lung bronchial cells, 9 days after induction of senescence by etoposide treatment for 48h at two concentrations with 2 biological replicates. EpiSen and cell cycle programs were the most upregulated and downregulated programs, respectively (see fig. S5D); selected genes from these programs are labeled. (C) Isolation of the EpiSen-high (AXL+ CLDN4) and EpiSen-low (AXL+CLDN4) populations by FACS in JHU006. Heatmap shows relative expression of the EpiSen program genes in three sorted subpopulations: two as shown at the right panel and a third control population. (D) FACS analysis of cell cycle by the DNA binding dye propidium iodide (PI) on sorted EpiSen-high and EpiSen-low cells in JHU006. (E) Pie charts depict relative proportions of the EpiSen-high and EpiSen-low subpopulations in SCC47, for an unsorted sample (left, initial distribution), and for sorted subpopulations that were analyzed immediately after sorting (day 0) and at three additional time points (at days 7, 14 and 28 in culture).
Figure 6.
Figure 6.. Genetic and microenvironmental factors partially explain expression heterogeneity.
(A) Representative cell lines showing the association (top panel) or lack thereof (bottom panel) between discrete subpopulations and CNA-based subclones. t-SNE plots on the left show discrete subpopulations identified using DBSCAN (as in Fig. 2B and S1C). Heatmaps on the right depict inferred CNAs ordered according to the expression-based clusters. (B) Percentage of discrete (left) and continuous (right) heterogeneity programs that are associated with genetic subclones. For discrete programs, associations were assessed by comparing the assignment of cells to CNA subclones and to expression-based subpopulations (P<0.001, Fisher’s exact test); for continuous programs, we compared NMF cell scores between different clones (P<0,001, t-test). (C) Main heatmap depicts relative expression of EpiSen program genes and EMT-II program genes following multiple perturbations in SCC47 and JHU006. Smaller heatmap at the bottom shows the average values for the EMT-II genes and EpiSen genes, and asterisks denote significant up or down-regulation (by t-test, P value indicated in figure).
Figure 7.
Figure 7.. Co-existing cellular states differ in drug sensitivity.
(A) Experimental scheme for drug screening: three subpopulations were isolated by FACS and subjected to primary screen, secondary screen and dose response analysis of selected hits. (B) Viability of the reference population (X-axis) and differential viability of the EpiSen-high vs. EpiSen-low populations (Y-axis) upon treatment with 248 compounds tested in the secondary screen, in JHU006 (left) and SCC47 (right), averaged over 2 replicates. Dotted lines represent thresholds for differential sensitivity (as described in Methods). Selected hits and controls are colored by target as specified in the top legends. (C) Dose response curves of three selected compounds in SCC47 measured in duplicate at each concentration, presented by the change in viability relative to vehicle controls. Error bars represent standard deviation. (D) Heatmap showing the expression of EpiSen genes shared between the HNSCC cell lines (in vitro) and tumors (in vivo) programs (see fig. S12) in bulk pre-treatment samples of 40 recurrent or metastatic HNSCC patients, stratified into short and long PFS following treatment with Cetuximab plus platinum-based chemotherapy. Top panel shows the corresponding EpiSen scores. Genes are ordered by differential expression (log2(fold change)) comparing short and long PFS patients, and tumors are ordered within each group according to the EpiSen score. Selected genes are labeled. (E) Receiver operating characteristic (ROC) curves for prediction of long vs. short PFS patients following Cetuximab treatment. Curves depict the predictive power of three potential HNSCC EpiSen signatures (in vitro, in vivo and shared). P values were calculated for each signature separately using multivariate logistic regression correcting for relevant clinicopathological features.

Comment in

References

    1. McGranahan N & Swanton C Biological and therapeutic impact of intratumor heterogeneity in cancer evolution. Cancer Cell 27, 15–26 (2015). - PubMed
    1. Chaffer CL, San Juan BP, Lim E & Weinberg RA EMT, cell plasticity and metastasis. Cancer Metastasis Rev 35, 645–654 (2016). - PubMed
    1. Filbin MG et al. Developmental and oncogenic programs in H3K27M gliomas dissected by single-cell RNA-seq. Science 360, 331–335 (2018). - PMC - PubMed
    1. Patel AP et al. Single-cell RNA-seq highlights intratumoral heterogeneity in primary glioblastoma. Science 344, 1396–401 (2014). - PMC - PubMed
    1. Puram S et al. Single-cell transcriptomic analysis of primary and metastatic tumor ecosystems in head and neck cancer. Cell (2017). - PMC - PubMed

Publication types