Review
. 2021 Feb;203(2):267-280.
doi: 10.1111/cei.13544. Epub 2020 Nov 18.

Th22 response induced by Mycobacterium tuberculosis strains is closely related to severity of pulmonary lesions and bacillary load in patients with multi-drug-resistant tuberculosis

Affiliations
Review

Th22 response induced by Mycobacterium tuberculosis strains is closely related to severity of pulmonary lesions and bacillary load in patients with multi-drug-resistant tuberculosis

B R Imperiale et al. Clin Exp Immunol. 2021 Feb.

Abstract

The role of interleukin-22 (IL-22) in the pathogenesis or tissue repair in human tuberculosis (TB) remains to be established. Here, we aimed to explore the ex-vivo and in-vitro T helper 22 (Th22) response in TB patients and healthy donors (HD) induced by different local multi-drug-resistant (MDR) Mvcobacterium tuberculosis (Mtb) strains. For this purpose, peripheral blood mononuclear cells from drug-susceptible (S-TB) MDR-TB patients and HD were stimulated with local MDR strains and the laboratory strain H37Rv. IL-22 and IL-17 expression and senescent status were assessed in CD4+ and CD8+ cells by flow cytometry, while IL-22 amount was measured in plasma and culture supernatants by enzyme-linked immunosorbent assay (ELISA). We found lower IL-22 amounts in plasma from TB patients than HD, together with a decrease in the number of circulating T cells expressing IL-22. In a similar manner, all Mtb strains enhanced IL-22 secretion and expanded IL-22+ cells within CD4+ and CD8+ subsets, being the highest levels detected in S-TB patients. In MDR-TB, low systemic and Mtb-induced Th22 responses associated with high sputum bacillary load and bilateralism of lung lesions, suggesting that Th22 response could be influencing the ability of MDR-TB patients to control bacillary growth and tissue damage. In addition, in MDR-TB patients we observed that the higher the percentage of IL-22+ cells, the lower the proportion of programmed cell death 1 (PD-1)+ or CD57+ T cells. Furthermore, the highest proportion of senescent T cells was associated with severe lung lesions and bacillary load. Thus, T cell senescence would markedly influence Th22 response mounted by MDR-TB patients.

Keywords: IL-22; Mycobacterium tuberculosis strains; Th22 response; multi-drug-resistant tuberculosis.


Conflict of interest statement

The authors declare no conflicts of interest.

Figures

Fig. 1
Fig. 1
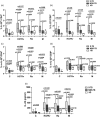
Ex‐vivo T helper type 22 (Th22) response in patients with active tuberculosis (TB) and healthy donors. (a) Interleukin (IL)‐22 secretion was detected in plasma from patients with drug‐susceptible (S‐TB, n = 27) and multi‐drug‐resistant [(MDR)‐TB, n = 59] tuberculosis and healthy donors (HD, n = 25). Results are expressed as pg/ml. Medians and 25th–75th percentiles are shown. Statistical differences: P‐values are shown for TB patients versus HD values. (b) Intracytoplasmatic IL‐22 expression was determined in recently isolated peripheral blood mononuclear cells (PBMCs) from S‐TB (= 27) and MDR‐TB patients (n = 59) and HD (n = 25), as described in Materials and methods. The percentages of CD4+IL‐22+ and CD8+IL‐22+ cells were determined by flow cytometry and individual absolute number was then calculated. Results are expressed as median and 25th–75th percentiles. Statistical differences: P‐values are shown for TB patients versus HD values.
Fig. 2
Fig. 2
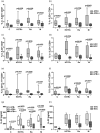
In‐vitro Mycobacterium tuberculosis (Mtb)‐induced T helper type 22 (Th22) response in tuberculosis (TB) patients and healthy donors (HD). (a–d) Peripheral blood mononuclear cells (PBMCs) from 27 S‐TB, 59 multi‐drug‐resistant (MDR)‐TB and 25 HD were cultured for 6 days alone (control) or with M, Ra and H37Rv strains. Then, intracellular interleukin (IL)‐2 expression [intracytoplasmatic (ic)‐IL‐22] (a,b) and membrane‐bound IL‐22 expression (m‐IL‐22) (c,d) was determined in CD4+ and CD8+ T cells by fluorescence activated cell sorter (FACS). Results are expressed as percentages of ic‐IL‐22+ within CD4+ and CD8+ cell subsets (percentages of ic‐IL‐22+/CD4+ and ic‐IL‐22+/CD8+) and percentages of m‐IL‐22+ cells in CD4+ and CD8+ cell subsets (percentages of m‐IL‐22+/CD4+ and m‐IL‐22+/CD8+). Median and 25th–25th percentiles are shown. Statistical differences: P‐values are shown for strains versus control (above each bar) and for S‐TB versus MDR‐TB or HD (above each line connecting bars). (e) IL‐22 amounts (pg/ml) were determined in PBMC supernatants by enzyme‐linked immunosorbent assay (ELISA). Results are expressed as median and 25th–75th percentiles; statistical differences: P‐values for strains versus control (above each bar) and for S‐TB versus HD (above each line connecting bars) are shown.
Fig. 3
Fig. 3
Differential Mycobacterium tuberculosis (Mtb)‐induced expansion of interleukin (IL)‐22+IL‐17+ and IL‐22+IL‐17 cells in tuberculosis (TB) patients. Peripheral blood mononuclear cells (PBMCs) from 27 susceptible (S)‐TB and 59 multi‐drug‐resistant (MDR)‐TB patients and 25 healthy donors (HD) were cultured for 6 days alone or with Mtb strains. Then, intracellular expression of IL‐22 and IL‐17 was determined by fluorescence‐activated cell sorter (FACS) analysis. Results are expressed as percentages of IL‐22+IL‐17+ and IL‐22+IL‐17 cells within CD4+ (a,b, respectively) and percentages of IL‐22+IL‐17+ and IL‐22+IL‐17 cells within CD8+ cells (c,d, respectively). Medians and 25th–75th percentiles are shown; statistical differences: P‐values are shown for strains versus control (above each bar) and for S‐TB versus MDR‐TB and HD (above each line connecting bars).
Fig. 4
Fig. 4
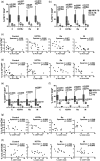
Ex‐vivo and in‐vitro T helper type 22 (Th22) response from tuberculosis (TB) patients associated with clinical data. Multi‐drug‐resistant (MDR)‐TB patients were grouped according to the number of acid‐fast bacilli (AFB) detected in sputum smear (AFB : 0 bacilli in 100 fields; AFB+: 10–99 bacilli in 100 fields; AFB++: 1–10 bacilli/field in 50 observed fields) or the magnitude of pulmonary lesions (UCC = unilateral with cavity; BCC = bilateral with cavity), and then the percentages of IL‐22+ and IL‐22+IL‐17+ cells within CD4+ and CD8+ subsets were calculated for each group. (a,b) Medians and 25th–75th percentiles of percentages of IL‐22+ cells/CD4+ (a) and IL‐22+ cells/CD8+ cells (b) in AFB+ and AFB++ patients; statistical differences: P‐values for AFB+ versus AFB++ are shown. (c,d) Medians and 25th–75th percentiles of percentages of IL‐22+/CD4+ cells (c) and IL‐22+/CD8+ cells (d) in UCC and BCC patients; statistical differences: P‐values for UCC versus BCC are shown. (e–f) Medians and 25th–75th percentiles of percentages of IL‐22+IL‐17+ cells/CD4+ (e) and IL‐22+IL‐17+/CD8+ cells (h) in AFB+ and AFB++ patients; statistical differences: P‐values for AFB+ versus AFB++ are shown. (h) IL‐22 amounts (pg/ml) in peripheral blood mononuclear cell (PBMC) supernatants from AFB, AFB+ and AFB++ patients (mean and 25th–75th percentiles). (g) IL‐22 amounts (pg/ml) in PBMC supernatants from UCC and BCC patients (mean and 25th–75th percentiles). Statistical differences: P‐values for AFB++ versus AFB or AFB+ patients are shown.
Fig. 5
Fig. 5
Programmed cell death 1 (PD‐1)+ and CD57+ cells are markedly increased in peripheral blood mononuclear cells (PBMCs) from multi‐drug‐resistant tuberculosis (MDR)‐TB patients; 6 day‐cultured PBMC from 23 drug‐susceptible (S)‐TB, 50 MDR‐TB and 20 healthy donors (HD) were tested for their PD‐1 and CD57 surface expression in CD4+ and CD8+ cells by fluorescence activated cell sorter (FACS). (a,b) Figures show mean and 25th–75th percentiles of percentages of PD‐1+ cells/CD4+ (a) and PD‐1+ cells/CD8+ (b); statistical differences: P‐values for TB versus HD and for MDR‐TB versus S‐TB are shown above lines connecting bars. (c,d) Correlation between percentages of IL‐22+ cells/CD4+ and PD‐1+ cells/CD4+ (c) and of IL‐22+ cells/CD8+ and PD‐1+ cells/CD8+ (d); individual data and Spearman’s rho coefficients are shown. (e,f) Figures show mean and 25th–75th percentiles of percentages of CD57+ cells/CD4+ (e) and CD57+ cells/CD8+ (f); statistical differences: P‐values for TB versus HD and for MDR‐TB versus S‐TB are shown. (g,h) Correlation between percentages of IL‐22+ cells/CD4+ and CD57+ cells/CD4+ (c) and percentages of IL‐22+ cells/CD8+ and CD57+ cells/CD8+ (d); individual data and Spearman’s rho coefficients.

References

    1. Dudakov JA, Hanash AM, van den Brink MRM. Interleukin‐22: immunobiology and pathology. Annu Rev Immunol 2015; 33:747–85. - PMC - PubMed
    1. Wolk K, Sabat R. Interleukin‐22: a novel T‐ and NK‐cell derived cytokine that regulates the biology of tissue cells. Cytokine Growth Factor Rev 2006; 17:367–80. - PubMed
    1. Ronacher K, Sinha R, Cestari M. IL‐22: an underestimated player in natural resistance to tuberculosis? Front Immunol 2018; 9:2209. - PMC - PubMed
    1. Zenewicz LA. IL‐22: there is a gap in our knowledge. ImmunoHorizons 2018; 2:198–207. - PMC - PubMed
    1. Sonnenberg GF, Fouser LA, Artis D. Functional biology of the IL‐22‐IL‐22R pathway in regulating immunity and inflammation at barrier surfaces. Adv Immunol 2010; 107:1–29. - PubMed

Publication types

MeSH terms