

Metabolic shift underlies recovery in reversible infantile respiratory chain deficiency
- PMID: 33128823
- PMCID: PMC7705457
- DOI: 10.15252/embj.2020105364
Metabolic shift underlies recovery in reversible infantile respiratory chain deficiency
Abstract
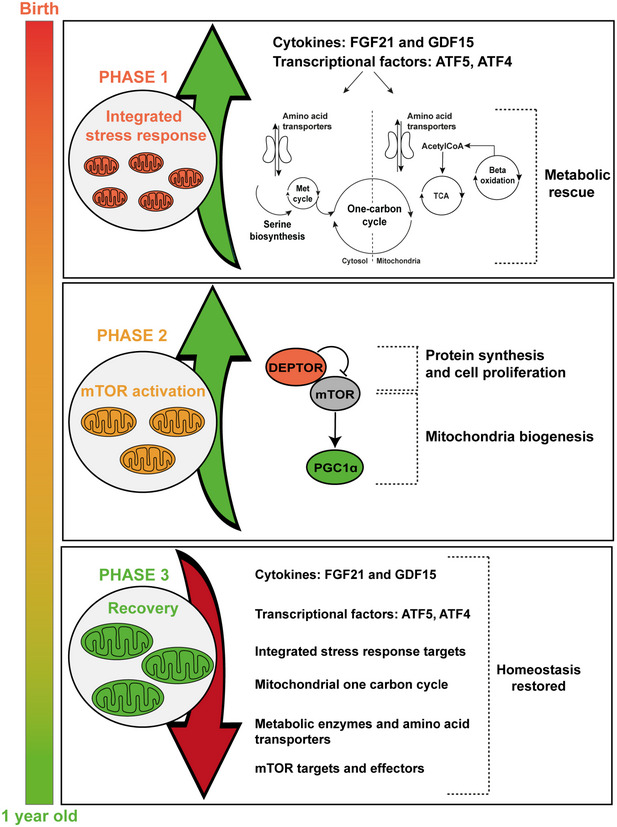
Reversible infantile respiratory chain deficiency (RIRCD) is a rare mitochondrial myopathy leading to severe metabolic disturbances in infants, which recover spontaneously after 6-months of age. RIRCD is associated with the homoplasmic m.14674T>C mitochondrial DNA mutation; however, only ~ 1/100 carriers develop the disease. We studied 27 affected and 15 unaffected individuals from 19 families and found additional heterozygous mutations in nuclear genes interacting with mt-tRNAGlu including EARS2 and TRMU in the majority of affected individuals, but not in healthy carriers of m.14674T>C, supporting a digenic inheritance. Our transcriptomic and proteomic analysis of patient muscle suggests a stepwise mechanism where first, the integrated stress response associated with increased FGF21 and GDF15 expression enhances the metabolism modulated by serine biosynthesis, one carbon metabolism, TCA lipid oxidation and amino acid availability, while in the second step mTOR activation leads to increased mitochondrial biogenesis. Our data suggest that the spontaneous recovery in infants with digenic mutations may be modulated by the above described changes. Similar mechanisms may explain the variable penetrance and tissue specificity of other mtDNA mutations and highlight the potential role of amino acids in improving mitochondrial disease.
Keywords: digenic inheritance; homoplasmic tRNA mutation; mitochondrial myopathy; reversible infantile respiratory chain deficiency.
© 2020 The Authors Published under the terms of the CC BY 4.0 license.
Conflict of interest statement
The authors declare that they have no conflict of interest.
Figures
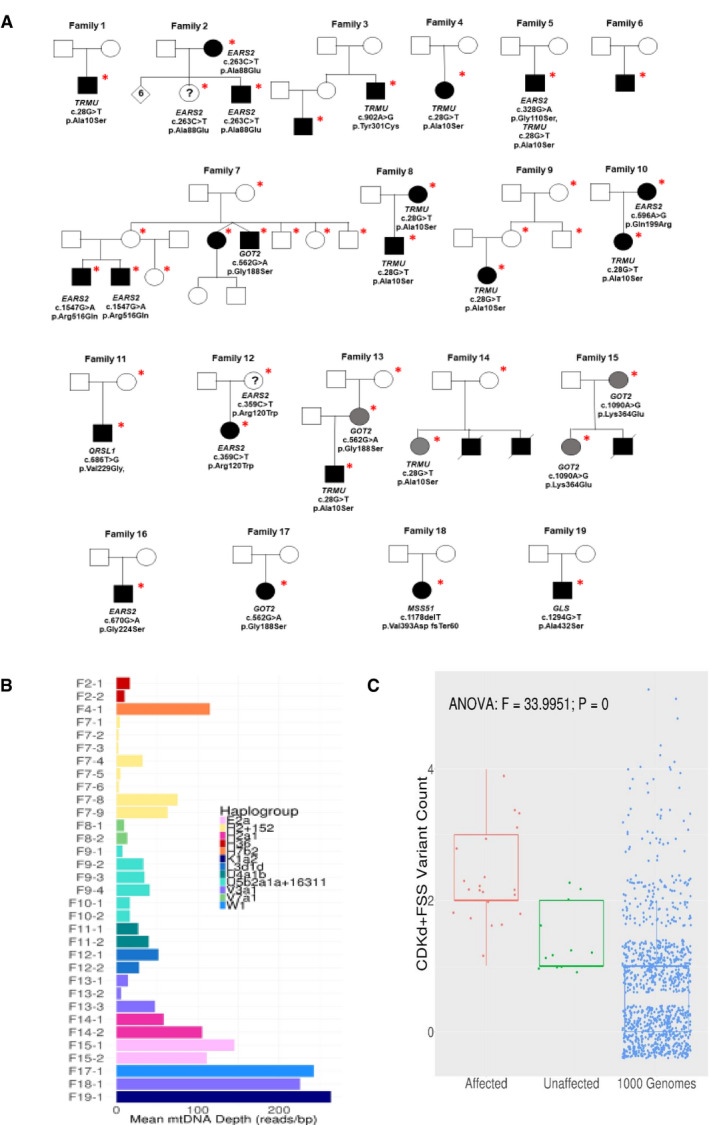
Pedigrees and genetic variants. The * symbol indicates the individuals where DNA analysis was performed while circles represent female, square represents male and the filled‐in square or circle represent individuals expressing mutations while deceased individuals were marked with a diagonal line.
Exome mtDNA read depth and mtDNA haplogroups in the families homoplasmic for m.14674T>C.
Variant Scatter/boxplot shows the significant difference between mean per group damaging allele counts (RIRCD affected vs unaffected vs 1,044 × 1000 Genomes control exomes) in the genes EARS2, TRMU, QRSL1, GOT2, GLS, MSS51 and m.14674T>C. The counts are from individual patients and controls thus one point on the boxplot represents damaging allele counts for 1 person. The central band represents the median, the lower and upper hinges correspond to the first and third quartiles (25 and 75%) while the whiskers extend to the highest and lowest points within the data (1.5× the inter‐quartile range).
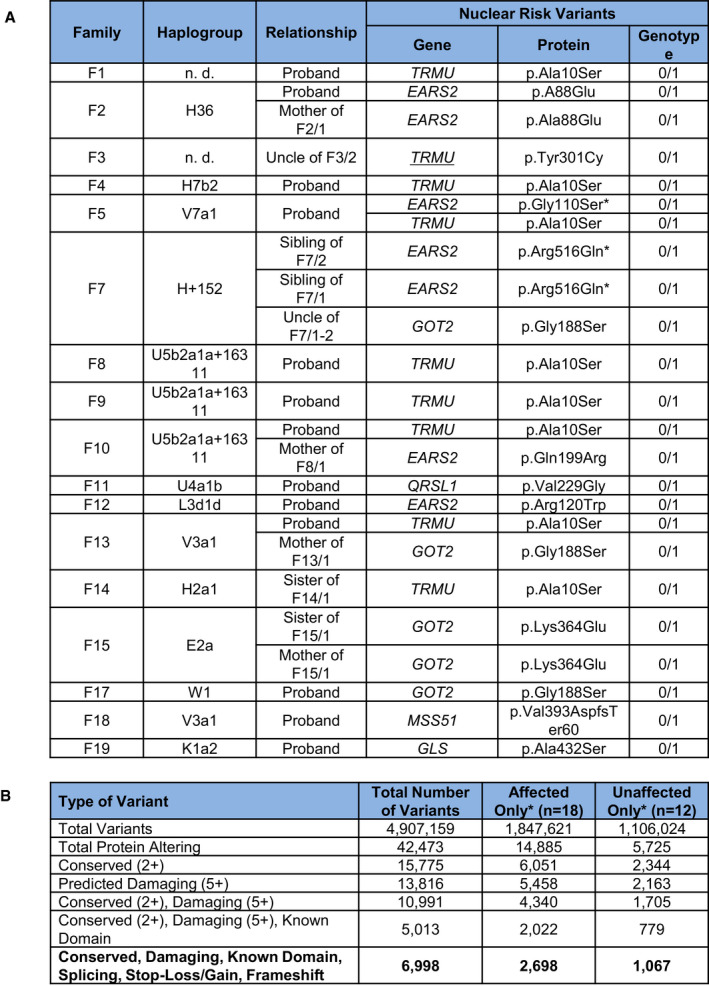
Mitochondrial haplogroups and digenic nuclear variants in affected RIRCD family members.
Number of exome variants at each stage of filtering in total and for affected and unaffected individuals in RIRCD families with homoplasmic m.14674T>C.
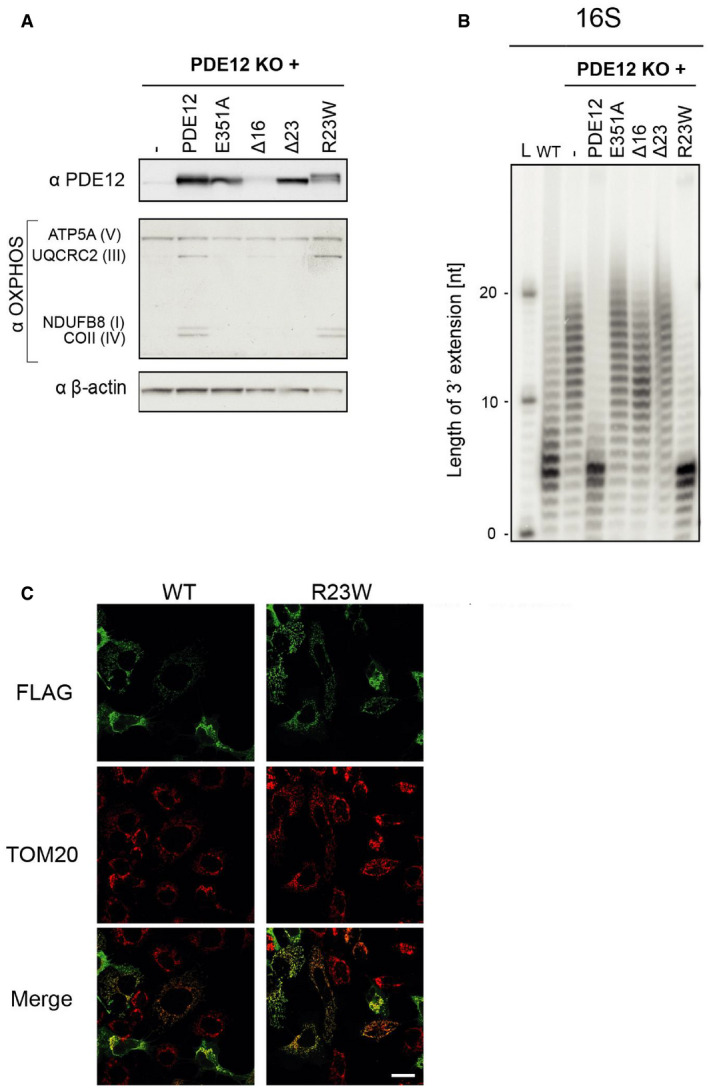
Western blot of total cell lysate of PDE12 knockout cells expressing WT PDE12, p.Glu351Ala (catalytic mutant), Δ16 (coding for PDE12 lacking 16 first aa), Δ23 mutants (coding for PDE12 lacking 23 first aa) and p.Arg23Trp PDE12 cDNA. B‐actin was used as loading control. Our previous study (Pearce et al, 2017) showed that the steady‐state levels of OXPHOS complexes are affected in the PDE12 KO as compared to the WT control cells.
Radioactive MPAT assay for 16S mt‐rRNA extracted from HEK293T (WT), PDE12 knockout cells (KO) and for PDE12 KO cells expressing WT PDE12, p.Glu351Ala, Δ16, Δ23 mutants and p.Arg23Trp PDE12 cDNA for 24 hr. Experiments and cell lines as described in (Pearce et al, 2017).
Immunofluorescence to confirm mitochondrial localisation of the p.Arg23Trp PDE12 variant in human cells. TOM20, translocator of the outer mitochondrial membrane 20. Scale bar = 20 μm.
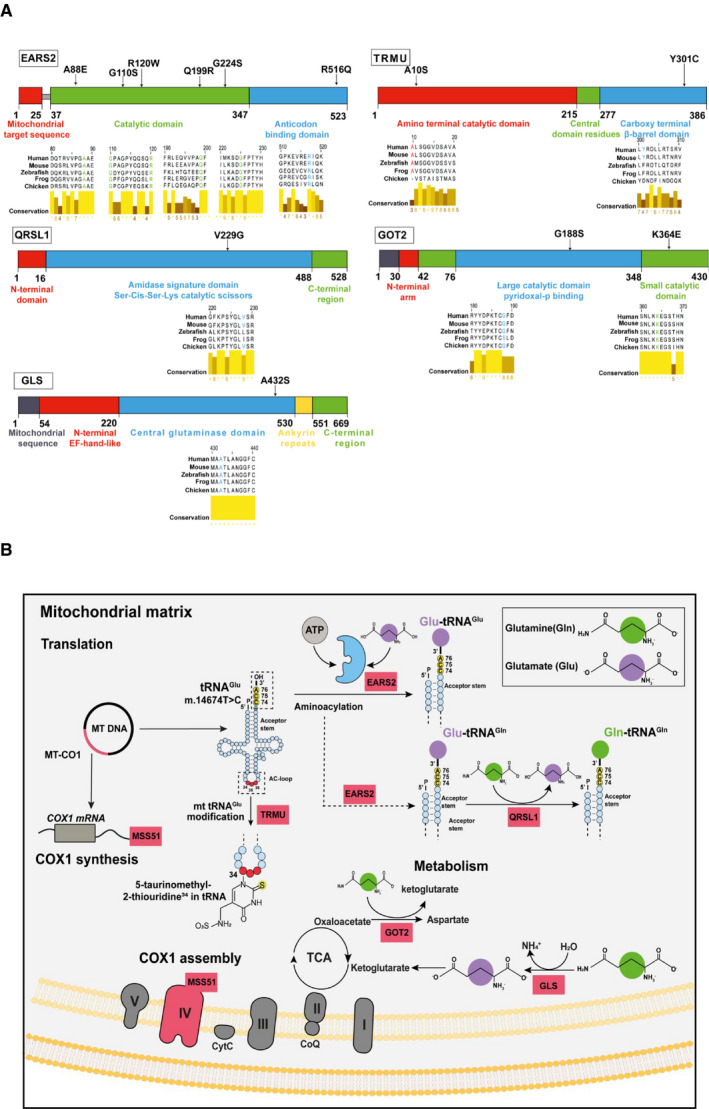
Schematic diagram of affected proteins and the locations of the point mutations identified in: EARS2 p.Gly110Ser, p.Gly224Ser, p.Arg516Gln, p.Arg120Trp, p.Gln199Arg and p.Ala88Glu mutations‐catalytic and anticodon binding domain of the protein; TRMU p.Tyr301Cys and p.Ala10Ser‐ amino terminal catalytic and carboxy terminal β‐barrel domain; QRSL1 p.Val229Gly‐amidase signature domain; GOT2 p.Gly188Ser and p.Lys364Glu located in the large catalytic and small catalytic domains and GLS p.Ala432Ser found in the central glutaminase domain. Multiple sequence alignment of the above mentioned proteins shows the conservation of the affected amino acids across species using Jalview software. Analysis was performed using protein sequences from human (Q5JPH6, O75648, Q9H0R6, P00505, O94925), mouse (Q9CXJ1, Q9DAR5, Q9CZN8, P05202, D3Z7P3), zebrafish (Q0P499, Q503J2, F1QAJ4, Q7SYK7, Q8JFS4), frog (Q66JG3, F6TJB0, Q0VFI5, Q28F67, F7B417) and chicken (Q5ZJ66, Q5ZKW0, F1NLA0, P00508, A0A1D5PNV1).
Schematic diagram of affected proteins showing their contribution to (i) mitochondrial protein translation (EARS2 which aminoacylates mt‐tRNAGlu and mt‐tRNAGln and QRLS1 which transamidates Glu‐tRNAGln to form the correctly charged Gln‐tRNAGln), (ii) amino acid metabolism (GOT2 which catalyses the interconversion of oxaloacetate and glutamate into aspartate and α‐ketoglutarate while GLS metabolises glutamine to ammonia and glutamate which is further catabolised to the TCA intermediate α‐ketoglutarate to fuel the mitochondrial carbon pool) and (iii) COX1 assembly and synthesis due to the dual role of MSS51. MSS51 is not included in (A) as the identified mutation in our patients is a frameshift mutation leading to a premature stop codon and most likely no protein being translated.
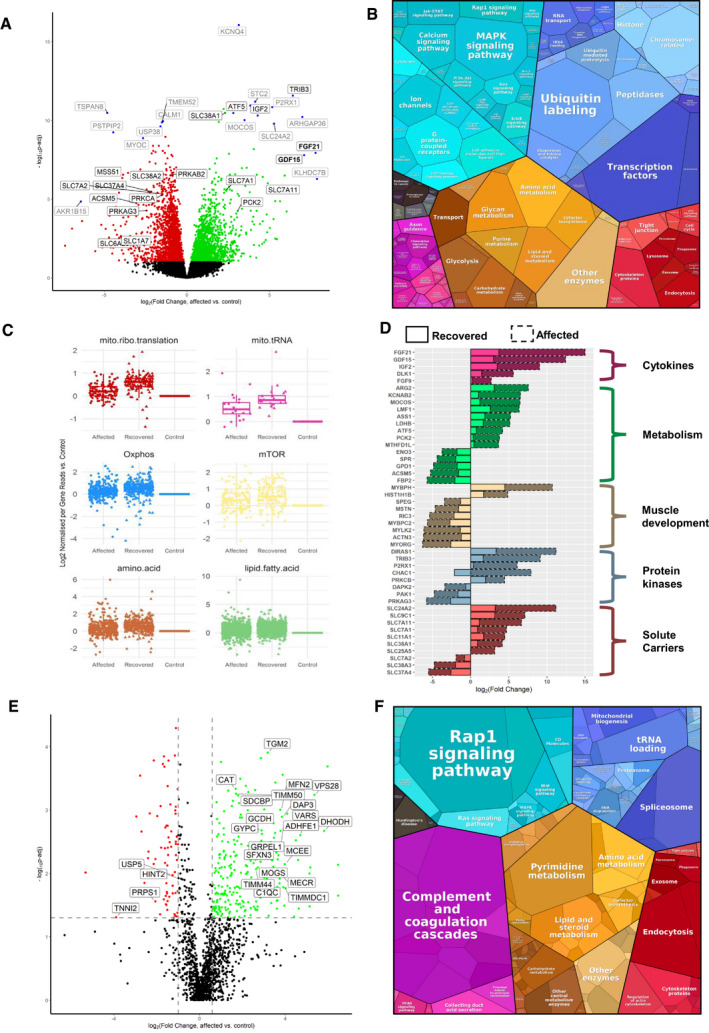
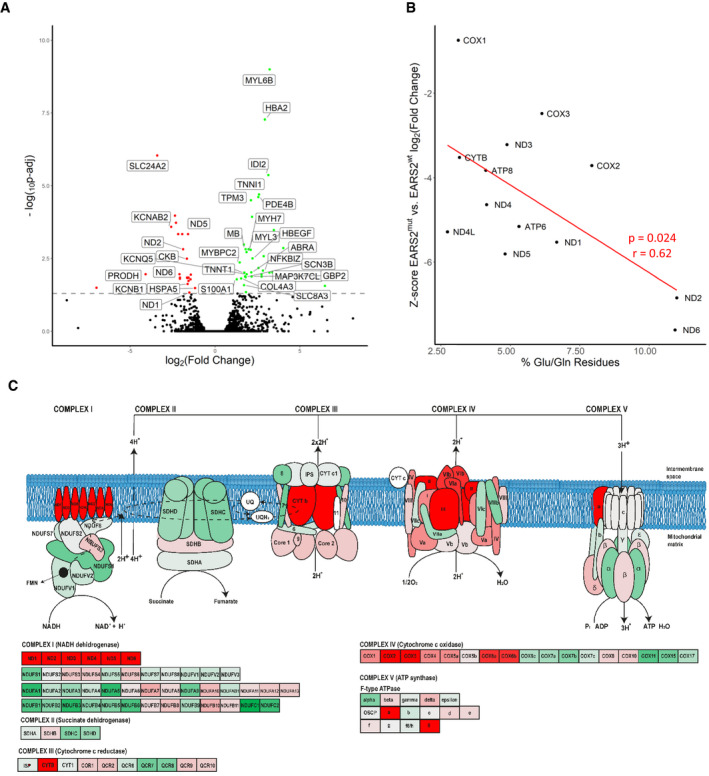
Volcano plot shows genes where RNA reads are statistically significant under‐ or over‐expressed in five RIRCD affected individuals vs six controls resulted from DESeq2 analysis. Decreased genes are represented in red, the upregulated ones are in green while blue dots highlight most outlying genes (defined by absolute (log2(fold change) + log10(Padj)) > 10). Genes that were not statistically significant are represented in black. Grey and black gene names indicate top 30% of the most dysregulated genes with a highlight on ones involved in metabolism. For the calculation of P‐value or Padj, we have employed the R package DESeq2 where the P‐values obtained by the Wald test are corrected for multiple testing using the Benjamini and Hochberg method by default.
Representation of the KEGG terms associated with differentially expressed RNAs and their corresponding proteins in five affected patients vs six controls showing major pathway changes in patient muscle (
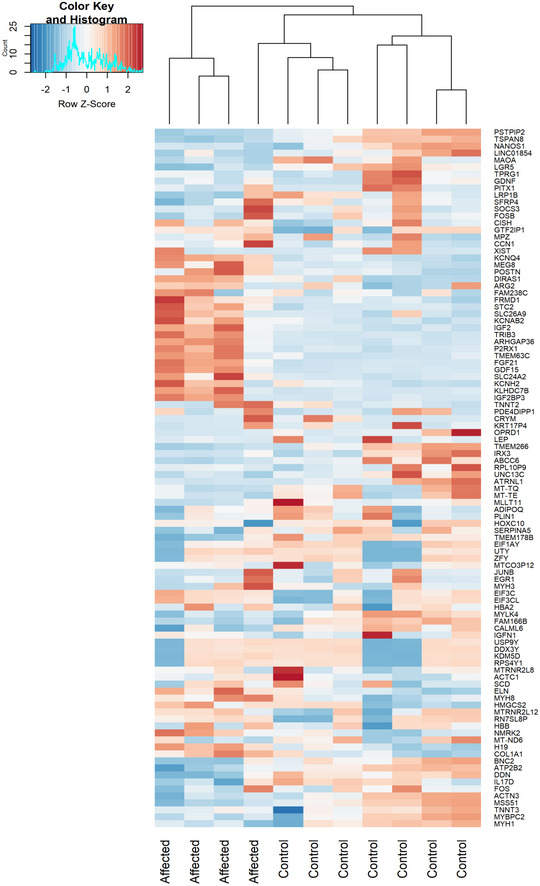
https://bionic-vis.biologie.uni-greifswald.de/ ).Abnormal transcription of genes involved in various biological metabolic pathways derived from our RNA‐seq (RNA‐seq read counts/person/gene for n = 6 RIRCD affected individuals, n = 5 controls and n = 1 (biological replicate analysed in four technical replicates) recovered) data showing that their expression returned close to normal levels in patient muscle after recovery. The central band represents the median, the lower and upper hinges correspond to the first and third quartiles (25 and 75%) while the whiskers extend to the highest and lowest points within the data (1.5× the inter‐quartile range).
Relevant functional changes in gene expression showing the major genes that return to baseline or contribute to the recovery in RIRCD patients. The data depicted are between the affected and recovered biopsies of the same patient (F6/1M).
Comparative proteome profiling of proteins that are significantly under‐ or over‐expressed in RIRCD affected vs control individuals (P‐Anova < 0.05‐statistically significant ‐ horizontal line). Proteins which are decreased are represented in red while the upregulated ones are in green while proteins that did not reach statistical significance threshold are marked in black. Vertical lines are delimiting the regulated proteins resulted from the proteomics analysis (the cut‐off values were determined based on the 2× standard deviation and the normal distribution from all identified protein's log2 ratio in which the bell curve is symmetric around the mean, therefore, an average log2 ratio of a protein which < −2.2 or > 0.98 was considered as regulated).
Proteomap representation of the major altered pathways in RIRCD affected muscle compared to control individuals where the size of each circle or hexagon represents the fold change.
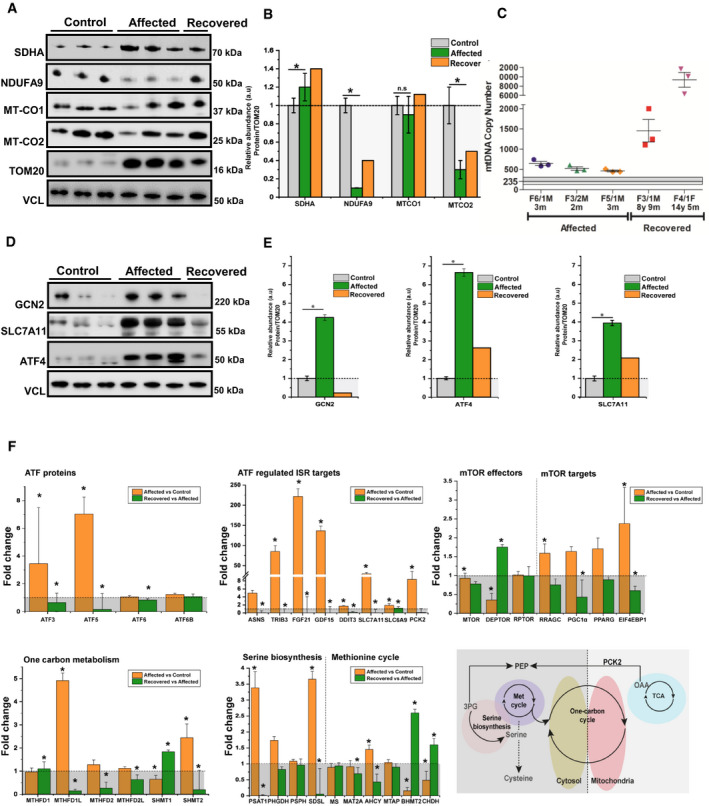
Western blotting analysis depicts mitochondrial proteins (NDUFA9‐Complex I, SDHA‐Complex II, MTCO1‐Complex IV and MTCO2‐Complex IV) levels in control‐derived muscle (n = 3), patient‐derived muscle during the symptomatic phase (n = 3) and patient‐derived muscle after recovery (n = 1). VCL was used as a loading control while the densitometry analysis was done based on the mitochondrial protein TOM20.
Densitometry analysis of the immunoblotting from (A) showing an increase in SDHA (Complex II), while NDUFA9 (Complex I) probably as a compensatory mechanism and MT‐CO2 (Complex IV) show significant reductions as the majority of mitochondrial encoded proteins belong to this two complexes, thus being destabilised by the defective mitochondrial mistranslation. Graphs show means ± SD of triplicate samples (controls and affected muscle), and results obtained from (n = 1) recovered muscle. For statistical analysis, unpaired Student's t‐test was employed where *P ≤ 0.05 was considered statistically significant.
Mitochondrial DNA copy numbers were determined in affected (n = 3) and recovered individuals (n = 2) and compared with control individuals (n = 4, 3 months, 3 years, 4 years and 7 years) using qPCR showing a significant increase in recovered muscle. Graph shows mean ± SD for each biological replicate. The average of controls are represented as horizontal line, and graphs show mean ± SD of replicates.
Western blotting analysis of proteins involved in the amino acid sensing and integrated stress response: GCN2, SLC7A11 and ATF4 in control‐derived muscle (n = 3), patient‐derived muscle during the symptomatic phase (n = 3) and patient‐derived muscle after recovery (n = 1). All samples were normalised to VCL which was used as a loading control.
Densitometry analysis of proteins from (D) showing a significant increase of major transducers of ISR such as GCN2 and ATF4. Consistent with ISR, activation is also the increase in SLC7A1. Graphs show means ± SD of triplicate samples (controls and affected muscle), and results obtained from n = 1 recovered muscle. Similar results were observed in at least two independent results (due to the limited amount of sample). Statistical analysis unpaired Student's t‐test was employed where *P ≤ 0.05 was considered statistically significant.
Transcriptomic pathways related to ATFs and ISR changed in affected patients compared with controls (RIRCD n = 5; controls n = 6) and in recovered muscle compared with affected muscle (n = 1, affected and recovered muscle was collected from the same individual and was analysed using 4 technical replicates) and schematic representation of the metabolic pathways impacted in patient muscle (bottom, right panel). Results are expressed as fold change of the affected compared with controls or of the affected muscle compared with recovered and data are shown as mean ± SEM. For the calculation of P‐value or Padj, we have employed the R package DESeq2 where the P‐values obtained by the Wald test are corrected for multiple testing using the Benjamini and Hochberg method by default where *P ≤ 0.1.
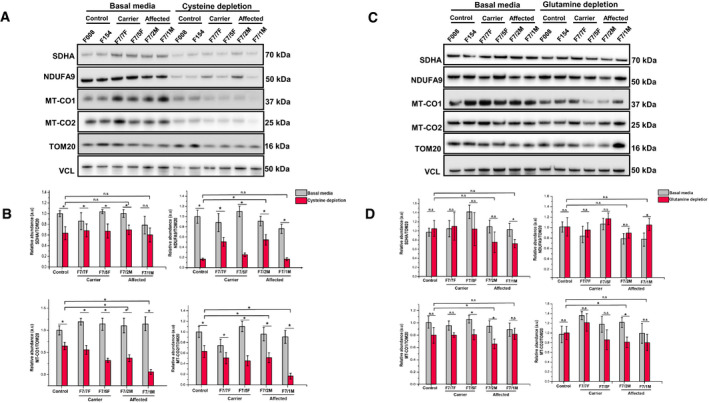
Patient n = 4 (F7/7F‐healthy carrier, F7/2M‐RIRCD, F7/5F‐healthy carrier, F7/1M‐RIRCD without a clear second mutation) and control fibroblasts (n = 2) were grown for 12 days in media containing 0.02 mM cysteine and 5% dialysed FBS. Proteins belonging to mitochondrial complexes (NDUFA9‐Complex I, SDHA‐Complex II, MTCO1‐Complex IV and MTCO2‐Complex IV) were analysed via Western blotting. VCL was used as a loading control, and the densitometry analysis was done based on the mitochondrial proteinTOM20.
Densitometry analysis of proteins from (A) showing no significant changes in OXPHOS proteins upon glutamine/glutamic acid depletion. Control bar represents an average of the two control fibroblast lines employed (F008 and F154). Graphs show means ± SD of duplicate samples. For statistical analysis, unpaired Student's t‐test was employed where *P ≤ 0.05 was considered statistically significant.
Patient (F7/7F‐healthy carrier, F7/2M‐RIRCD, F7/5F‐healthy carrier, F7/1M‐RIRCD without a clear second mutation) and control fibroblasts were grown for 12 days in media with no added glutamine or glutamic acid and 5% dialysed FBS. Cells were lysed, and the above mentioned mitochondrial proteins were checked via Immunoblotting. VCL was used as a loading control while the densitometry analysis (D) was done based on the mitochondrial proteinTOM20. Control bar represents an average of the two control fibroblast lines employed (F008 and F154). Although we could observe significant changes upon cysteine depletion in all conditions, the phenotype was exacerbated in the digenic fibroblasts compared with the controls. Graphs show means ± SD of duplicate samples (*P ≤ 0.05 unpaired Student's t‐test was employed). All experiments were performed in triplicate n = 3, and similar results were observed in all experiments.
Volcano plot analysis of transcriptomic changes where statistically significant genes are delimited by a horizontal line. Decreased genes are represented in red while the upregulated ones are in green, while genes that were not statistically significant are represented in black. For the calculation of P‐value or Padj, we have employed the R package DESeq2 where the P‐values obtained by the Wald test are corrected for multiple testing using the Benjamini and Hochberg method by default. Labelled gene names represent top 60% most regulated genes.
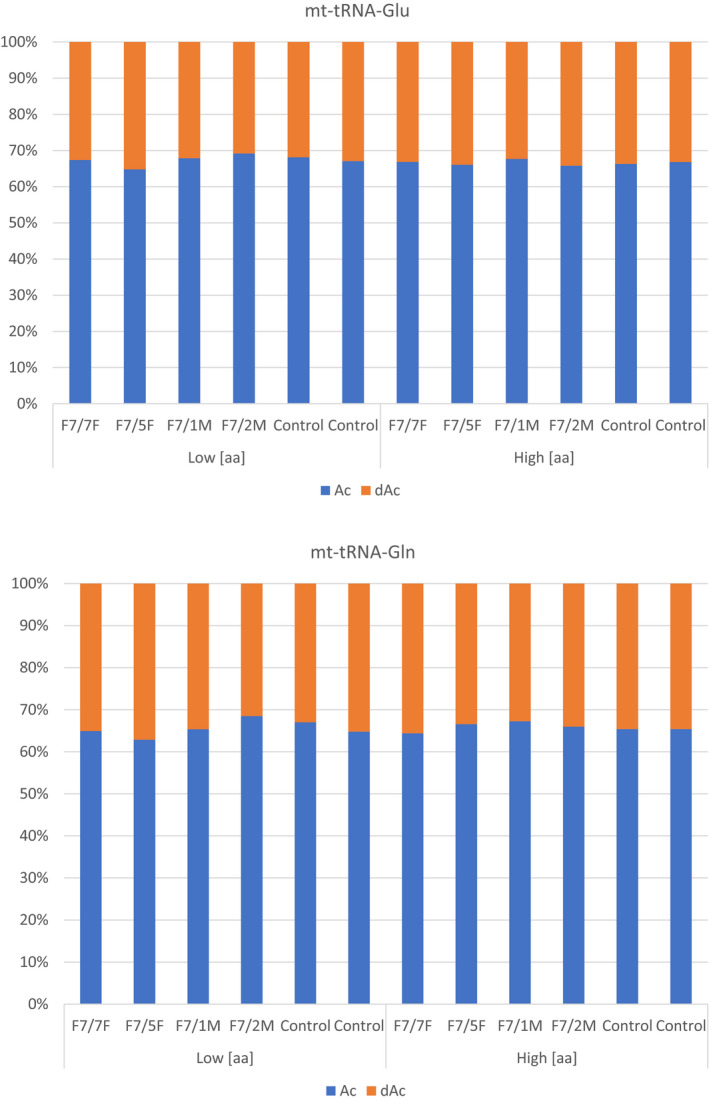
Analysis of altered mitochondrial gene expression resulted from our RNA‐seq showing that affected genes and their coding proteins carry a high numbers of glutamic acid and glutamine residues, in accordance with the mitochondrial translational defect.
Schematic representation of the mitochondrial respiratory chain enzymes resulted from the differential gene expression where red colour means significantly downregulated, green means significantly upregulated genes.
References
-
- AlJohani A, Khan MI, Bonneville A, Guo C, Jeffery J, O'Neill L, Syed DN, Lewis SA, Burhans M, Mukhtar H et al (2019) Hepatic stearoyl CoA desaturase 1 deficiency increases glucose uptake in adipose tissue partially through the PGC‐1alpha‐FGF21 axis in mice. J Biol Chem 294: 19475–19485 - PMC - PubMed
-
- Bartsakoulia M, Mupsilonller JS, Gomez‐Duran A, Yu‐Wai‐Man P, Boczonadi V, Horvath R (2016) Cysteine supplementation may be beneficial in a subgroup of mitochondrial translation deficiencies. J Neuromuscul Dis 3: 363–379 - PubMed
Publication types
MeSH terms
Substances
Grants and funding
- G0800674/MRC_/Medical Research Council/United Kingdom
- G1000848/MRC_/Medical Research Council/United Kingdom
- MC_UU_00015/4/MRC_/Medical Research Council/United Kingdom
- MR/N025431/2/MRC_/Medical Research Council/United Kingdom
- MR/J010448/1/MRC_/Medical Research Council/United Kingdom
- MR/N025431/1/MRC_/Medical Research Council/United Kingdom
- MR/S002065/1/MRC_/Medical Research Council/United Kingdom
- MC_UU_00015/7/MRC_/Medical Research Council/United Kingdom
- MR/N010035/1/MRC_/Medical Research Council/United Kingdom
- MC_UU_00015/9/MRC_/Medical Research Council/United Kingdom
- WT_/Wellcome Trust/United Kingdom
LinkOut - more resources
Full Text Sources
Medical
Molecular Biology Databases
Miscellaneous
