. 2020 Dec 3;80(5):828-844.e6.
doi: 10.1016/j.molcel.2020.10.010. Epub 2020 Oct 30.

3D Culture Models with CRISPR Screens Reveal Hyperactive NRF2 as a Prerequisite for Spheroid Formation via Regulation of Proliferation and Ferroptosis

Affiliations

3D Culture Models with CRISPR Screens Reveal Hyperactive NRF2 as a Prerequisite for Spheroid Formation via Regulation of Proliferation and Ferroptosis

Nobuaki Takahashi et al. Mol Cell. .

Abstract

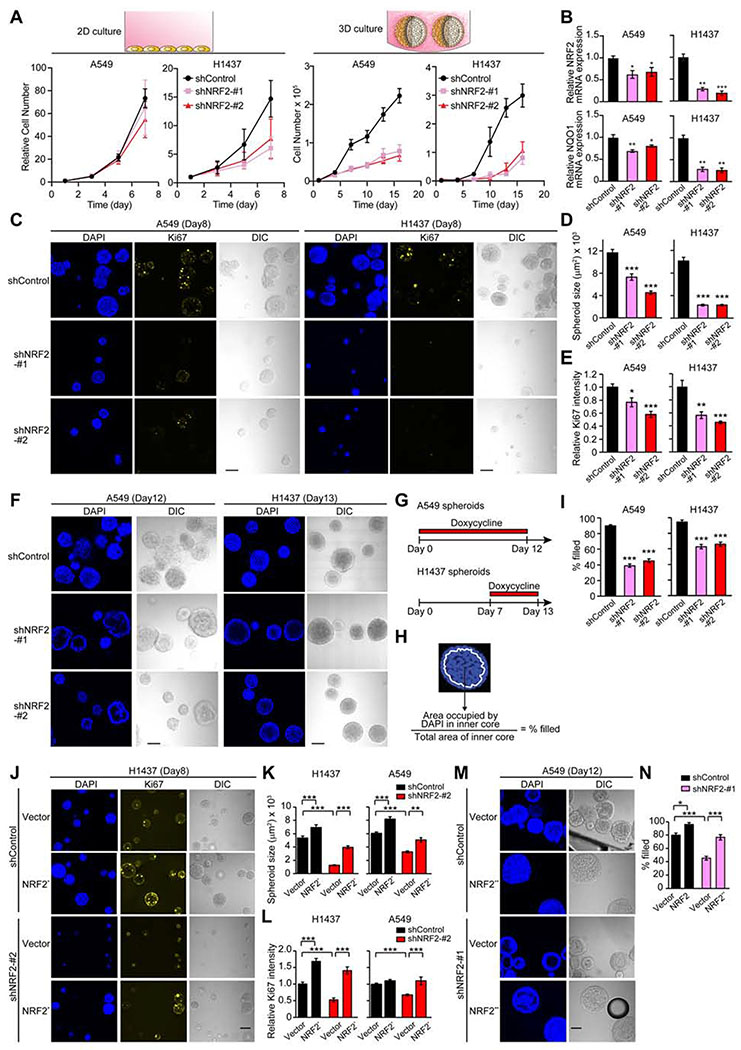
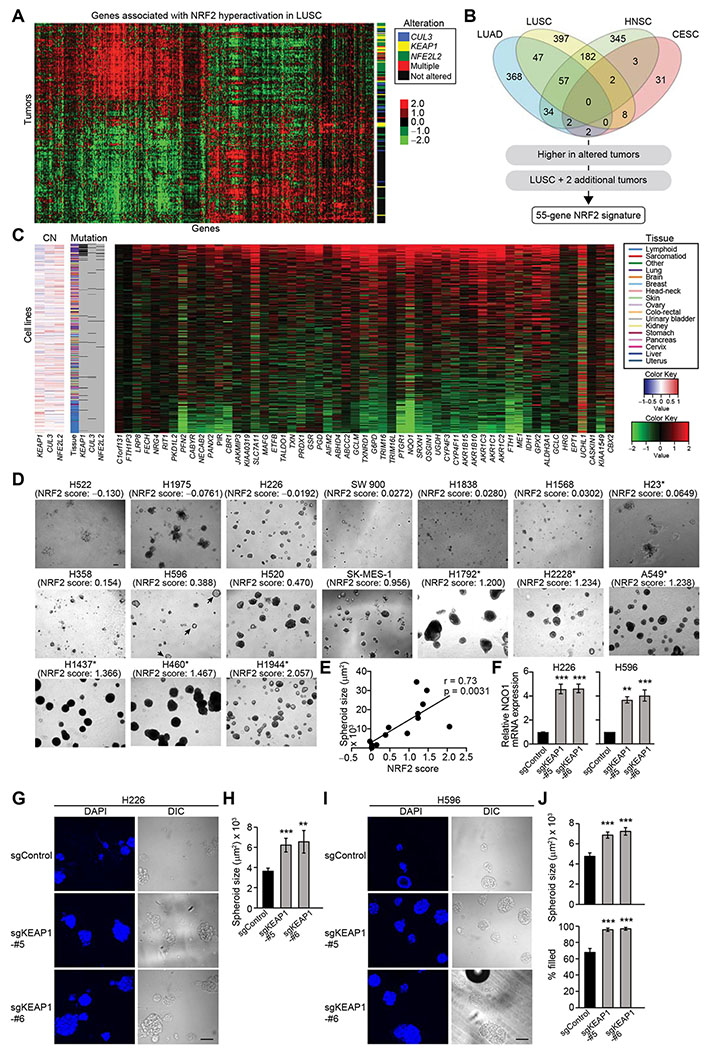
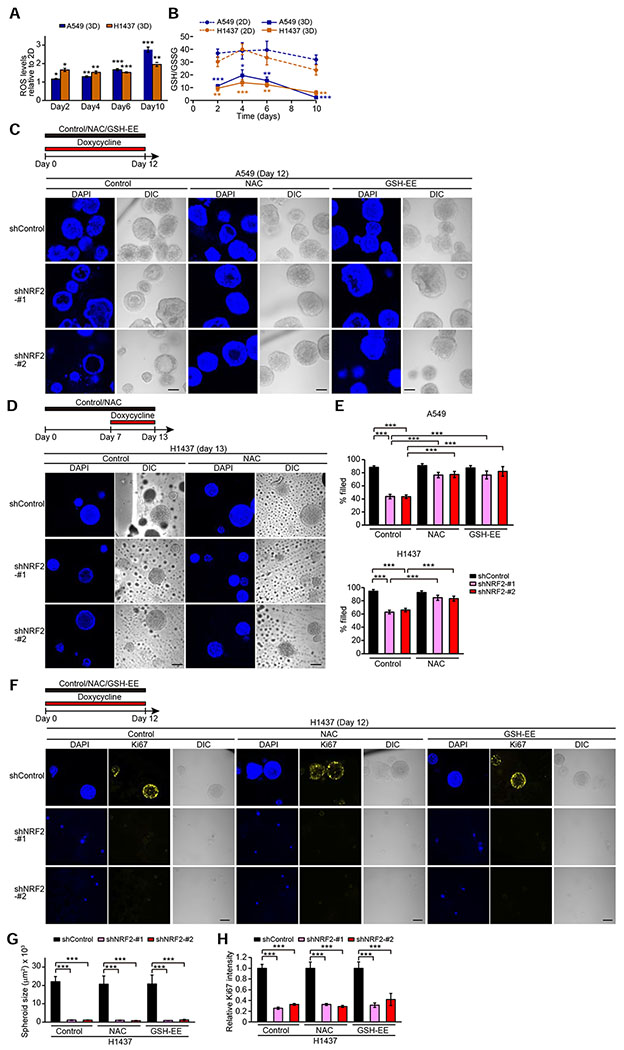
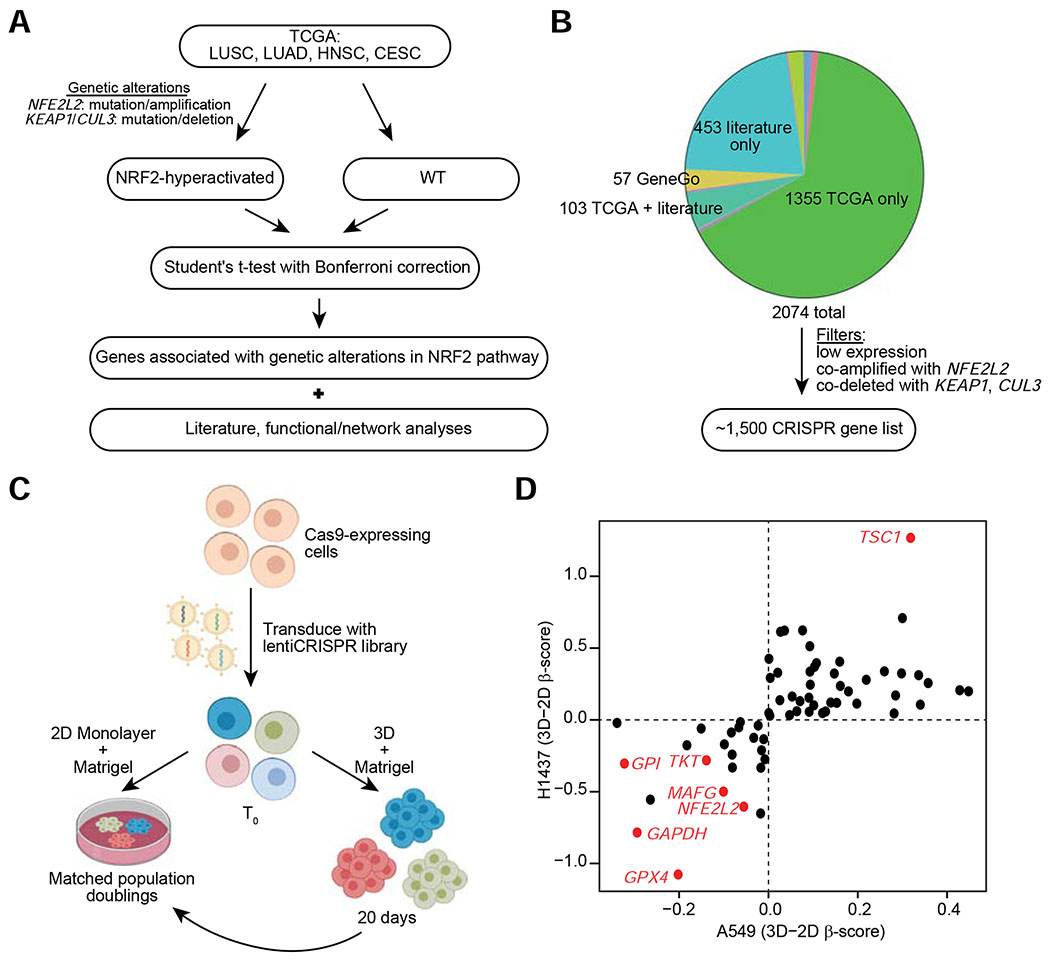
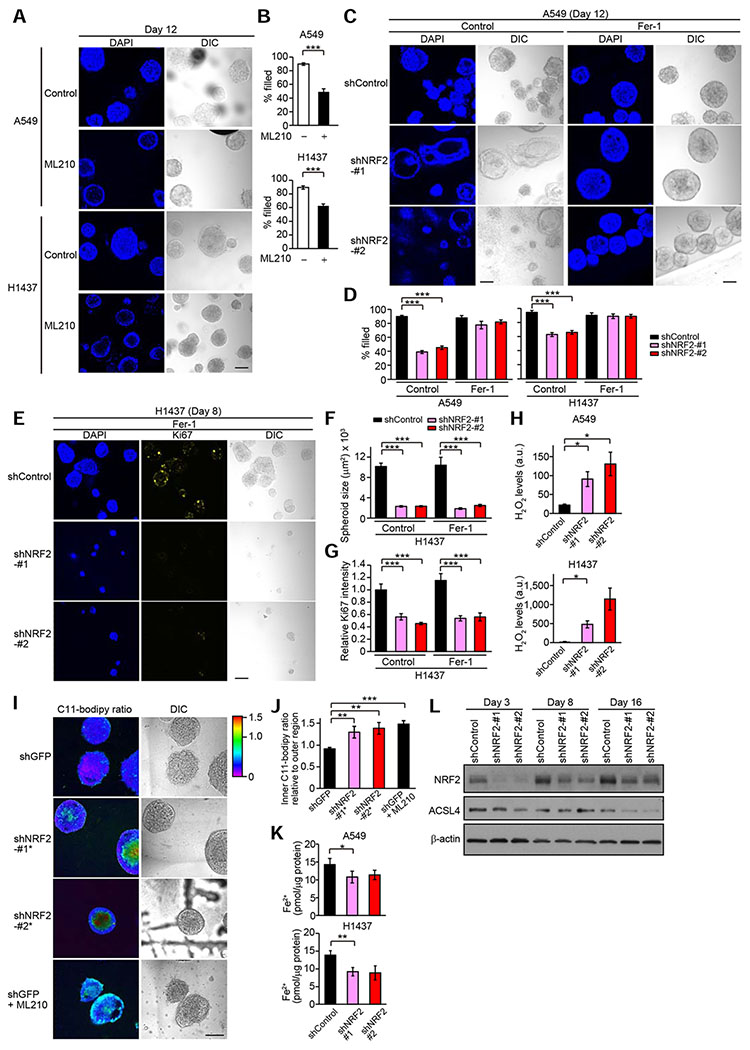
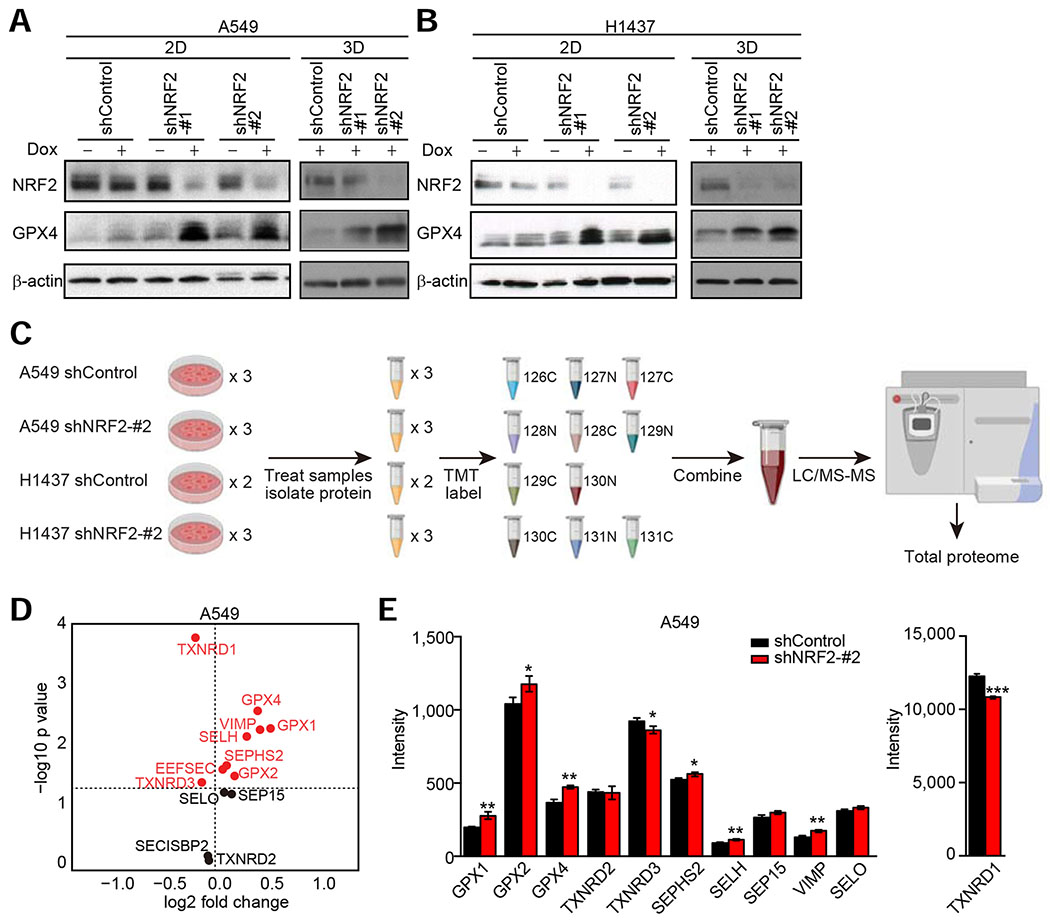
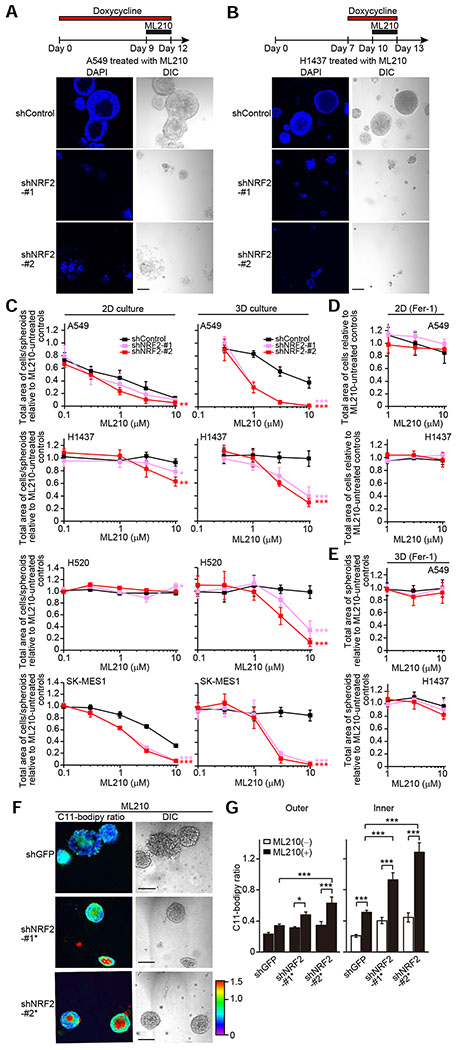
Cancer-associated mutations that stabilize NRF2, an oxidant defense transcription factor, are predicted to promote tumor development. Here, utilizing 3D cancer spheroid models coupled with CRISPR-Cas9 screens, we investigate the molecular pathogenesis mediated by NRF2 hyperactivation. NRF2 hyperactivation was necessary for proliferation and survival in lung tumor spheroids. Antioxidant treatment rescued survival but not proliferation, suggesting the presence of distinct mechanisms. CRISPR screens revealed that spheroids are differentially dependent on the mammalian target of rapamycin (mTOR) for proliferation and the lipid peroxidase GPX4 for protection from ferroptosis of inner, matrix-deprived cells. Ferroptosis inhibitors blocked death from NRF2 downregulation, demonstrating a critical role of NRF2 in protecting matrix-deprived cells from ferroptosis. Interestingly, proteomics analyses show global enrichment of selenoproteins, including GPX4, by NRF2 downregulation, and targeting NRF2 and GPX4 killed spheroids overall. These results illustrate the value of spheroid culture in revealing environmental or spatial differential dependencies on NRF2 and reveal exploitable vulnerabilities of NRF2-hyperactivated tumors.

Keywords: oxidative stress, cancer, cell death, ferroptosis, 3D culture, NRF2, CRISPR screening, selenoprotein, GPX4.


Conflict of interest statement

Declaration of Interests J.S.B. receives funding for this project from F. Hoffmann-La Roche Ltd. J.S.B. is a consultant for Agios Pharmaceuticals, eFFECTOR Therapeutics, and Frontier Medicines. I.S.H. is a consultant for ONO Pharmaceuticals US.

Figures

Figure 1.
Figure 1.. Downregulation of NRF2 Significantly Impacts Cell Growth in 3D Culture.
(A) Growth of the indicated cell lines in 2D and 3D culture conditions. For A549 cells, data shown as mean ± SEM from three independent experiments. For H1437 cells, data shown as mean ± SD from one representative experiment out of two independent experiments performed in duplicate–quadruplicate. (B) mRNA expression of NRF2 and NQO1 in the indicated cell lines after 72 hours of shRNA induction in 2D culture from three independent experiments. Data were normalized to shControl. (C) Representative confocal images of the indicated spheroids from three independent experiments. (D) Quantification of spheroid size from experiments described in (C) (n = 55–112). (E) Quantification of Ki67 signal relative to shControl from experiments described in (C) (n = 22–46). (F) Representative confocal images of the indicated spheroids from three independent experiments. (G) Timeline of doxycycline treatment (1 μg/ml) in (F). (H) Definition of inner space and calculation of % filled. White line represents the boundary of inner space. (I) Percentage of filled inner space from experiments described in (F) (n = 45–77). (J) Representative confocal images of the indicated spheroids from two independent experiments. (K) Quantification of spheroid size in the indicated day-8 spheroids (n = 59–150). (L) Quantification of Ki67 signal relative to spheroids transduced with both shControl and an empty vector in the indicated day-8 spheroids (n = 59–150). (M) Representative confocal images of the indicated spheroids from two independent experiments. (N) Percentage of filled inner space from experiments described in (M) (n = 14–22). Unless otherwise noted, the cells were treated with 1 μg/ml doxycycline throughout the experiments. In (B), (D), (E), and (I), unpaired two-tailed t-test was used to determine statistical significance (*p < 0.05, **p < 0.01, and ***p < 0.001 compared to shControl). In (K), (L), and (N), one-way ANOVA was used to determine statistical significance (*p < 0.05, **p < 0.01, and ***p < 0.001). Scale bar represents 100 μm. All data shown as mean ± SEM unless otherwise indicated.
Figure 2.
Figure 2.. High NRF2 Activity Is Required for Efficient Spheroid Formation.
(A) Genes associated with NRF2 hyperactivation in TCGA LUSC samples (n = 198). Heatmap shows log2 median-centered RNA-seq gene expression data. Status of genetic alterations in the NRF2 pathway for each tumor is displayed on the right. (B) Venn diagram showing the number of genes associated with NRF2 hyperactivation in TCGA cancer types. The 1,466 genes associated with NRF2 hyperactivation were further limited to a 55-gene NRF2 signature using the outlined criteria. (C) Expression of the 55 NRF2 signature genes in 675 cancer cell lines. Heatmap shows log2 median-centered RNA-seq gene expression data. Copy number (CN) alteration and mutation status of KEAP1, CUL3, and NFE2L2 as well as tissue of origin are displayed. (D) Representative images of day-16 spheroids of lung cancer cell lines. Asterisks indicate the existence of genetic alterations in the NRF2 pathway. (E) Correlation between NRF2 score and spheroid size from experiments described in (D). H522, H1975, and H23 cells were excluded from the correlation analysis because they do not form spheroids but just clumps of cells. (F) mRNA expression of NQO1 in the indicated cell lines from three independent experiments. Data were normalized to sgControl. (G) Representative confocal images of the indicated day-14 spheroids from two independent experiments. (H) Quantification of spheroid size from experiments described in (G) (n = 65–97). (I) Representative confocal images of the indicated day-12 spheroids from two independent experiments. (J) Quantification of spheroid size and percentage of filled inner space from experiments described in (I) (n = 53–91). In (F), (H), and (J), one-way ANOVA (F) or unpaired two-tailed t-test (H and J) was used to determine statistical significance. **p < 0.01 and ***p < 0.001 compared to sgControl. Scale bar represents 100 μm. All data shown as mean ± SEM.
Figure 3.
Figure 3.. Antioxidant Treatment Rescues Survival of Inner Cells but Not Loss of Proliferation Caused by NRF2 Downregulation in Spheroids.
(A) ROS levels relative to monolayer cells in the indicated spheroids from three independent experiments. (B) GSH/GSSG ratio in the indicated cells cultured in 2D or 3D from three independent experiments. (C and D) Representative confocal images of the indicated spheroids from two independent experiments. (E) Percentage of filled inner space from experiments described in (C) and (D) (n = 10–64). (F) Representative confocal images of the indicated spheroids from two independent experiments. (G) Quantification of spheroid size from experiments described in (F) (n = 4–24). (H) Quantification of Ki67 signal relative to NAC- and GSH-EE-untreated spheroids with shControl from experiments described in (F) (n = 4–24). In (A) and (B), unpaired two-tailed t-test was used to determine statistical significance (*p < 0.05, **p < 0.01, and ***p < 0.001 compared to 2D cells). In (C), (D), and (F), the spheroids were treated with 1 μg/ml doxycycline and either vehicle, 1 mM NAC, or 1 mM GSH-EE for the indicated time period. In (E), (G), and (H), one-way ANOVA was used to determine statistical significance (***p < 0.001). Scale bar represents 100 μm. All data shown as mean ± SEM.
Figure 4.
Figure 4.. CRISPR Screening Approach to Identify Dependencies in Spheroids of NRF2-Hyperactivated Cell Lines.
(A) Schematic for the identification of genes for the focused CRISPR library. (B) Distribution of source of genes in the focused CRISPR library. The most common sources of genes are highlighted. Non-identified groups include genes derived from more than one of the common sources or through Project Achilles. Expression filters were applied to further narrow down the list to ~1,500 genes. (C) Schematic for the pooled CRISPR screening approach. (D) Hit genes common to both A549 and H1437 cell lines. For each cell line, the difference in β-score between 3D and 2D growth culture conditions is plotted.
Figure 5.
Figure 5.. NRF2 Controls Survival of Inner Spheroid Cells through Protection from Ferroptosis.
(A) Representative confocal images of the indicated spheroids from three independent experiments. Spheroids were treated with or without 10 μM ML210 for the last three days. (B) Percentage of filled inner space from experiments described in (A) (n = 35–77). (C) Representative confocal images of the indicated spheroids from three independent experiments. Spheroids were treated with 1 μg/ml doxycycline and either vehicle or 3 μM Fer-1 for 12 days. (D) Percentage of filled inner space from experiments described in (C) (A549) and Figure S4G (H1437) (n = 11–77). (E) Representative confocal images of the indicated spheroids from three independent experiments. (F) Quantification of spheroid size from experiments described in (E) (n = 18–112). (G) Quantification of Ki67 signal relative to Fer-1-untreated spheroids with shControl from experiments described in (E) (n = 4–24). (H) H2O2 levels (arbitrary units) in the indicated day-10 spheroids from three independent experiments. (I) Representative C11-Bodipy ratiometric images of the indicated day-10 A549 spheroids from two independent experiments. Spheroids were treated with or without 1 μM ML210 for the last three days. (J) Quantification of C11-Bodipy ratio in inner region relative to outer region from experiments described in (I) (n = 12–20). (K) Fe2+ levels in the indicated day-10 spheroids from three independent experiments. (L) Immunoblot analysis of NRF2 and ACSL4 in H1437 spheroids. In (E–G), H1437 spheroids were treated with 1 μg/ml doxycycline and either vehicle or 3 μM Fer-1 throughout the 3D culture. In (H), (K), and (L), the spheroids were treated with 1 μg/ml doxycycline throughout the experiments. In (B), (H), and (J), unpaired two-tailed t-test was used to determine statistical significance. In (D), (F), and (G), one-way ANOVA was used to determine statistical significance. In (K), paired two-tailed t-test was used to determine statistical significance. *p < 0.05, **p < 0.01, and ***p < 0.001. All data shown as mean ± SEM. Scale bar represents 100 μm.
Figure 6.
Figure 6.. Downregulation of NRF2 Induces Global Enrichment of Selenoproteins Including GPX4.
(A and B) Immunoblot analysis of NRF2 and GPX4 in the indicated cells. In (B), the blots for NRF2 and β-actin in 3D are from Figure 5L as these experiments were performed concurrently as the experiments presented in Figure 6B. (C) Schematic of proteomics approach. For H1437 cells with shControl, two samples were used for the experiment because the plex was limited to 11 for each TMT experiment. (D) All selenoproteins or proteins required for selenoprotein biosynthesis detected by proteomics in A549 cells transduced with shControl or shNRF2-#2. Data presented are mean log2 (fold change) of shNRF2-#2 compared to shControl cells from three technical replicates. (E) Intensity of all selenoproteins detected in the indicated A549 cells. Data presented are mean ± SD from three technical replicates. Uncorrected Student’s t-test was used to determine statistical significance. *p < 0.05, **p < 0.01, and ***p < 0.001. Unless otherwise noted, the cells were cultured for 72 hours upon treatment with 1 μg/ml doxycycline.
Figure 7.
Figure 7.. Combined Loss of NRF2 and Inhibition of GPX4 Leads to Death of both Inner and Outer Cells of Spheroids.
(A and B) Representative confocal images of the indicated spheroids from three independent experiments. Spheroids were treated with 10 μM ML210 and 1 μg/ml doxycycline for the indicated time periods. (C–E) Total area of cells/spheroids relative to ML210-untreated controls in the indicated cells treated with ML210 for the last three days. A549 and H1437 cells were cultured in 2D for four days or 3D for 12 days in the presence of either 1 μg/ml doxycycline (C) or both 1 μg/ml doxycycline and 3 μM Fer-1 (D and E). H520 and SK-MES-1 cells were cultured in either 2D for four days or 3D for 15 days in the presence of 1 μg/ml doxycycline. (F) Representative C11-Bodipy ratiometric images of the indicated day-10 A549 spheroids upon treatment with 1 μM ML210 for the last three days from two independent experiments. (G) Quantification of C11-Bodipy ratio in the indicated day-10 A549 spheroids treated with or without 1 μM ML210 for the last three days. The data for both ML210-untreated spheroids and ML210-treated spheroids with shControl are from Figures 5I, 5J, and S4I as these experiments were performed concurrently as the experiment presented in Figure 7G. Data shown as mean ± SEM (n = 8–20). One-way ANOVA was used to determine statistical significance. *p < 0.05 and ***p < 0.001. In (C), (D), and (E), data shown as mean ± SD from four independent experiments, and two-way ANOVA was used to determine statistical significance (*p < 0.05, **p < 0.01, and ***p < 0.001 compared to shControl). Scale bar represents 100 μm.

Comment in

References

    1. Best SA, De Souza DP, Kersbergen A, Policheni AN, Dayalan S, Tull D, Rathi V, Gray DH, Ritchie ME, McConville MJ, et al. (2018). Synergy between the KEAP1/NRF2 and PI3K pathways drives non-small-cell lung cancer with an altered immune microenvironment. Cell Metab. 27, 935–943. - PubMed
    1. Cai LL, Ruberto RA, Ryan MJ, Eaton JK, Schreiber SL, and Viswanathan VS (2020). Modulation of ferroptosis sensitivity by TXNRD1 in pancreatic cancer cells. bioRxiv. 2020: 10.1101/2020.06.25.165647. - DOI
    1. Cao JY, Poddar A, Magtanong L, Lumb JH, Mileur TR, Reid MA, Dovey CM, Wang J, Locasale JW, Stone E, et al. (2019). A genome-wide haploid genetic screen identifies regulators of glutathione abundance and ferroptosis sensitivity. Cell Rep. 26, 1544–1556. - PMC - PubMed
    1. Cescon DW, She D, Sakashita S, Zhu CQ, Pintilie M, Shepherd FA, and Tsao MS (2015). NRF2 pathway activation and adjuvant chemotherapy benefit in lung squamous cell carcinoma. Clin. Cancer Res. 27, 2499–2505. - PubMed
    1. Chandel NS, and Tuveson DA (2014). The promise and perils of antioxidants for cancer patients. N. Engl. J. Med 377, 177–178. - PubMed

Publication types

MeSH terms

Substances